

Ethereum Price Forecast: ETH recovery imminent with Etherealize launch as Pectra upgrade slated for March 11
Ethereum price today: $3,200
- Ethereum will likely see increased institutional adoption with the launch of marketing and promotional arm Etherealize.
- Ethereum core developers aim to launch the Pectra mainnet upgrade on March 11.
- Ethereum continues consolidation as a right-angled broadening wedge pattern suggests a rally above $7,000.
Ethereum (ETH) trades near $3,200 as positive sentiment is slowly returning into its ecosystem with the launch of Etherealize and anticipation surrounding the potential March 11 Pectra mainnet upgrade.
Etherealize gets Ethereum community excited with Pectra upgrade set for March 11
The Ethereum community has been buzzing with excitement following the launch of Etherealize, a new organization that aims to promote and accelerate the institutional adoption of Ethereum.
Dubbed an institutional marketing and product arm for the Ethereum ecosystem, Etherealize is seen among the crypto community as the answer to Ethereum's branding and marketing woes.
Etherealize founder Vivek Raman, a former bond trader and his founding team stated that they're building a product suite for instructions and a content hub to educate the public about Ethereum.
"Our team has 200+ years of combined experience across TradFi and crypto. Wall St is merging with the best of Ethereum's ecosystem as one team," the Etherealize team wrote in an X post on Wednesday. "We have met with hundreds of institutions and can conclude: Ethereum is ready."
Etherealize is partly funded by Ethereum co-founder Vitalik Buterin and the Ethereum Foundation (EF).
INTRODUCING ETHEREALIZE
— Etherealize (@Etherealize_io) January 22, 2025
An institutional marketing and product arm for the @ethereum ecosystem
Our goal? To accelerate adoption by bringing institutions to Ethereum: the digital economy of tomorrow
All roads flow through ETH. We’ll show the world why
Here’s our plan:
(1/7)
The launch of Etherealize comes at a time when the EF has faced harsh criticism concerning its leadership structure, poor marketing efforts and roll-up-centric roadmap.
Meanwhile, in a call on Thursday, Ethereum core developers agreed on a tentative timeline with March 11 as the potential date for the Pectra upgrade to go live on the mainnet.
According to Galaxy Digital's Christine Kim, developers discussed bugs in the Pectra Devnet 5. They slated February 12 and 19 as "hopeful activation" of Pectra on the Sepolia and Holesky test networks before the mainnet launch on March 11.
Pectra features a series of upgrades to the Ethereum blockchain, including increasing the maximum staking balance from 32 ETH to 2,048 ETH, privacy improvements and account abstraction features like transaction batching, sponsored transactions and wallet recovery.
Ethereum Price Forecast: ETH mega rally faces $4,100 key hurdle
Ethereum saw $38.91 million in liquidations in the past 24 hours, per Coinglass data. The total amount of liquidated long and short positions is $26.18 million and $12.73 million, respectively.
On the weekly chart, Ethereum is trading within a right-angled broadening wedge with descending trendline support and $4,100 as the resistance.
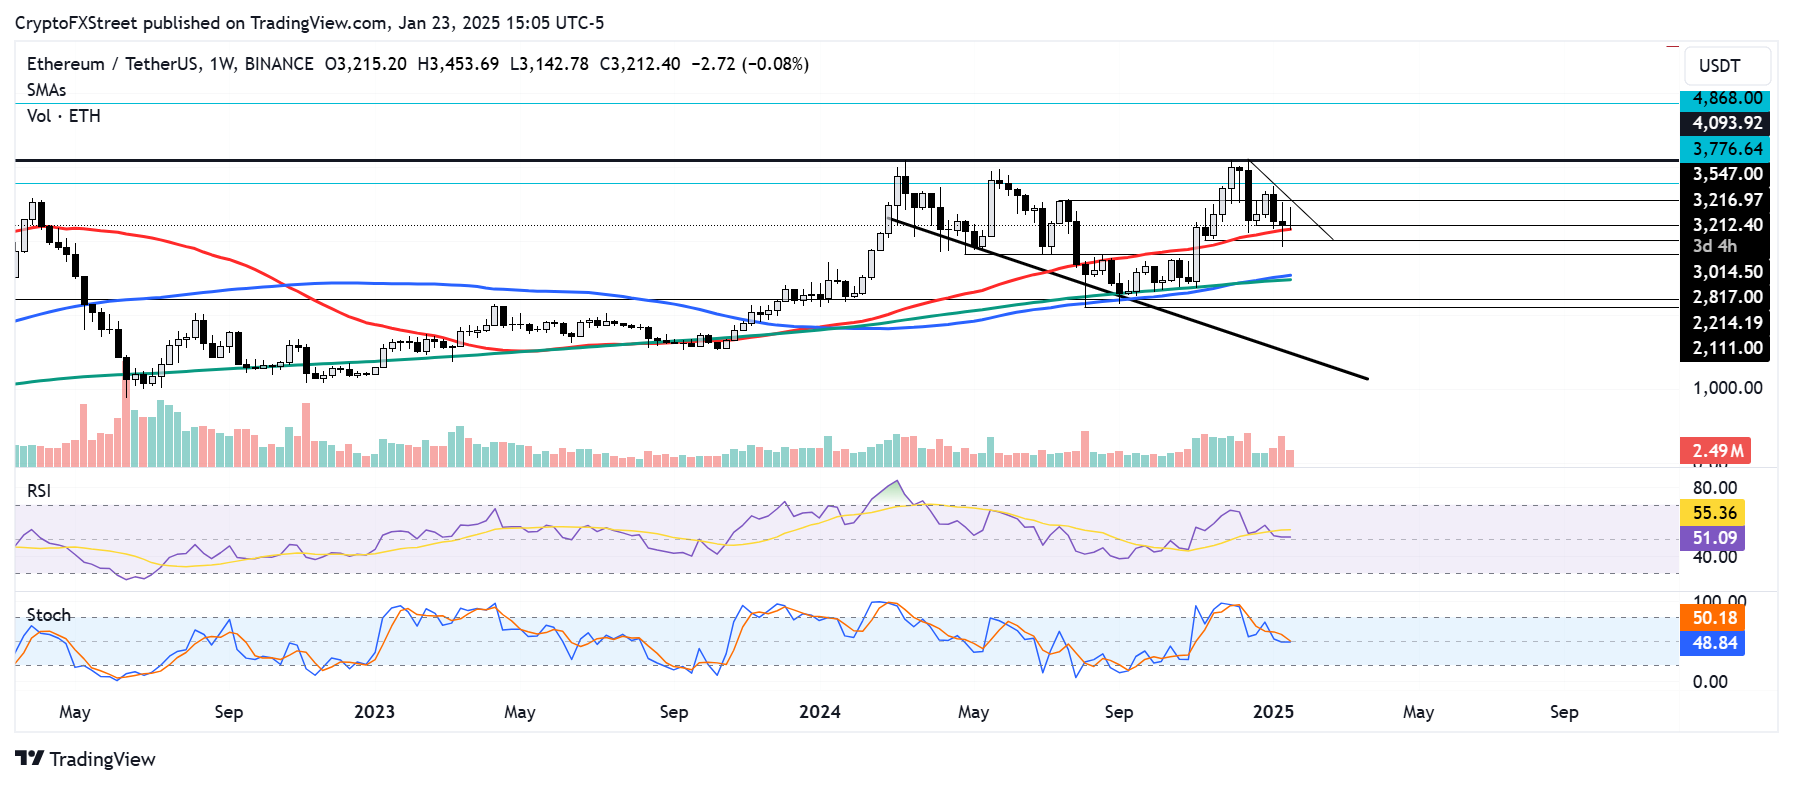
ETH/USDT weekly chart
Notably, the $4,100 level has proved to be a historical sell zone for investors as ETH saw a rejection near it on four occasions in 2024.
If ETH can pull a high volume move above $4,100 in the coming weeks, it could spark a mega rally to set a new all-time high near the $7,000 psychological level. The target is obtained by measuring the height of the wedge and projecting it upward from the potential breakout point.
However, the top altcoin has to break out of its two-week consolidation between the $3,200 and $3,550 range to give strength to the bullish momentum. It faces another key resistance hurdle at $3,770 on the way up.
The Relative Strength Index (RSI) and Stochastic Oscillator (Stoch) are testing their neutral level lines. Crosses below will accelerate the bearish momentum.
A weekly candlestick close below $2,200 will invalidate the bullish thesis and spark a mega-bearish trend for ETH.
Ethereum FAQs
Ethereum is a decentralized open-source blockchain with smart contracts functionality. Its native currency Ether (ETH), is the second-largest cryptocurrency and number one altcoin by market capitalization. The Ethereum network is tailored for building crypto solutions like decentralized finance (DeFi), GameFi, non-fungible tokens (NFTs), decentralized autonomous organizations (DAOs), etc.
Ethereum is a public decentralized blockchain technology, where developers can build and deploy applications that function without the need for a central authority. To make this easier, the network leverages the Solidity programming language and Ethereum virtual machine which helps developers create and launch applications with smart contract functionality.
Smart contracts are publicly verifiable codes that automates agreements between two or more parties. Basically, these codes self-execute encoded actions when predetermined conditions are met.
Staking is a process of earning yield on your idle crypto assets by locking them in a crypto protocol for a specified duration as a means of contributing to its security. Ethereum transitioned from a Proof-of-Work (PoW) to a Proof-of-Stake (PoS) consensus mechanism on September 15, 2022, in an event christened “The Merge.” The Merge was a key part of Ethereum's roadmap to achieve high-level scalability, decentralization and security while remaining sustainable. Unlike PoW, which requires the use of expensive hardware, PoS reduces the barrier of entry for validators by leveraging the use of crypto tokens as the core foundation of its consensus process.
Gas is the unit for measuring transaction fees that users pay for conducting transactions on Ethereum. During periods of network congestion, gas can be extremely high, causing validators to prioritize transactions based on their fees.
Recommended Articles


