


ETH Price Declines as Market Raises Questions About Ethereum’s Future
Ethereum (ETH) price is showing bearish signals across multiple technical indicators as the leading smart contract platform faces mounting pressure. ETH is down more than 3% in the last 24 hours, as questions about its future are raised and competing chains like Solana continue to attract more attention.
ETH has declined almost 15% since reaching its 2025 peak on January 6. Technical analysis suggests further downside could be ahead, with key support levels being tested as momentum indicators point to weakening bullish sentiment.
Ethereum RSI Is Currently Neutral and Going Down
The Ethereum RSI (Relative Strength Index) is currently sitting at 41.6, marking a significant drop from yesterday’s 51.1. After reaching an elevated level of 68 on January 15, the indicator has predominantly oscillated between 40 and 55, suggesting a period of moderate price momentum.
This recent decline below the midpoint of 50 indicates weakening bullish momentum, though not yet entering oversold territory.
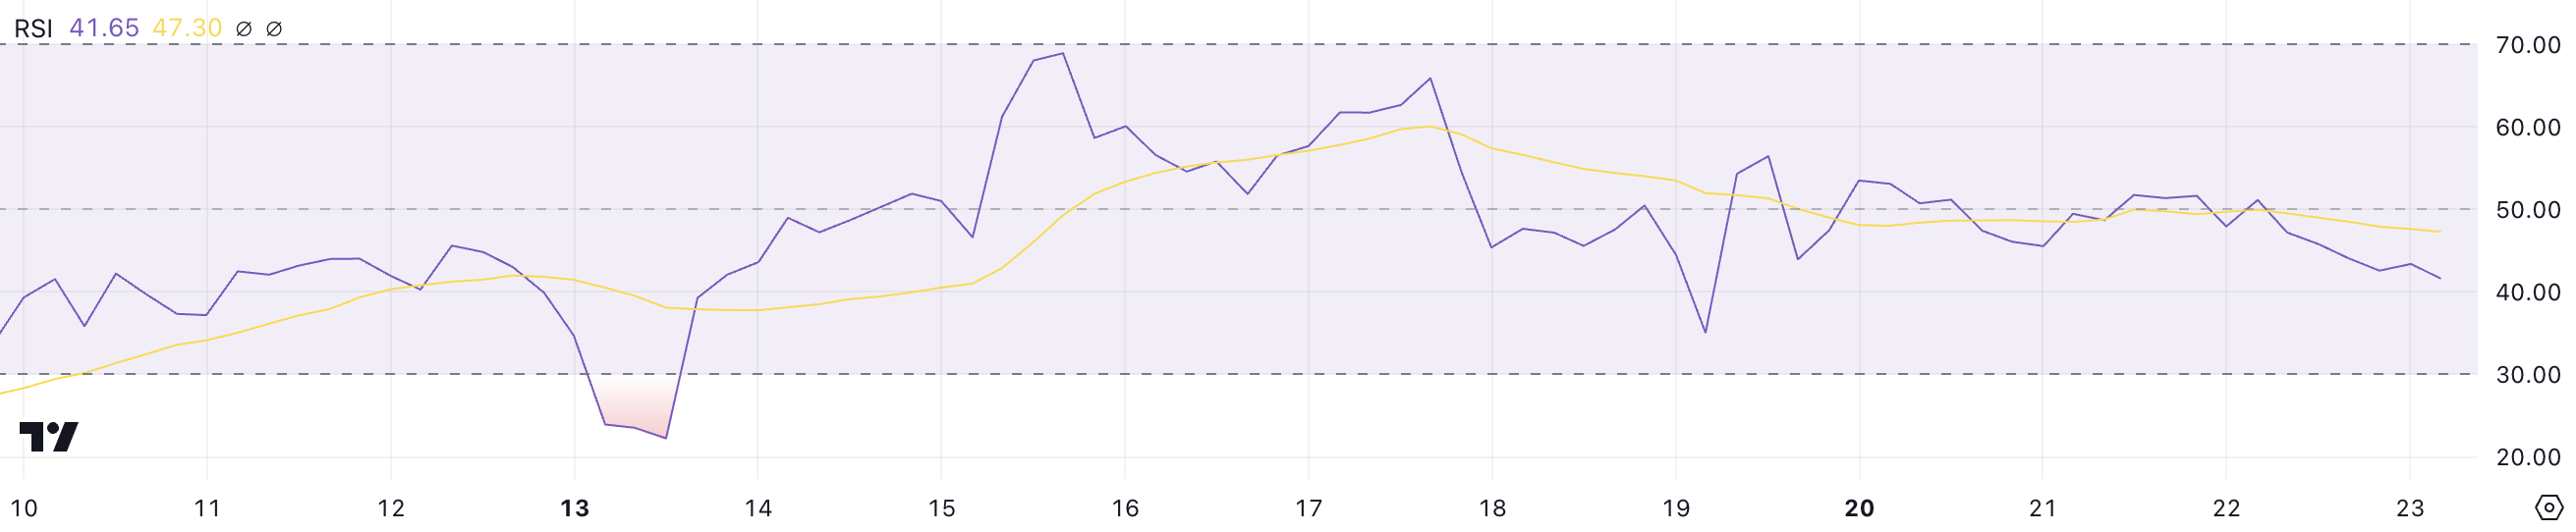 ETH RSI. Source: TradingView
RSI is a momentum oscillator that measures the speed and magnitude of price changes, typically using a 14-day period. The indicator operates on a scale of 0 to 100, with readings above 70 generally considered overbought and below 30 oversold. With ETH current RSI at 41.6, the asset is showing mild bearish momentum but remains in neutral territory.
While this could suggest a potential for further Ethereum decline in the short term, the moderate RSI reading doesn’t signal extreme conditions that would typically precede major price movements, suggesting a period of price consolidation may be more likely.
ETH DMI Shows a Weak Trend
Directional Movement Index (DMI) for Ethereum shows weak overall trend strength with an Average Directional Index (ADX) of 14.1, continuing its sub-20 reading since January 16.
The ADX, which ranges from 0 to 100, measures trend strength regardless of direction. Readings below 20 indicate a weak trend, ranging from 20 to 25 suggest an emerging trend, and above 25 signal a strong trend.
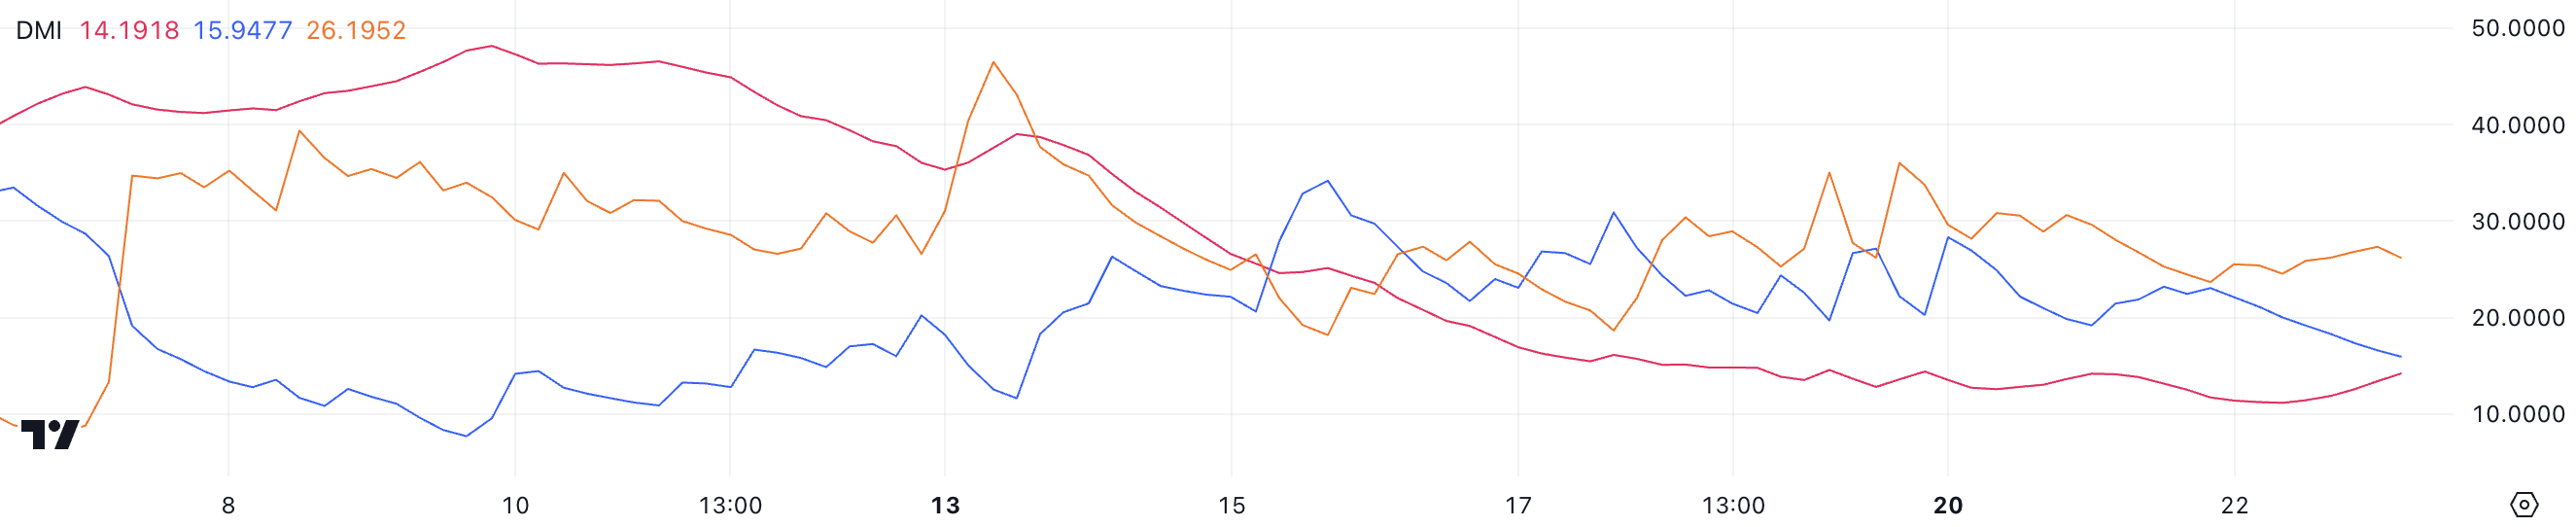 ETH DMI. Source: TradingView
The current bearish signal is evident in the Positive Directional Indicator (+DI) falling to 15.94 from 23 while the Negative Directional Indicator (-DI) rose to 25.94 from 23.68.
With -DI crossing above +DI and exceeding 25, this suggests increasing selling pressure. However, the low ADX indicates the trend lacks strength despite ETH 3% decline in 24 hours. This combination typically suggests a weak downtrend that could either strengthen if ADX rises above 20, or continue ranging if ADX remains low.
ETH Price Prediction: Will Ethereum Fall Below $3,000?
Ethereum Exponential Moving Average (EMA) lines are displaying a bearish pattern, with shorter-period EMAs trading below longer ones, suggesting sustained downward momentum.
The immediate support level sits at $3,158, with a break below potentially triggering a decline to $2,927. Current price action near these levels indicates bears may be testing this crucial support zone.
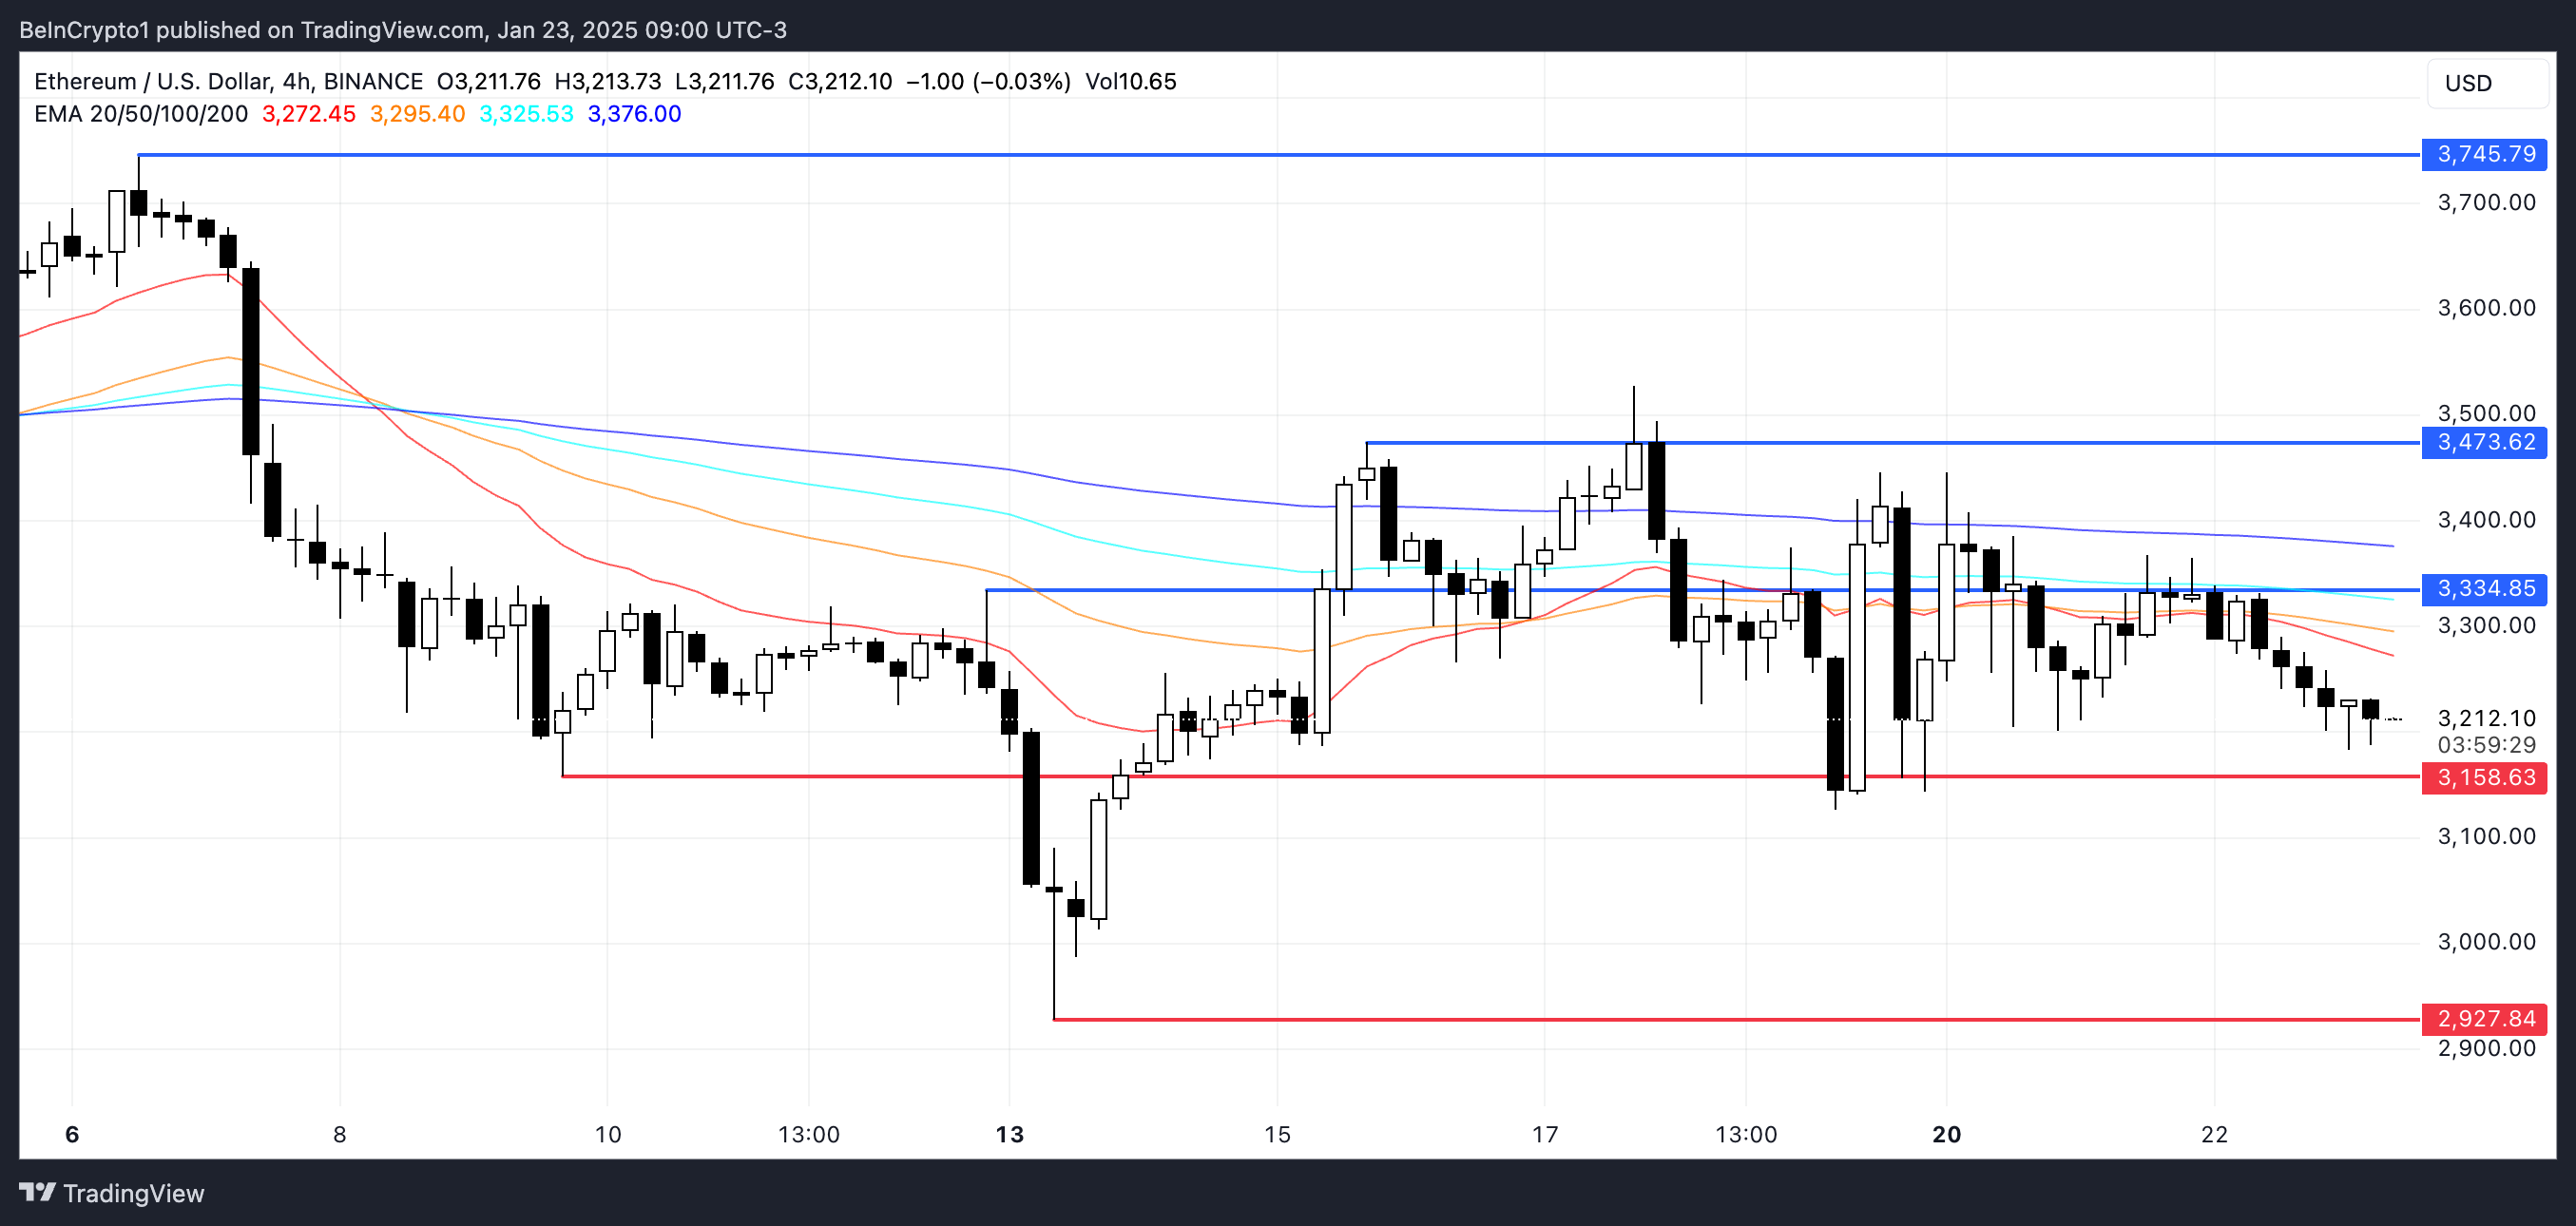 ETH Price Analysis. Source: TradingView
A bullish reversal scenario would require Ethereum price to first overcome resistance at $3,334. If successful, key resistance levels await at $3,473 and $3,745.
However, the bearish EMA configuration suggests upward moves may face significant selling pressure until the shorter-term EMAs can cross above longer-term ones, indicating a trend shift.
Recommended Articles


