


Bitcoin inches closer to $52,000, liquidates over $72 million in short positions
- Bitcoin price hit a peak of $51,828 on Wednesday after breaching the $50,000 psychological level earlier this week.
- BTC price rally liquidated $73.82 million in shorts positions.
- Tuesday marked the largest net inflow to Spot Bitcoin ETFs with $631 million in capital poured into BTC.
Bitcoin price crossed $50,000 earlier this week and hit a peak of $51,828 on Wednesday. The asset’s uptrend was supported by a massive influx of capital into Spot Bitcoin ETFs. On February 13, BTC ETFs recorded the single largest daily inflow at $631 million.
Also read: Ripple unveils plans for crypto custody while XRP price trades sideways
Bitcoin price crosses $50,000 in time for Valentine’s Day
Over $73.82 million in short positions were liquidated in the past 24 hours, according to Coinglass data. The largest asset by market capitalization hit two important milestones this week. BTC price crossed the $50,000 psychological level on Monday and Bitcoin’s market capitalization exceeded the $1 trillion mark on Wednesday.
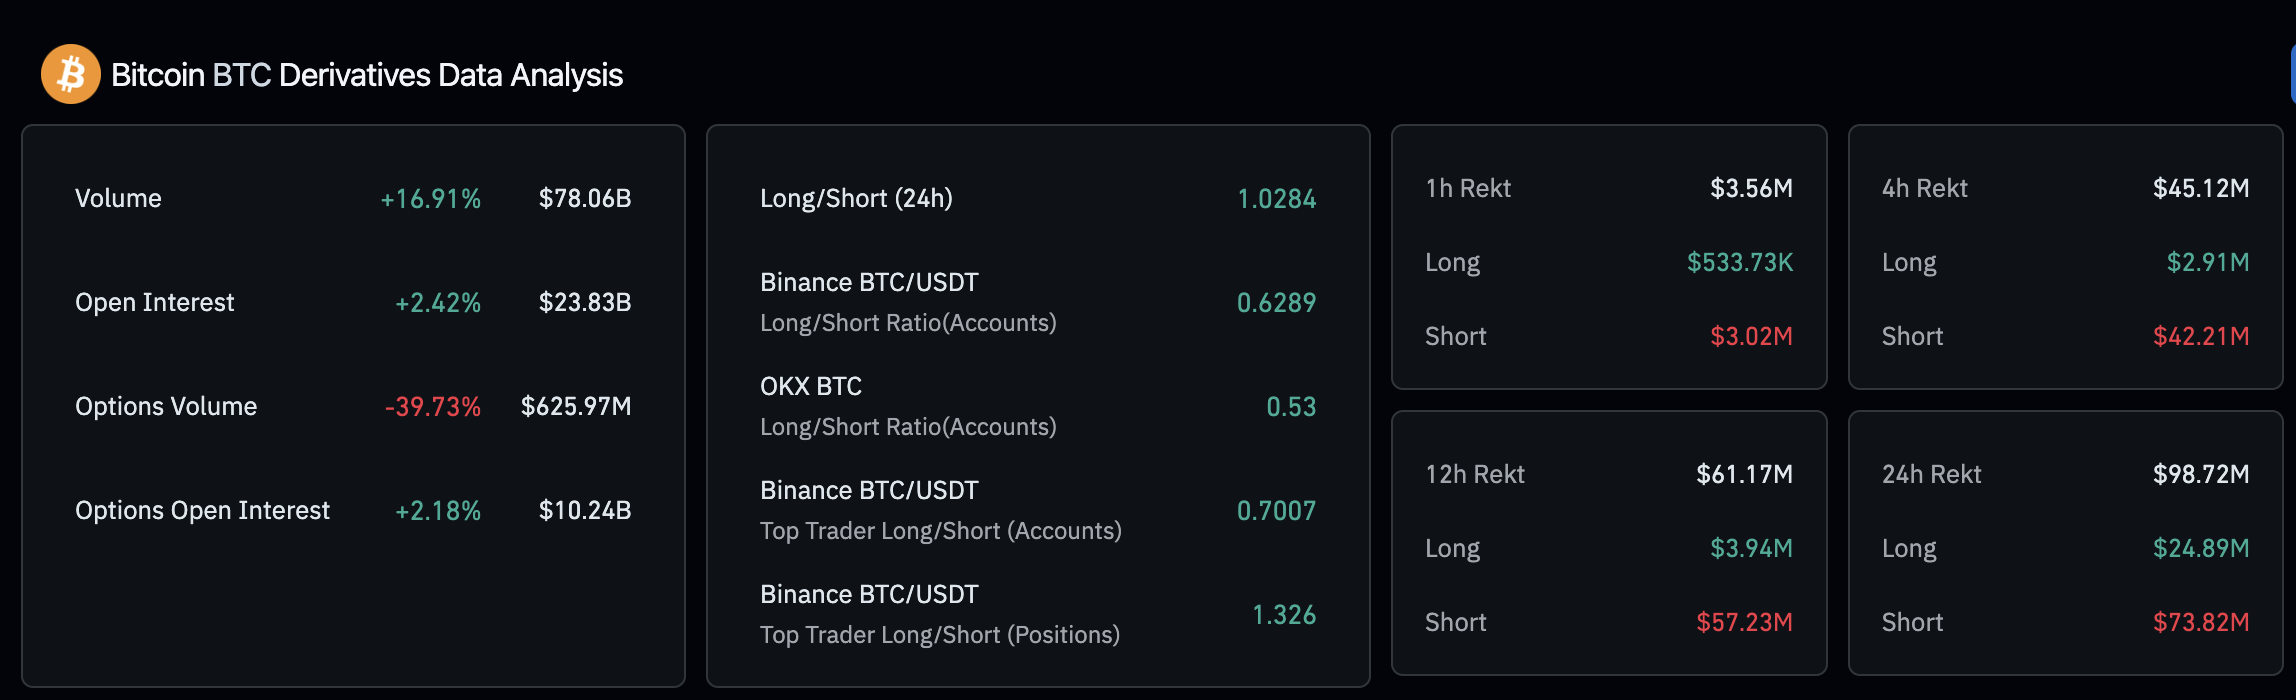
BTC Derivatives Data Analysis. Source: Coinglass Data
Bitcoin’s gains were likely catalyzed by the anticipation surrounding the upcoming halving event in April 2024. Another key catalyst could be the USD inflow to Spot Bitcoin ETFs. February 13 recorded an inflow of $631 million into Bitcoin’s exchange-traded products, a record for the securities product.
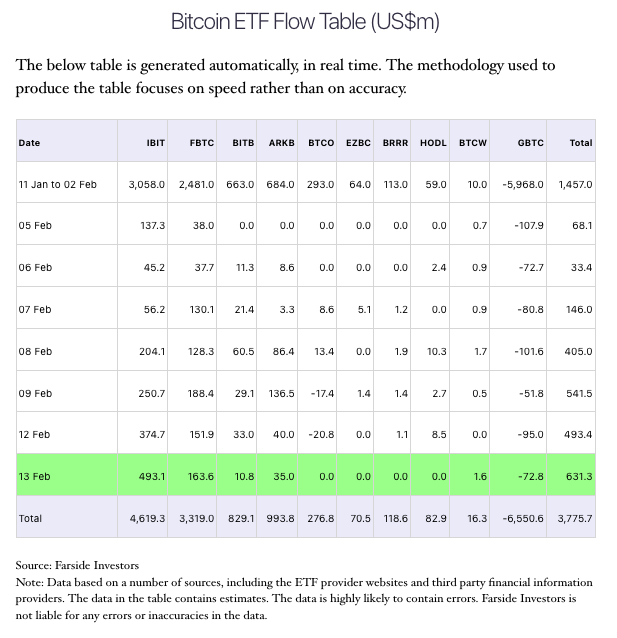
BTC ETF flow table. Source: Farside Investors
Jamie Coutts, a crypto analyst on X, believes that Bitcoin’s ongoing rally has the potential to push BTC price to its previous all-time high prior to the halving event. Coutts cites three reasons why this could occur and why BTC price is likely on the path to $69,044 ahead of April 2024.
- Extreme leverage and positioning from Q4 have been cleansed, according to Coutts. The analyst notes that Options Open Interest is down 40% and Futures funding rates are still positive but less “exuberant” than before.
- Bitcoin ETFs are consistently outpacing supply by at least 2:1, and the halving is still over two months away.
- Only 10% of BTC volume has moved at prices above the current level.
With a clean breach of the resistance at $48,200, Bitcoin has no significant overhead resistance to its target of $69,044.
Spot ETF issuers have accumulated over 200,000 BTC since the Securities and Exchange Commission’s (SEC) approval on January 11. This is likely a key driver of gains in the ongoing cycle as demand for Bitcoin is consistent.

OnChain holdings of Bitcoin ETFs. Source: Dune Analytics
Bitcoin price faces no significant resistance on path to $69,044
Bitcoin price is currently in an uptrend. The asset rallied past the $51,000 level and the consistent USD inflow to Spot Bitcoin ETFs is likely catching up. BTC price has support in the imbalance zone between $45,623 and $46,738 in the event of a correction in Bitcoin.
The green bars on the Moving Average Convergence/Divergence (MACD) indicator signal there is potential in the uptrend. Bitcoin price is likely to continue rallying higher, towards its previous all-time high.
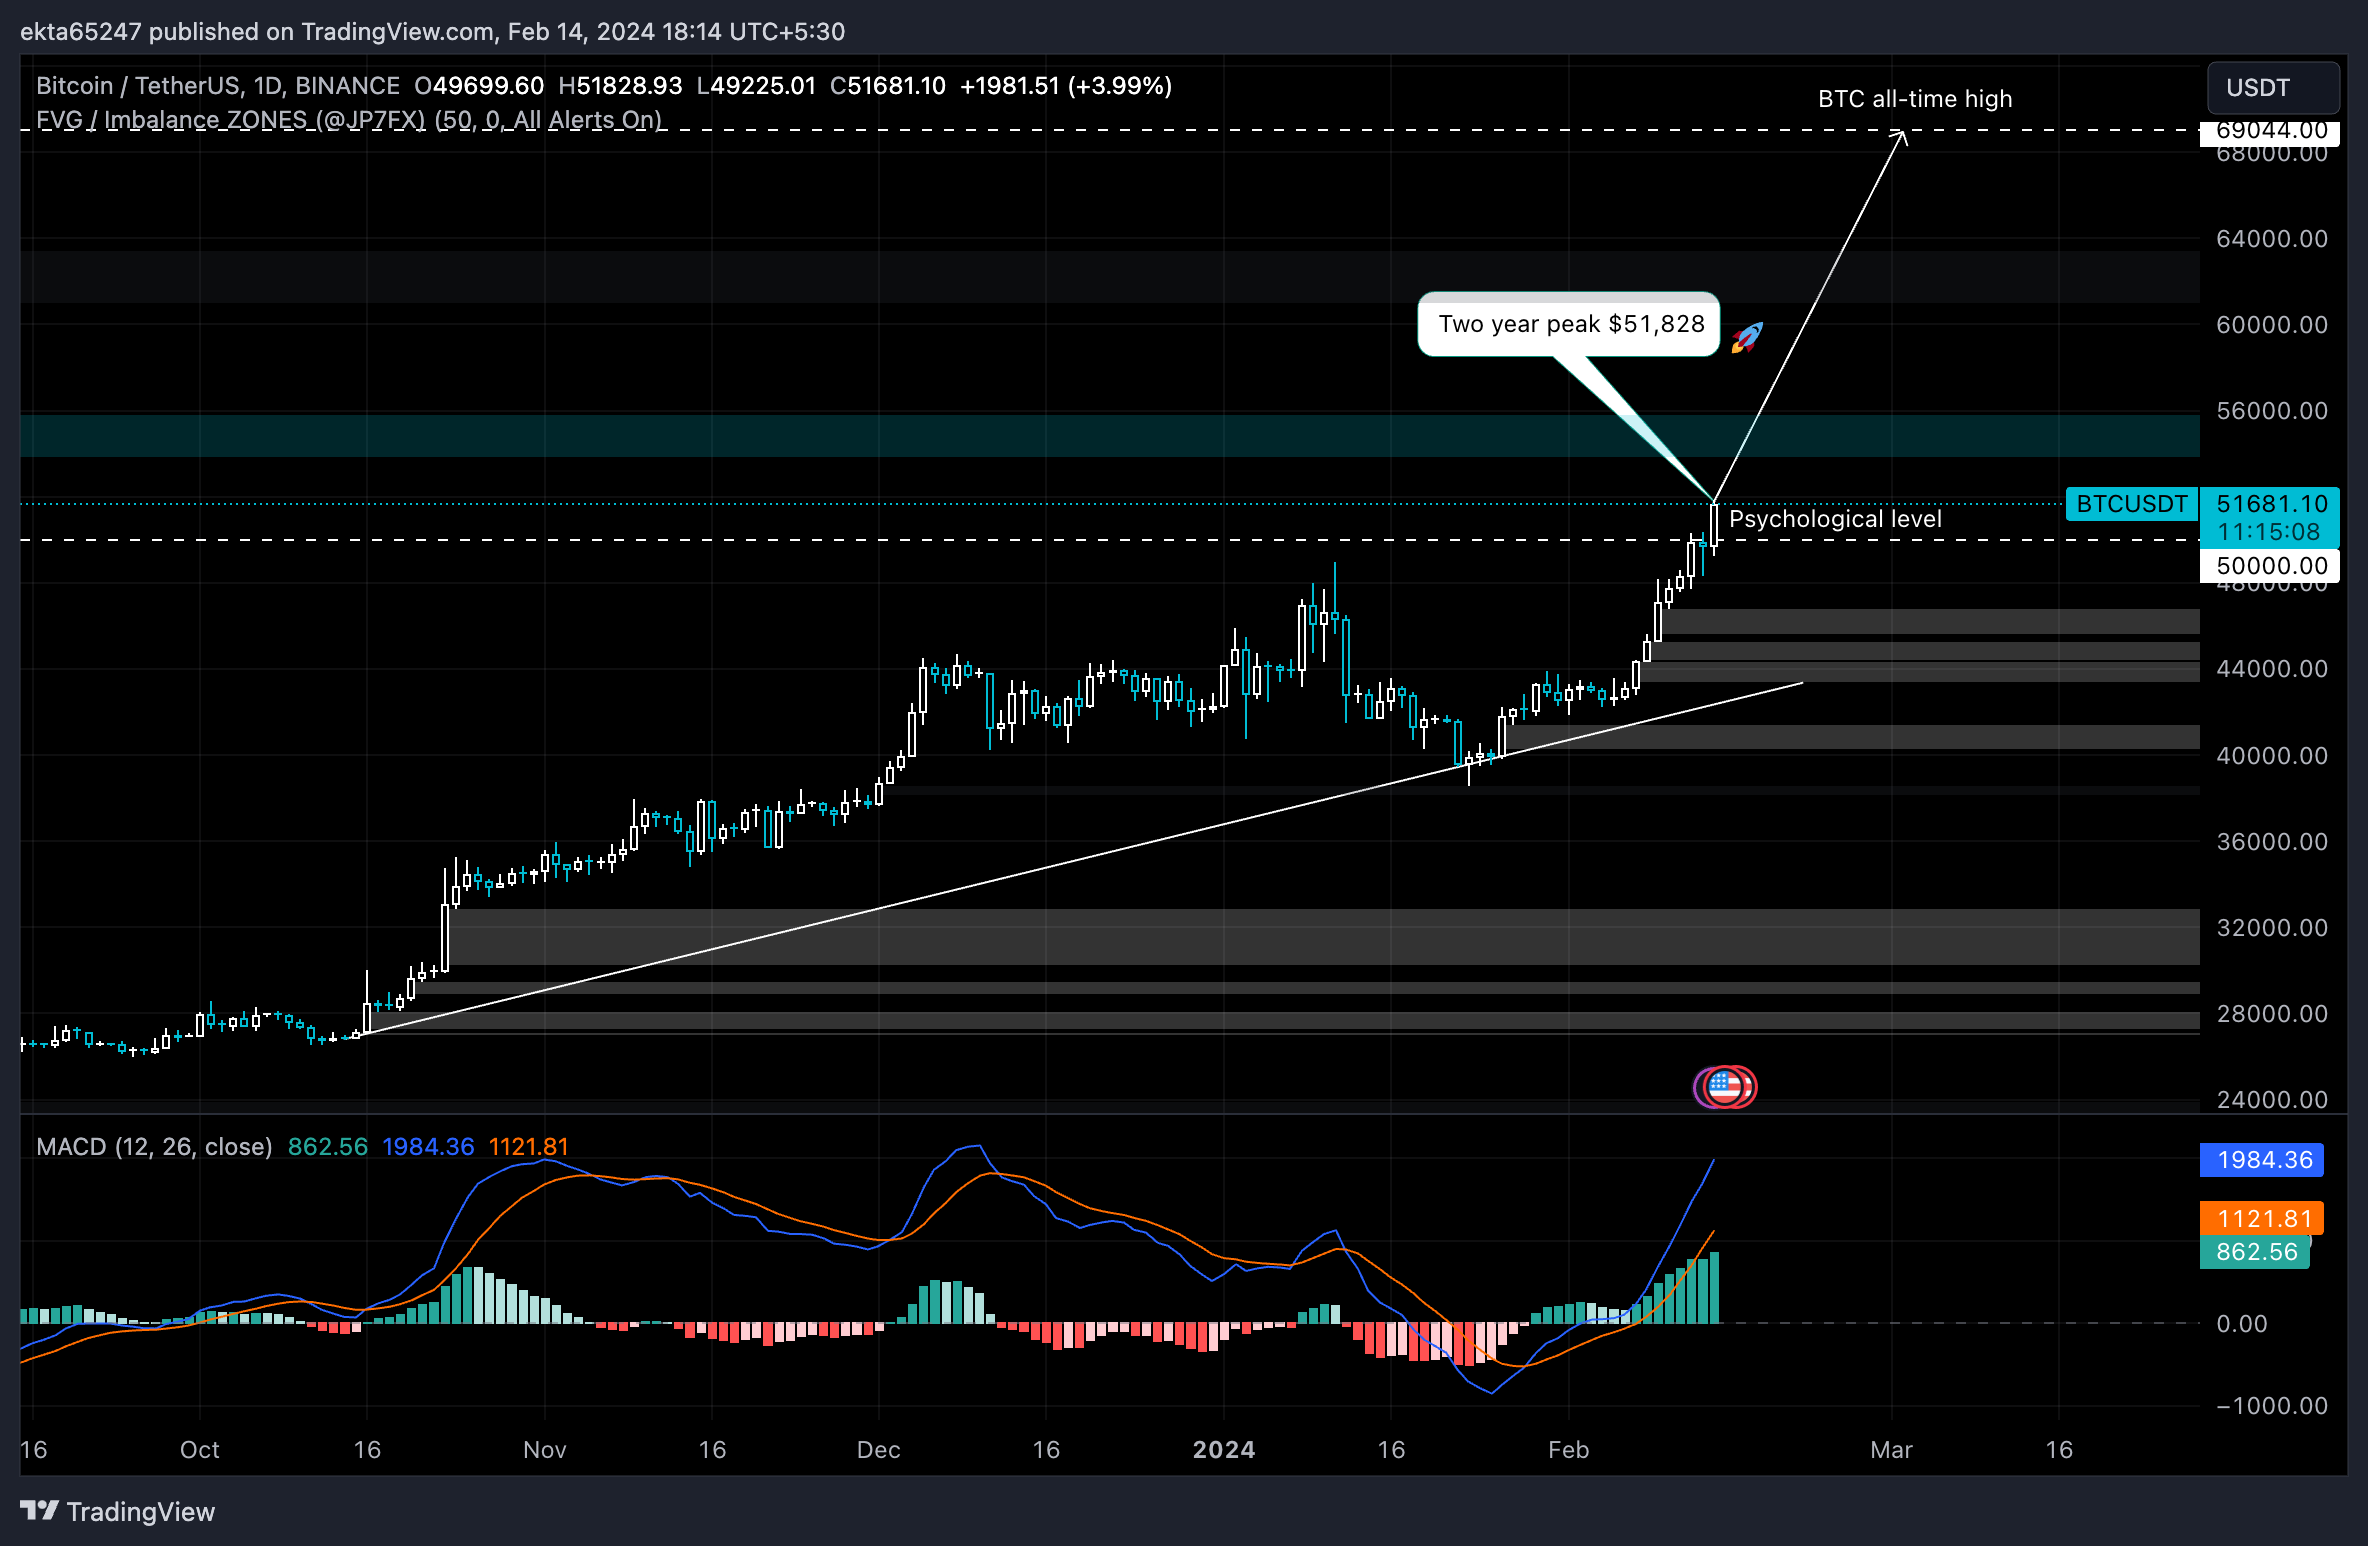
BTC/USDT 1-day chart
A daily candlestick close below the $50,000 psychological level could imply that BTC price is likely to dip into the bullish imbalance zone, between $45,623 and $46,738, before continuing its leg up.
Recommended Articles


