

Shiba Inu (SHIB) Whale Numbers Fall to Month-Low Amid 21% Weekly Price Drop
Shiba Inu (SHIB) price has declined 21% over the past 30 days, with its trading volume down 16% in the last 24 hours, now at $386 million. Technical indicators show mixed signals, with the RSI recovering from oversold levels but remaining neutral, indicating a lack of strong momentum.
Additionally, whale activity has decreased, with the number of large holders recently hitting a month-low, signaling potential distribution. SHIB’s next move will likely depend on whether it holds its key support or breaks through resistance levels to regain bullish momentum.
SHIB RSI Is Currently Neutral
Shiba Inu RSI is at 44.9, recovering from an oversold level of 28 on January 13 and briefly reaching 55 earlier today. This neutral-to-slightly bearish reading suggests a balance between buying and selling pressure, with no strong momentum currently driving the price.
The RSI, or Relative Strength Index, measures price momentum on a scale of 0 to 100, with values below 30 indicating oversold conditions and above 70 signaling overbought levels.
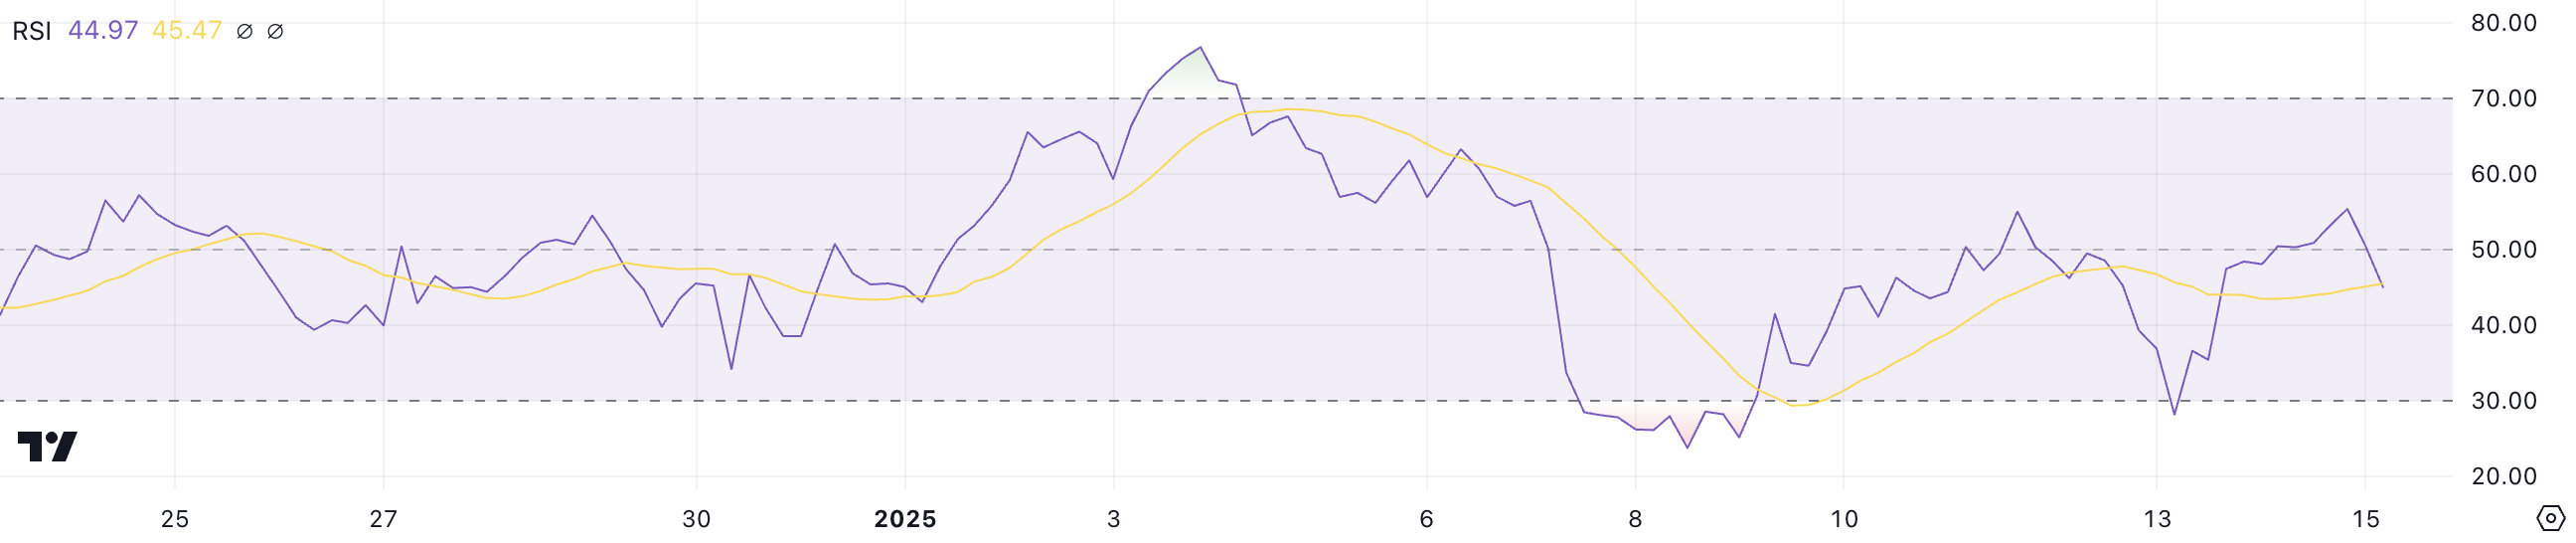 SHIB RSI. Source: TradingView
At 44.9, SHIB RSI suggests consolidation or mild bearish pressure. Further upward movement requires the RSI to break above 50 to signal stronger bullish momentum.
Shiba Inu Whales Are Not Accumulating
The number of whales holding at least 1 billion SHIB has declined from a month-high of 10,930 on December 19 to 10,832 today, following a low of 10,831 two days ago.
This steady decline suggests reduced accumulation by large holders, which could indicate weakening confidence or decreased interest among key market participants.
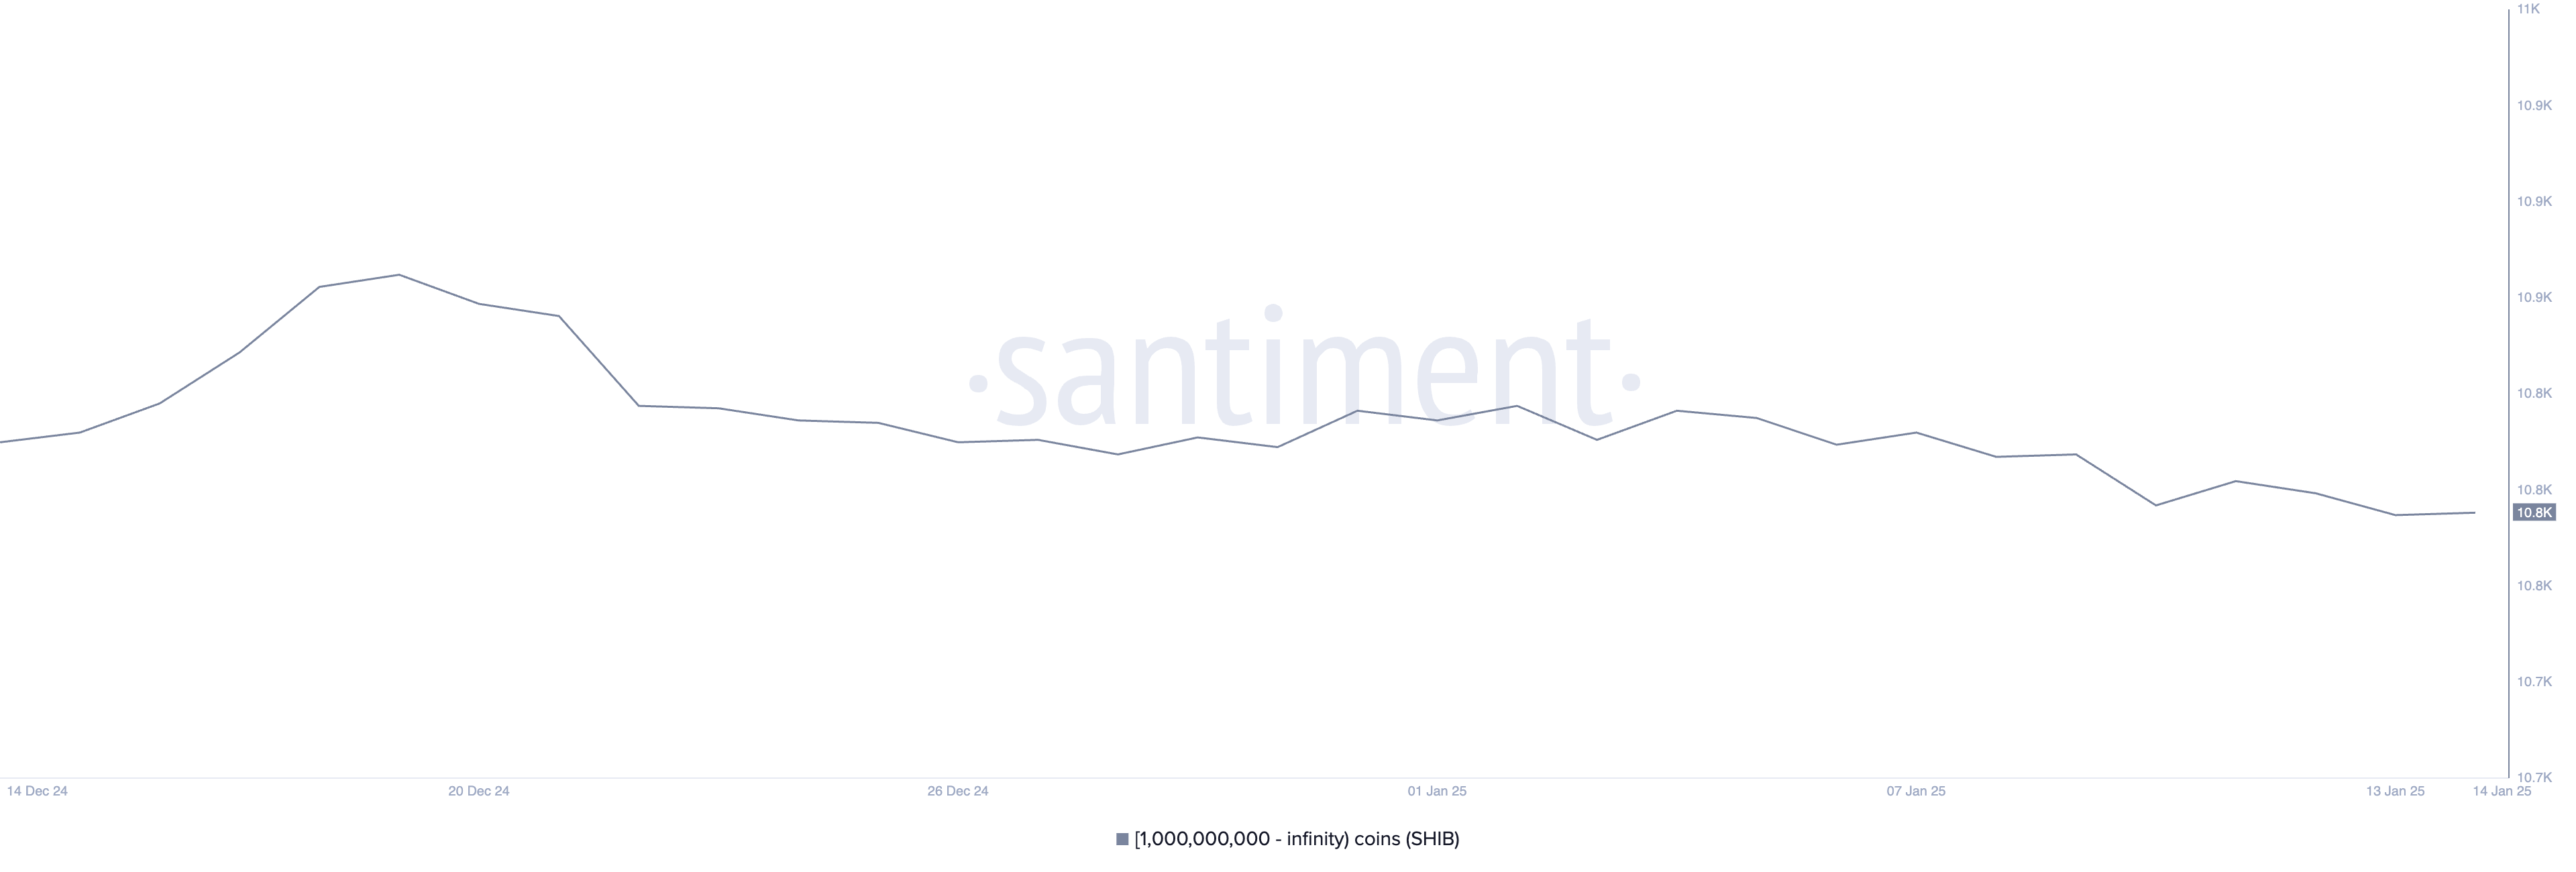 Holders with at least 1 billion SHIB. Source: Santiment
Tracking whale activity is crucial because these large holders can significantly impact price trends and liquidity. The current decline in whale numbers highlights potential distribution, which may create downward pressure on SHIB price unless new accumulation occurs to offset the trend.
However, the stabilization near recent lows may signal that selling has slowed, offering a potential foundation for recovery.
SHIB Price Prediction: A Further 11.9% Decline?
The price chart shows SHIB has close support at $0.0000205, which, if broken, could lead to a decline to $0.0000185, representing a potential 11.9% correction.
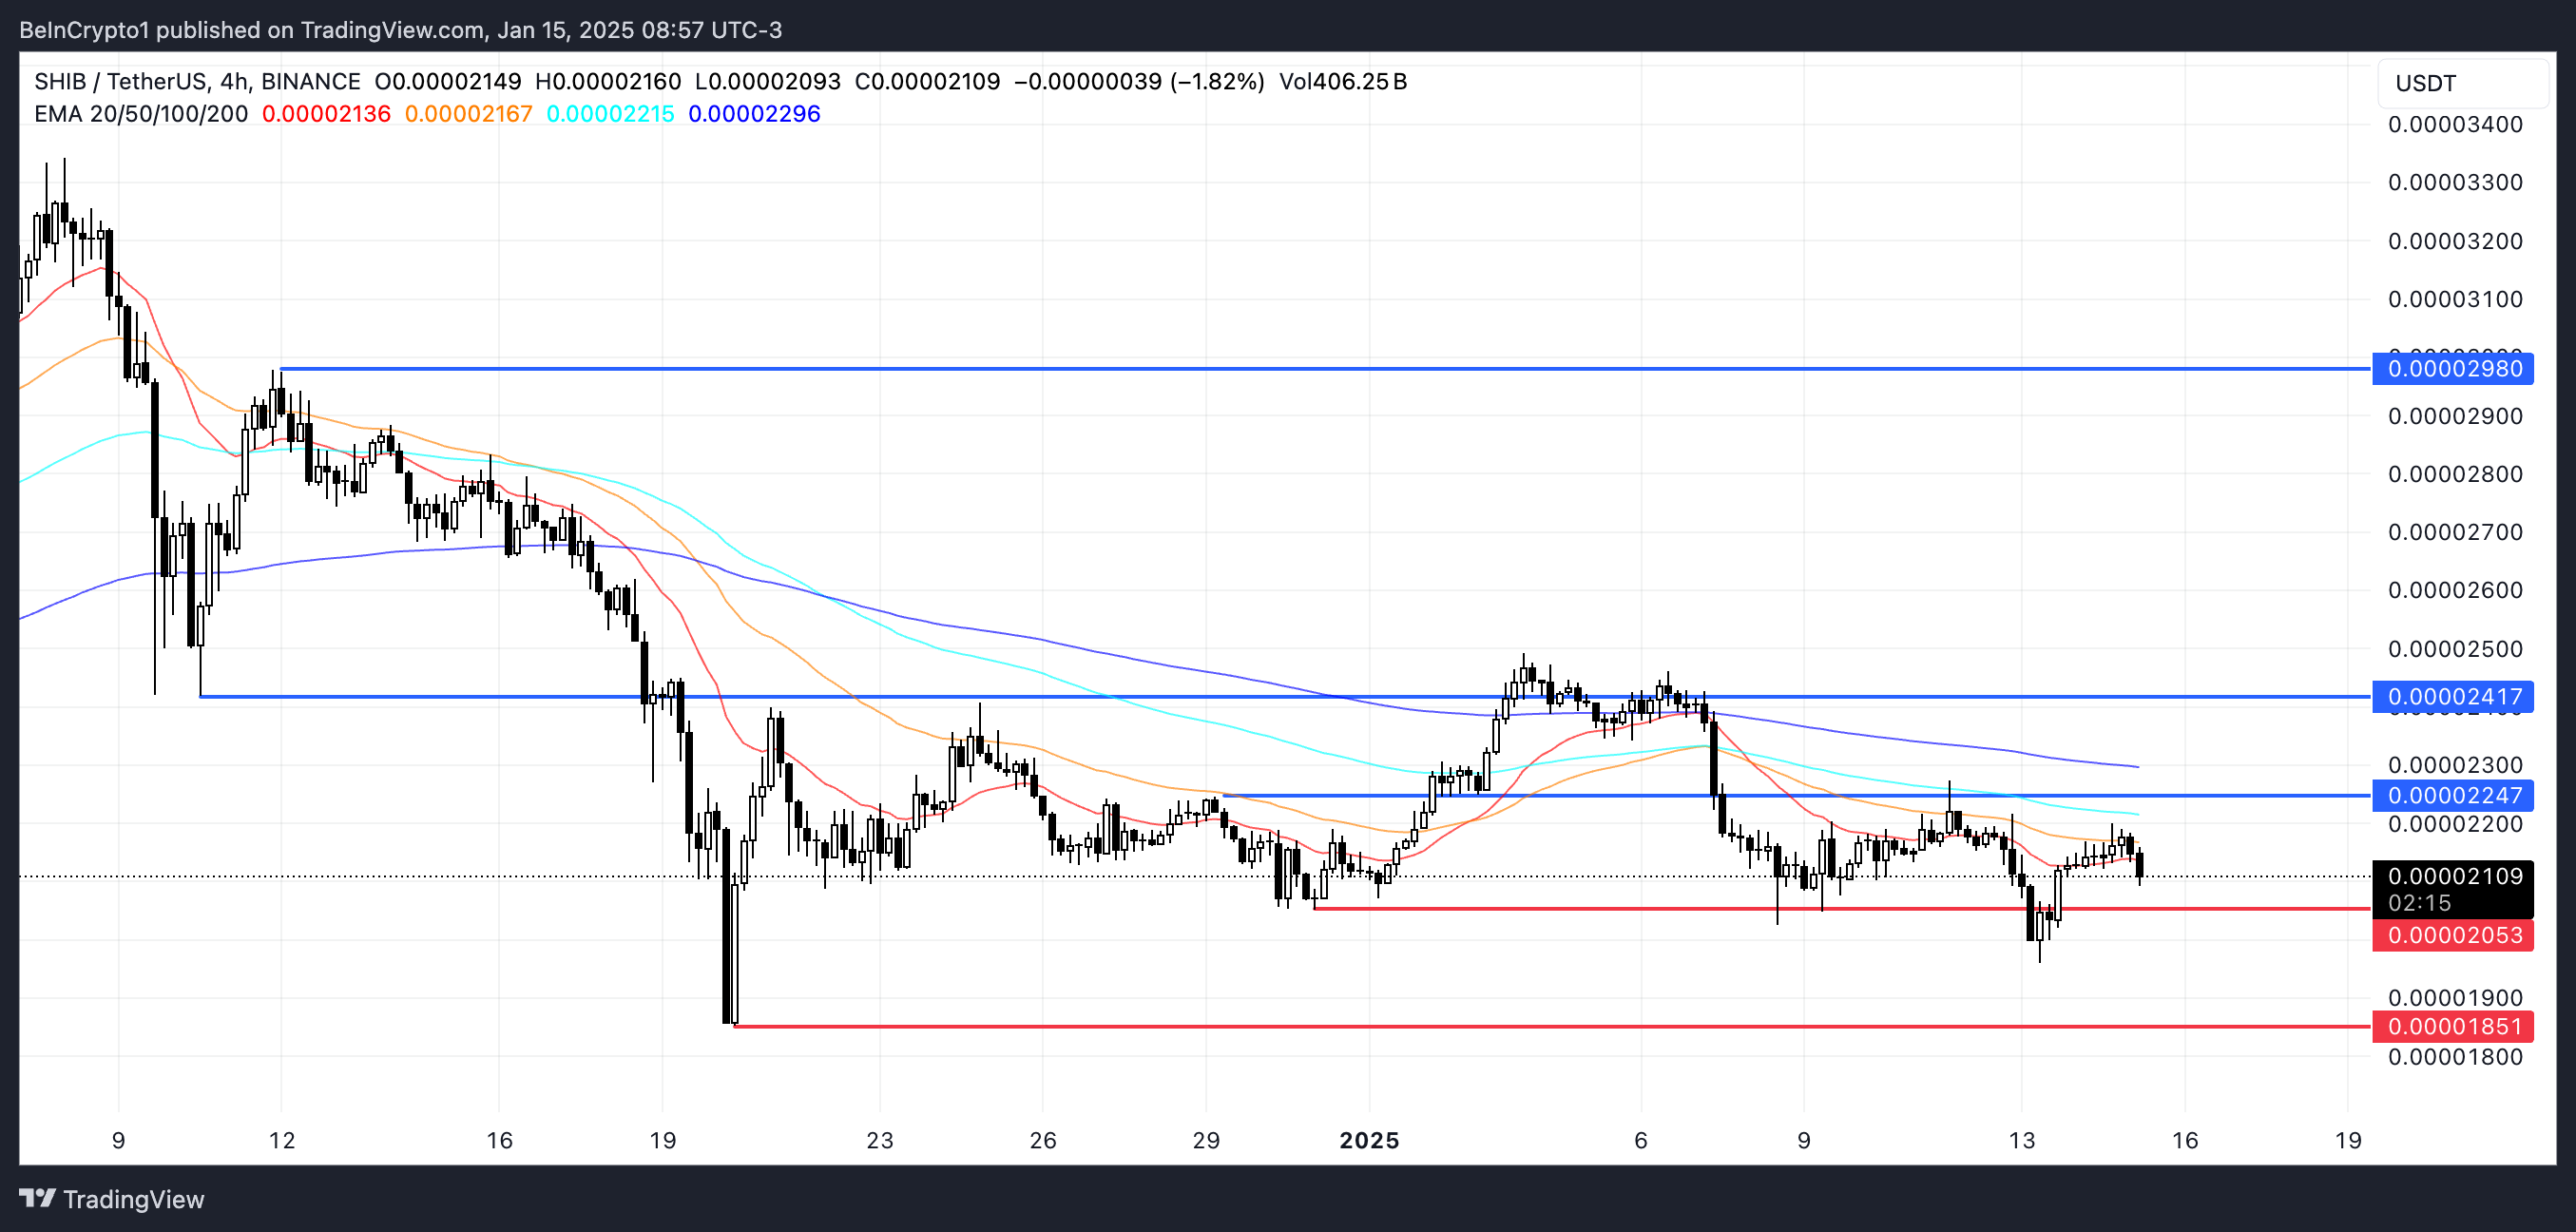 SHIB Price Analysis. Source: TradingView
Conversely, if an uptrend emerges, SHIB price could test the resistance at $0.000022 and, if surpassed, move toward $0.000024.
A strong uptrend could even push Shiba Inu price back to levels near $0.0000298, signaling a significant recovery and renewed bullish momentum.
Recommended Articles


