Memecoins to watch in January 2025: DOGE, Ai16Z, Fartcoin price forecast

Source Fxstreet
  • The global memecoin market shrank by 8.7% on Monday, with the total sector valuation plunging toward $100.6 billion.
  • Dogecoin’s subdued 5.1% loss outperformed the market average as traders anticipate a Trump-fueled D.O.G.E rally.
  • Ai16z remains the most-searched memecoin on Coingecko, attracting investors’ interest despite its 5% price reversal.

Fartcoin defied external bearish catalysts to enter an 11% rally within the daily timeframe.

Memecoins suffered intense downward volatility on Monday as the sector valuation plunged by 8.7% to hit $100.6 billion.

Key market indicators reflect that three prominent memecoins are flashing early rebound signals as traders position for upcoming events. 

Memecoin market cap shrinks 8.7% as bearish sentiment dominates. 

The memecoin sector was among the hardest-hit segments of the cryptocurrency market on Monday as global crypto valuations faced another significant downturn.

The sell-off was fueled by growing inflationary concerns after stronger than expected US jobs data was released last week.

Investors are bracing for a potential uptick in inflation, which could reduce the likelihood of further Federal Reserve (Fed) interest rate cuts in the first quarter of 2025.

With the Consumer Price Index (CPI) report scheduled for release on Wednesday, market volatility has surged as US traders recalibrate their positions ahead of this key economic data.

The heightened uncertainty was particularly evident in the memecoin market, where valuations dropped sharply amid fears of sustained macroeconomic headwinds.

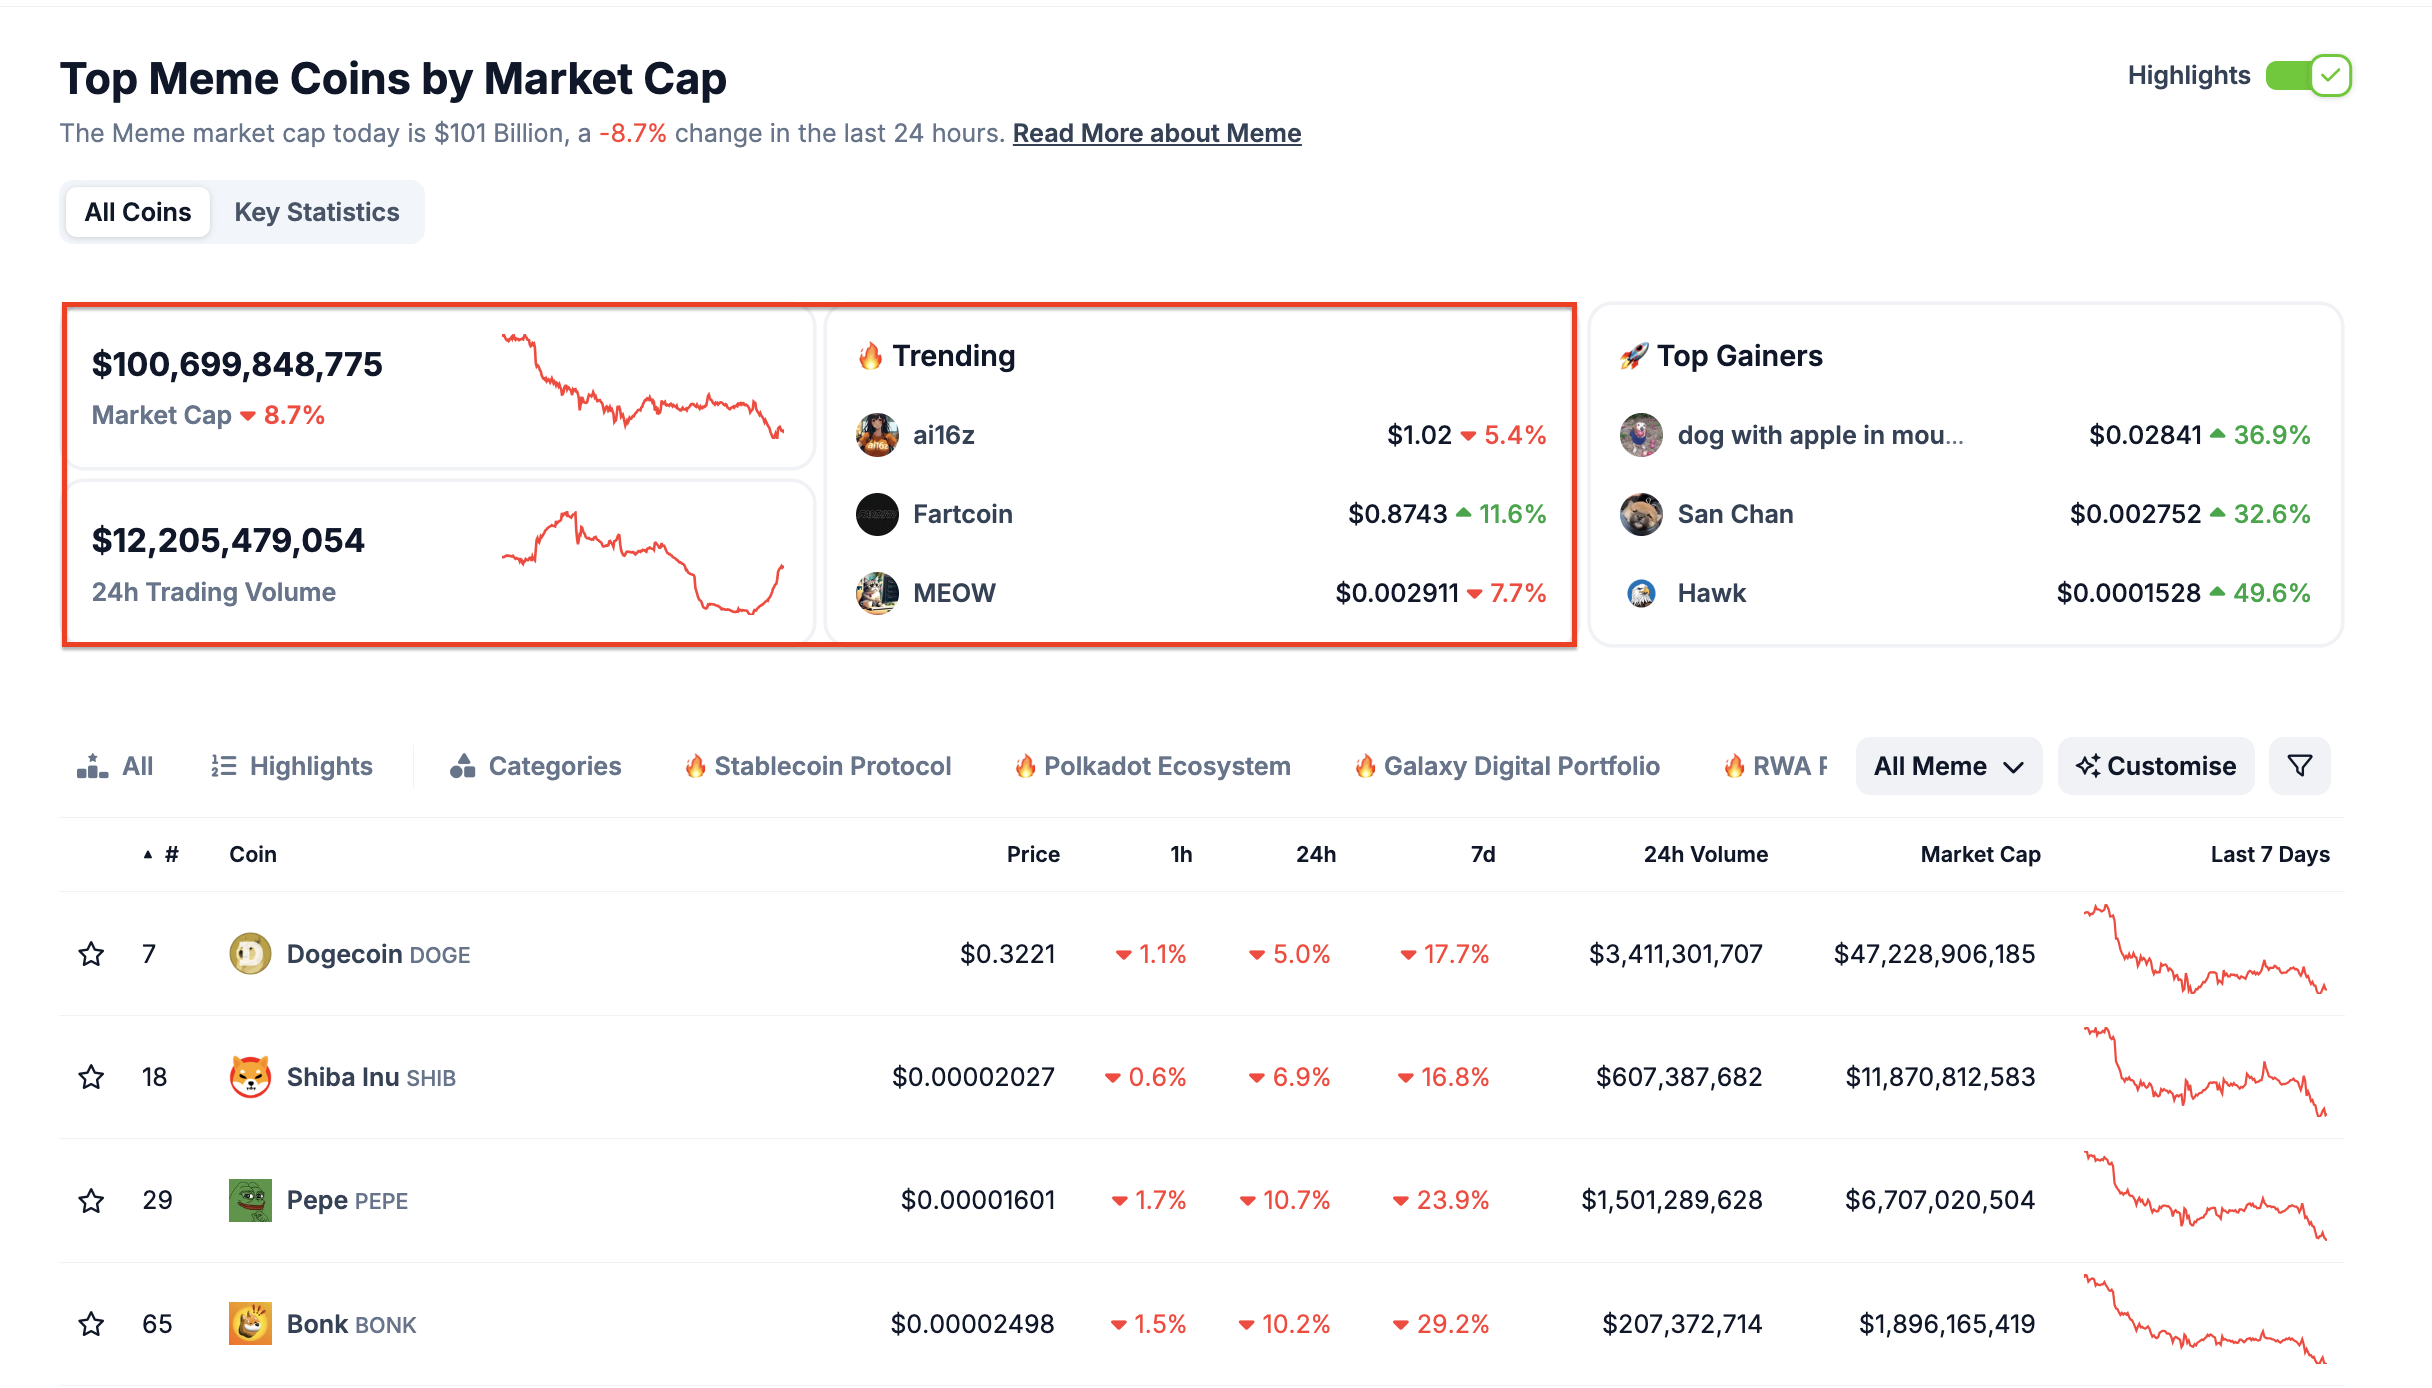
Memecoin Sector Performance, January 13, 2025 | Source: CoinGecko

The global memecoin market capitalization plunged 8.7% on Monday, settling at $100.6 billion. Dogecoin (DOGE), the sector's leader, fell 5% over the past 24 hours to $0.3221, marking a 17.7% decline over the last seven days.

Similarly, Shiba Inu (SHIB) tumbled 6.9% within the day to trade at $0.00002027, accumulating a 16.8% weekly drop.

Meanwhile, Pepe (PEPE) saw the steepest daily decline among the top memecoins, losing 10.7% to $0.00001601, extending its seven-day loss to 23.9%.

Despite the bearish momentum, some tokens within the memecoin sector are showing resilience and signaling potential recovery as traders shift focus to the latter half of January 2025. 

Dogecoin 

Dogecoin (DOGE) declined 5% on Monday, outperforming the memecoin sector's average 8.7% loss.

DOGE’s relative resilience signals potential bullish catalysts counteracting broader market weakness. 

Notably, former US President Donald Trump’s second inauguration, set for January 20, 2025, has sparked renewed interest in Dogecoin.

This follows the creation of the Department of Government Efficiency (D.O.G.E.), a federal body aimed at streamlining government functions, intriguingly named after the popular memecoin.

Adding fuel to the speculative fire, Tesla CEO Elon Musk, now serving in an advisory role within the administration, has a history of influencing DOGE’s price trajectory.

Despite macroeconomic headwinds, these developments have reignited optimism in DOGE markets.

Traders remain on edge as speculative narratives continue to evolve.

Musk’s involvement has historically coincided with significant DOGE price volatility, and market participants are keenly aware of his capability to sway sentiment with a single tweet.

Dogecoin price forecast: DOGE shows strength as traders eye Trump Inauguration

Dogecoin’s daily chart reflects indecision, with the price closing at $0.3334 near the lower Bollinger Band at $0.2883.

Bollinger Bands reveal contracting volatility, a precursor to potential breakout action.

Should DOGE break above the middle band at $0.3396, bullish momentum could extend toward $0.3908, the upper resistance band.

This bullish scenario aligns with potential investor optimism ahead of Trump’s inauguration.

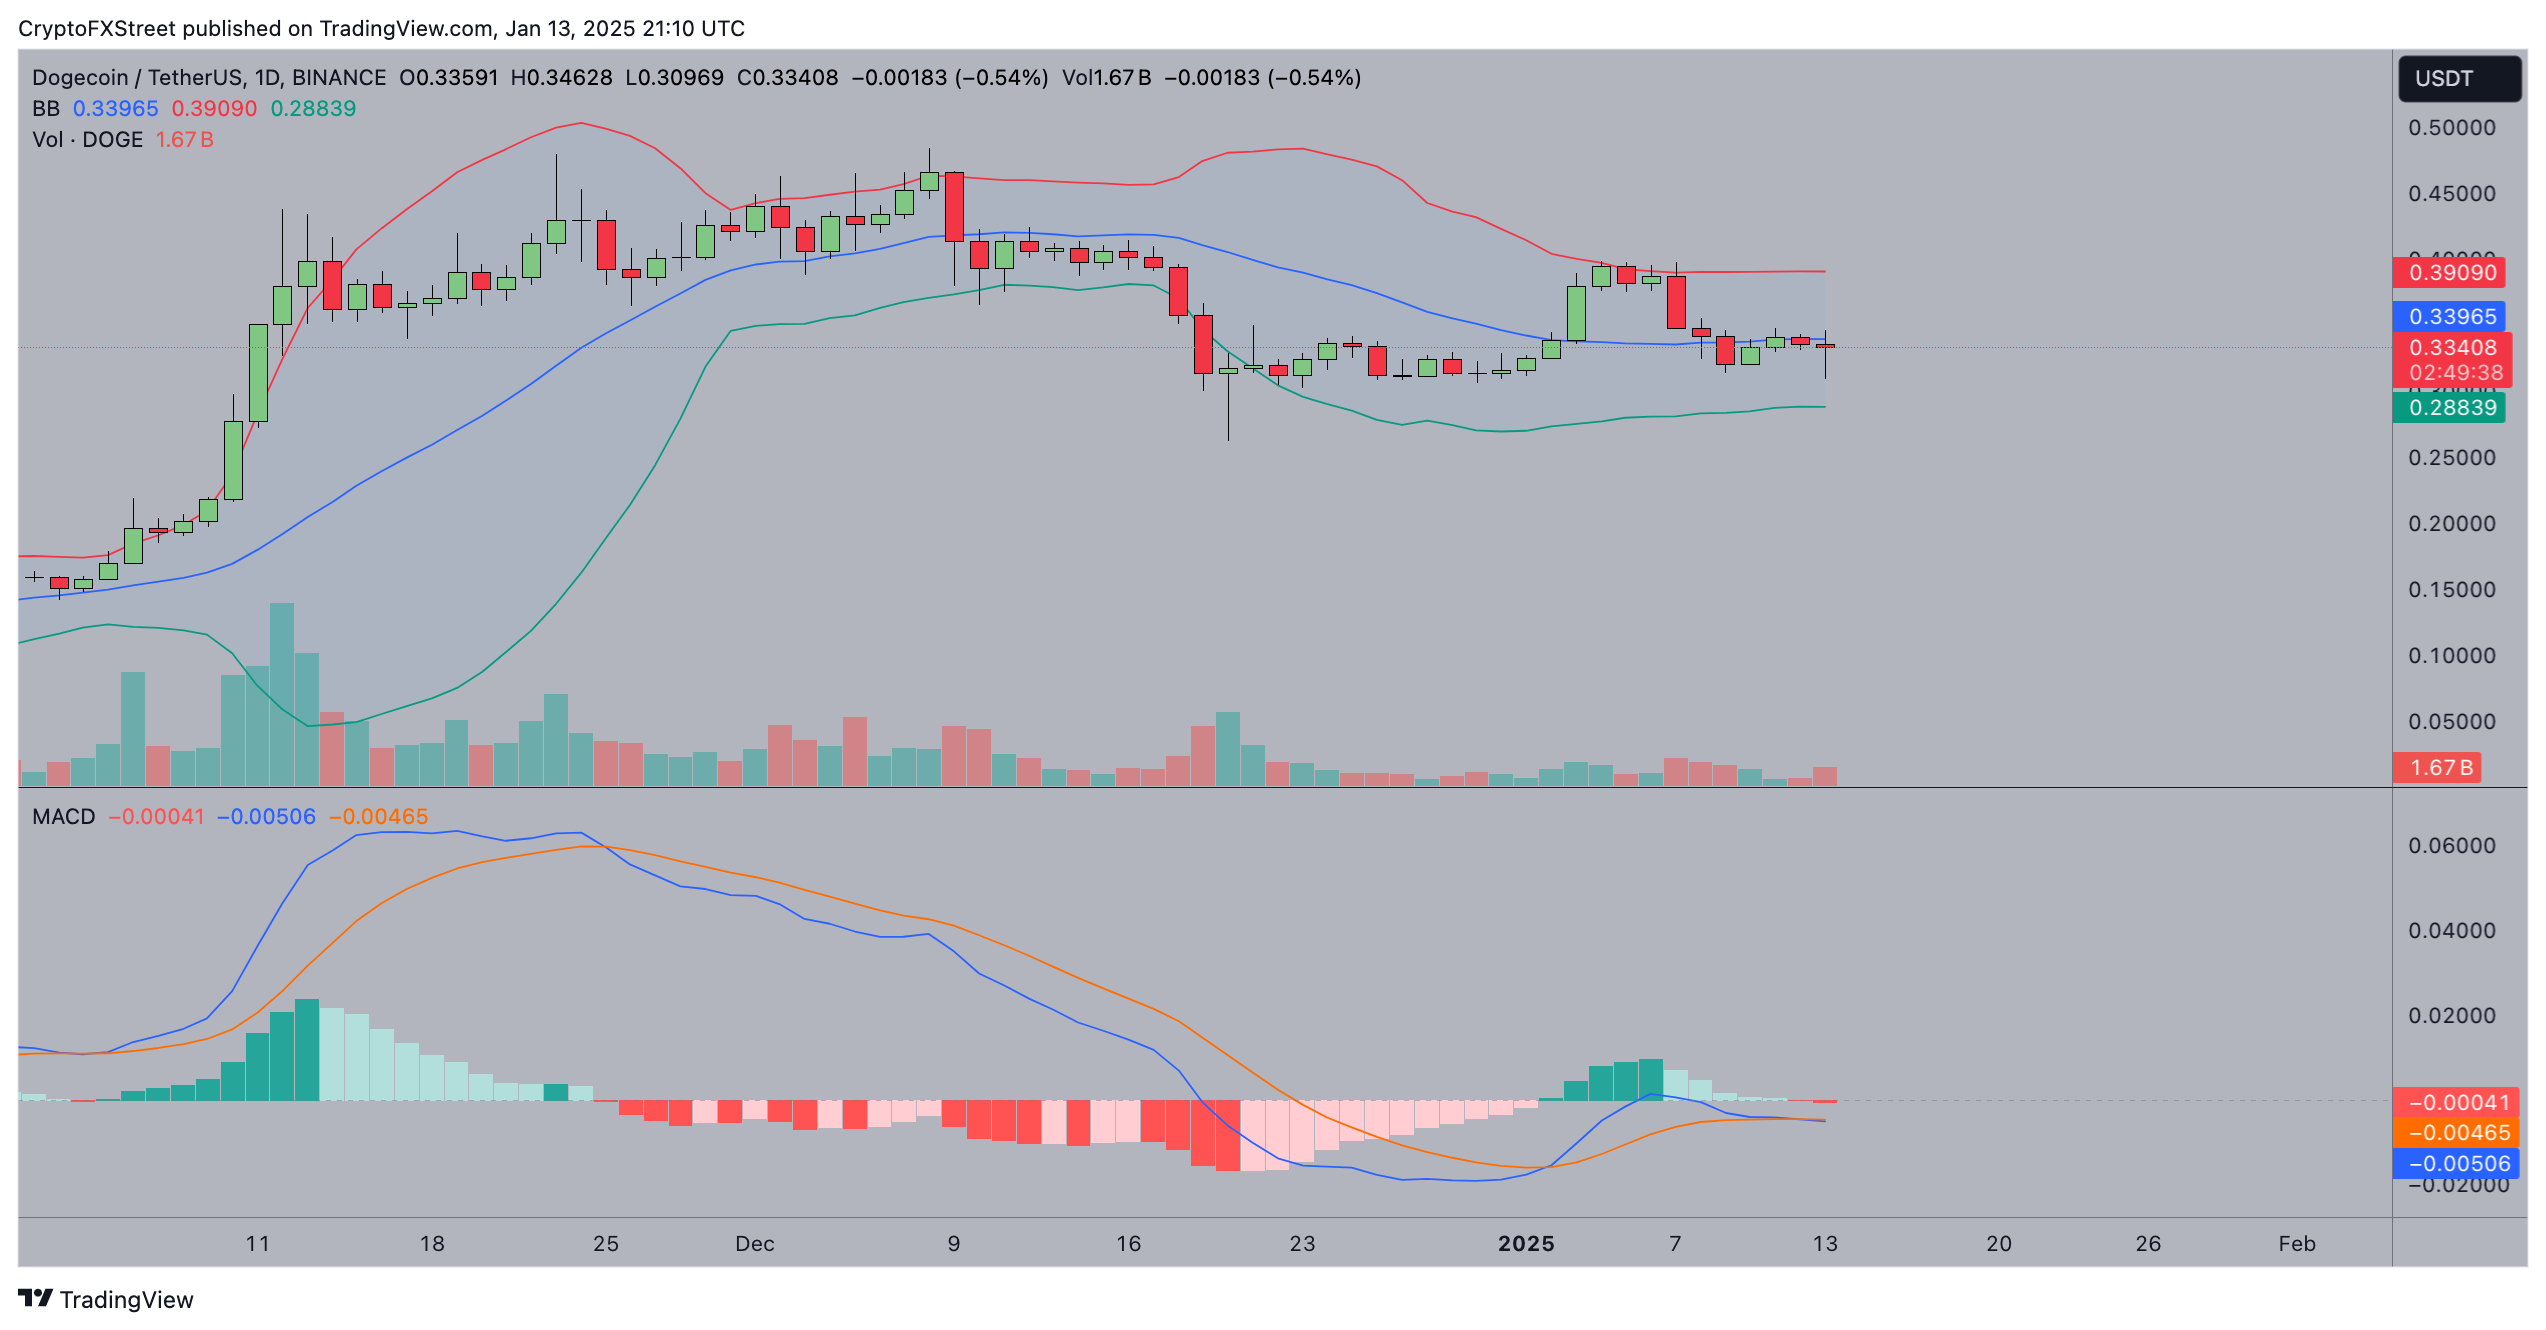
Dogecoin Price Forecast | DOGEUSD

However, downside risks remain. The MACD line (-0.00045) trending below the signal line (-0.00466) suggests lingering bearish momentum.

A breach below $0.2883, the lower Bollinger Band, may trigger cascading sell orders, targeting December’s low of $0.2500.

The near-term outlook remains balanced, with DOGE traders monitoring pivotal technical levels while speculating on broader macro and geopolitical catalysts. 

Ai16z

Ai6z token continues to attract attention after emerging as the most-searched memecoin on CoinGecko, reflecting heightened investor interest despite the broader market downtrend.

Trading at $1.0629 at press time, the Solana-hosted memecoin has maintained firm support above $1, showcasing resilience amid a 5% price reversal.

This rising social popularity, coupled with strong technical levels, positions Ai6z as a standout memecoin to watch in January 2025.

Ai6z price forecast: $1.5 breakout remains viable if $1 support holds

Ai6z price action shows early signs of consolidation after a recent pullback. Bollinger Bands suggest decreasing volatility, with the price stabilizing near the lower band at $0.5822. 
If bulls can reclaim the middle band at $1.5403, upward momentum could extend toward $2.4983, the upper resistance band.

This bullish scenario aligns with the surge in search interest, which could drive speculative buying.

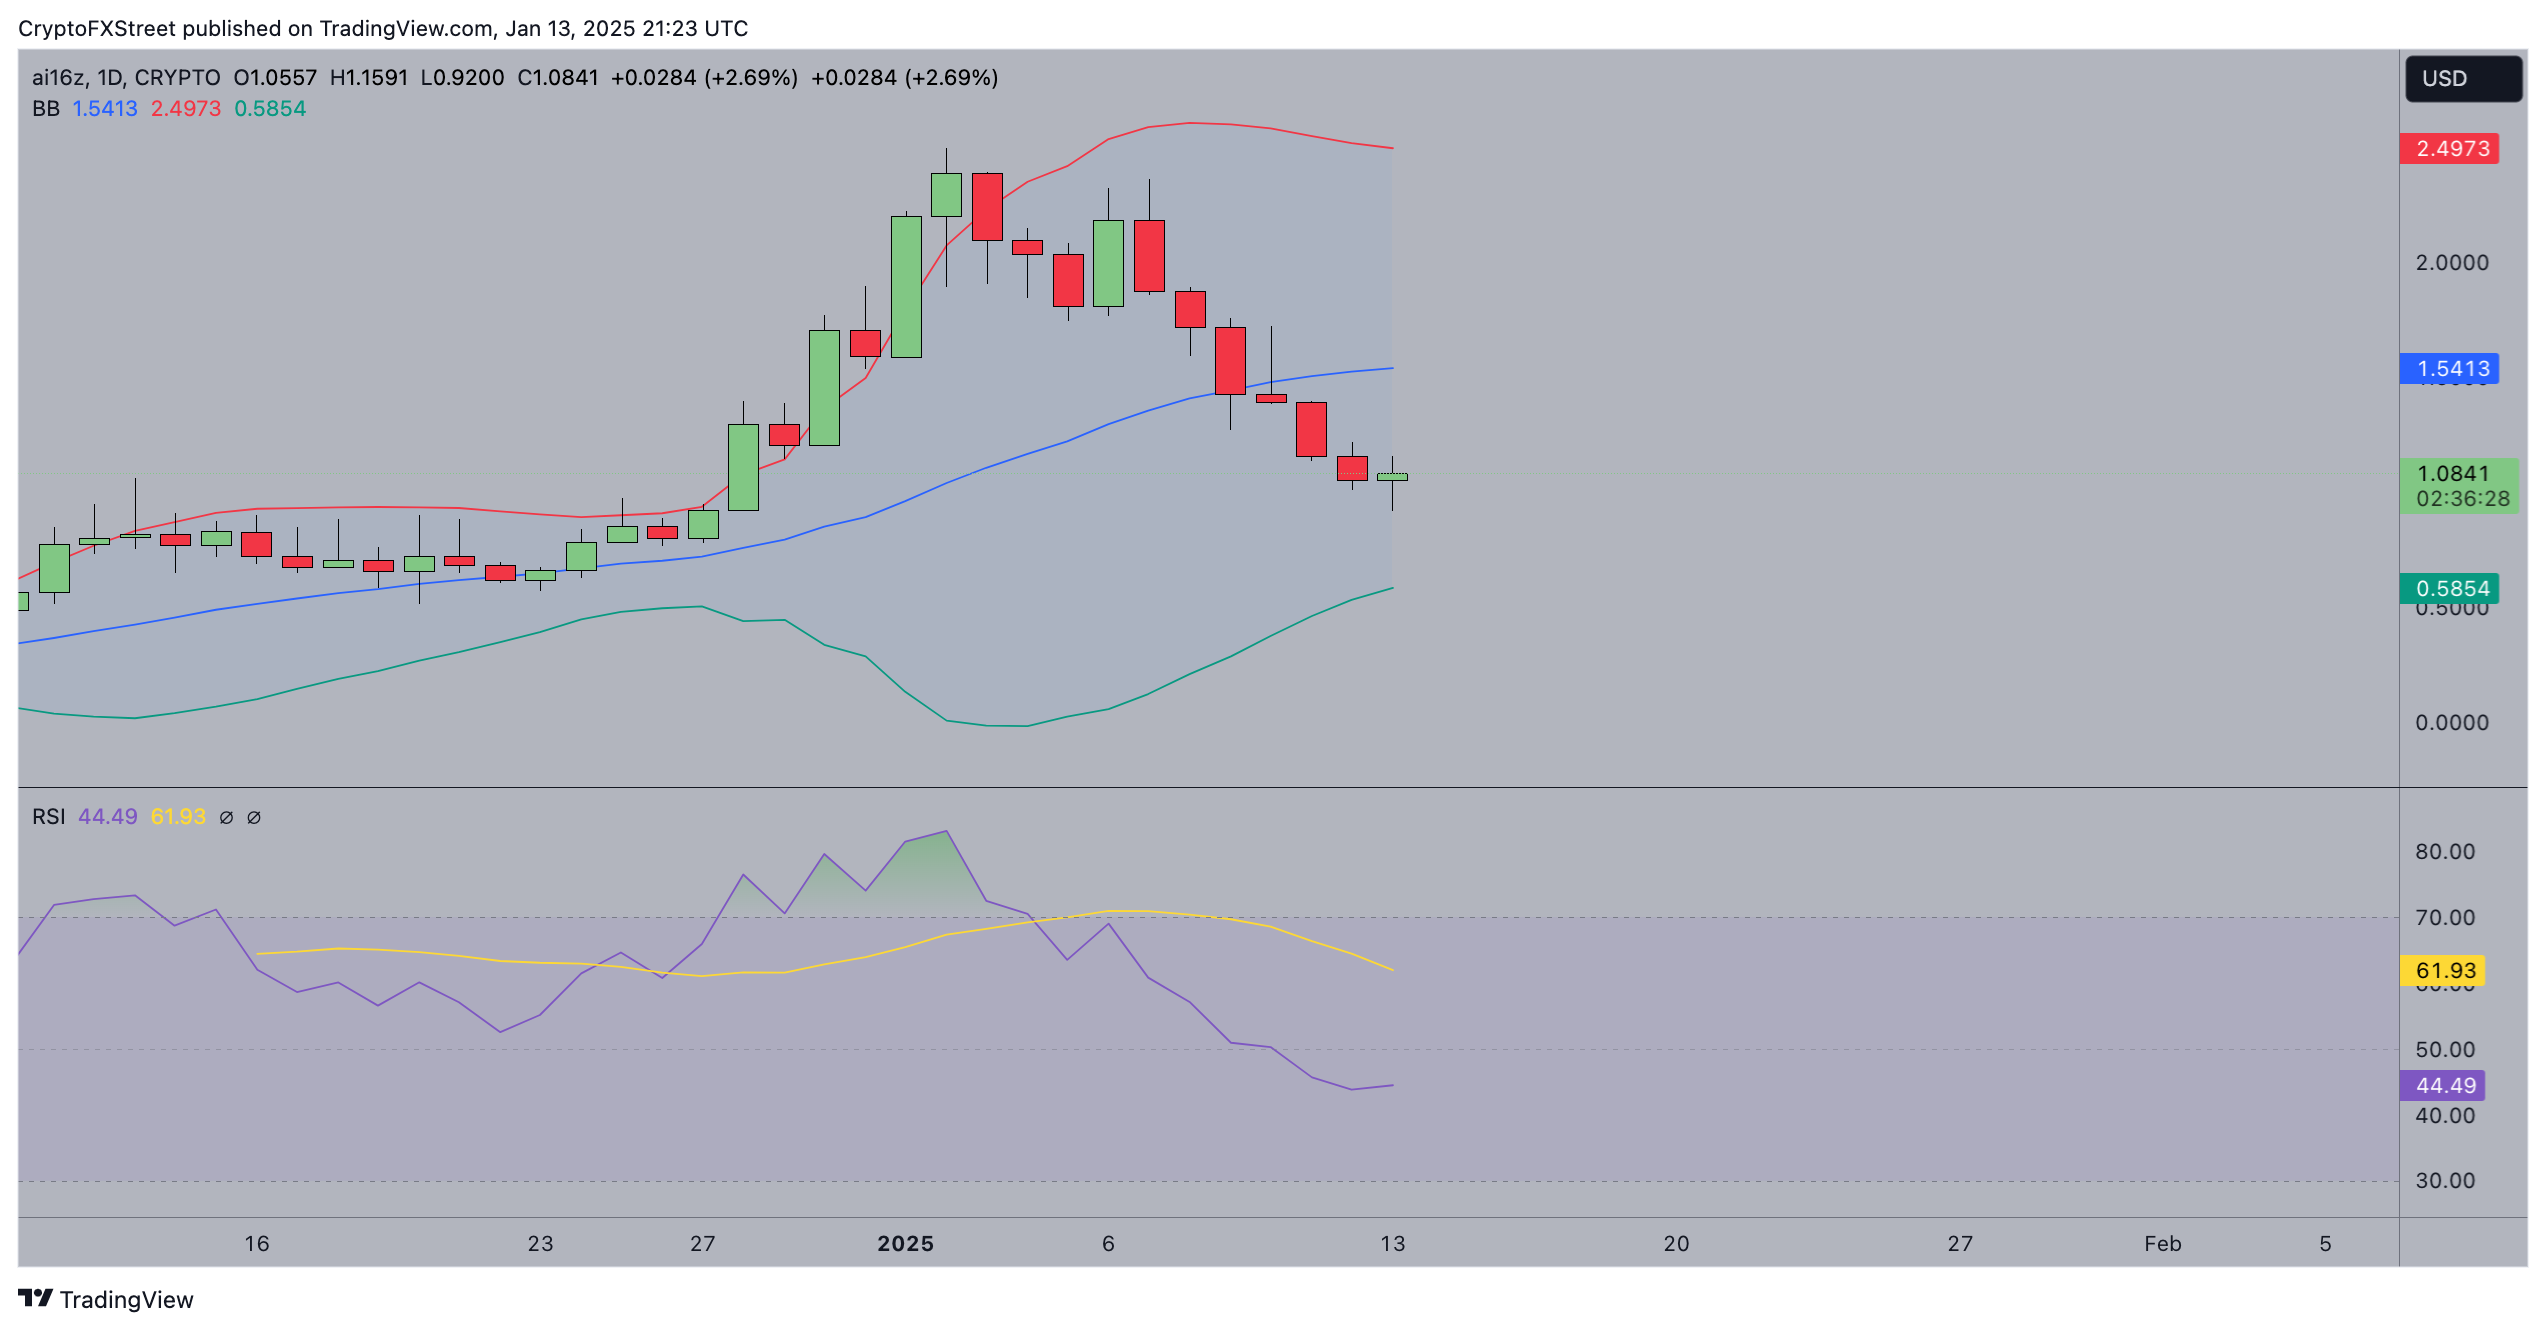
Ai16z Price Forecast 

Conversely, bearish risks emerge as the RSI hovers at 43.99, reflecting weakening momentum below the neutral 50 level.

A failure to hold the $1 support could trigger a cascade of sell-offs, targeting the lower Bollinger Band.

The next few trading sessions will likely determine whether Ai6z can capitalize on its rising popularity and social sentiment to overcome technical resistance.

Fartcoin

Fartcoin (FART) emerged as a standout performer in the memecoin sector on Monday, rallying 11.6% intraday to break above $0.80.

Trading above $0.80, the Solana-hosted AI-agent narrative token reached a market capitalization of $830 million as of January 13.

The memecoin sector recorded an aggregate 8.9% decline on the day, underscoring Fartcoin's resilience amid broader bearish sentiment.

The gains signal that the majority of current Fartcoin holders remain reluctant to sell, even as anticipated hawkish monetary policy from the Fed continues to apply bearish pressure across risk assets.

As the global crypto sector grapples with macroeconomic headwinds, Fartcoin’s ability to defy the trend positions it as one of the memecoins to watch for the remainder of January 2025. 

FART token performance also highlights growing interest in niche narratives within the cryptocurrency market, particularly those combining AI-driven innovation and meme culture

Farticoin Price Forecast: Fartcoin defies bears with 11.6% gains

Technical indicators on Fartcoin price prediction charts suggest a mixed but potentially bullish outlook.

The Bollinger Bands on the daily chart show a tightening range, indicating reduced volatility and setting the stage for further momentum. 

The upper band at $1.47 acts as immediate resistance, with support at $0.98. Meanwhile, the Moving Average Convergence Divergence (MACD) indicator presents a bearish alignment, with the MACD line (-0.054) below the signal line (0.098).

However, the histogram signals waning bearish momentum, hinting at a potential bullish crossover.

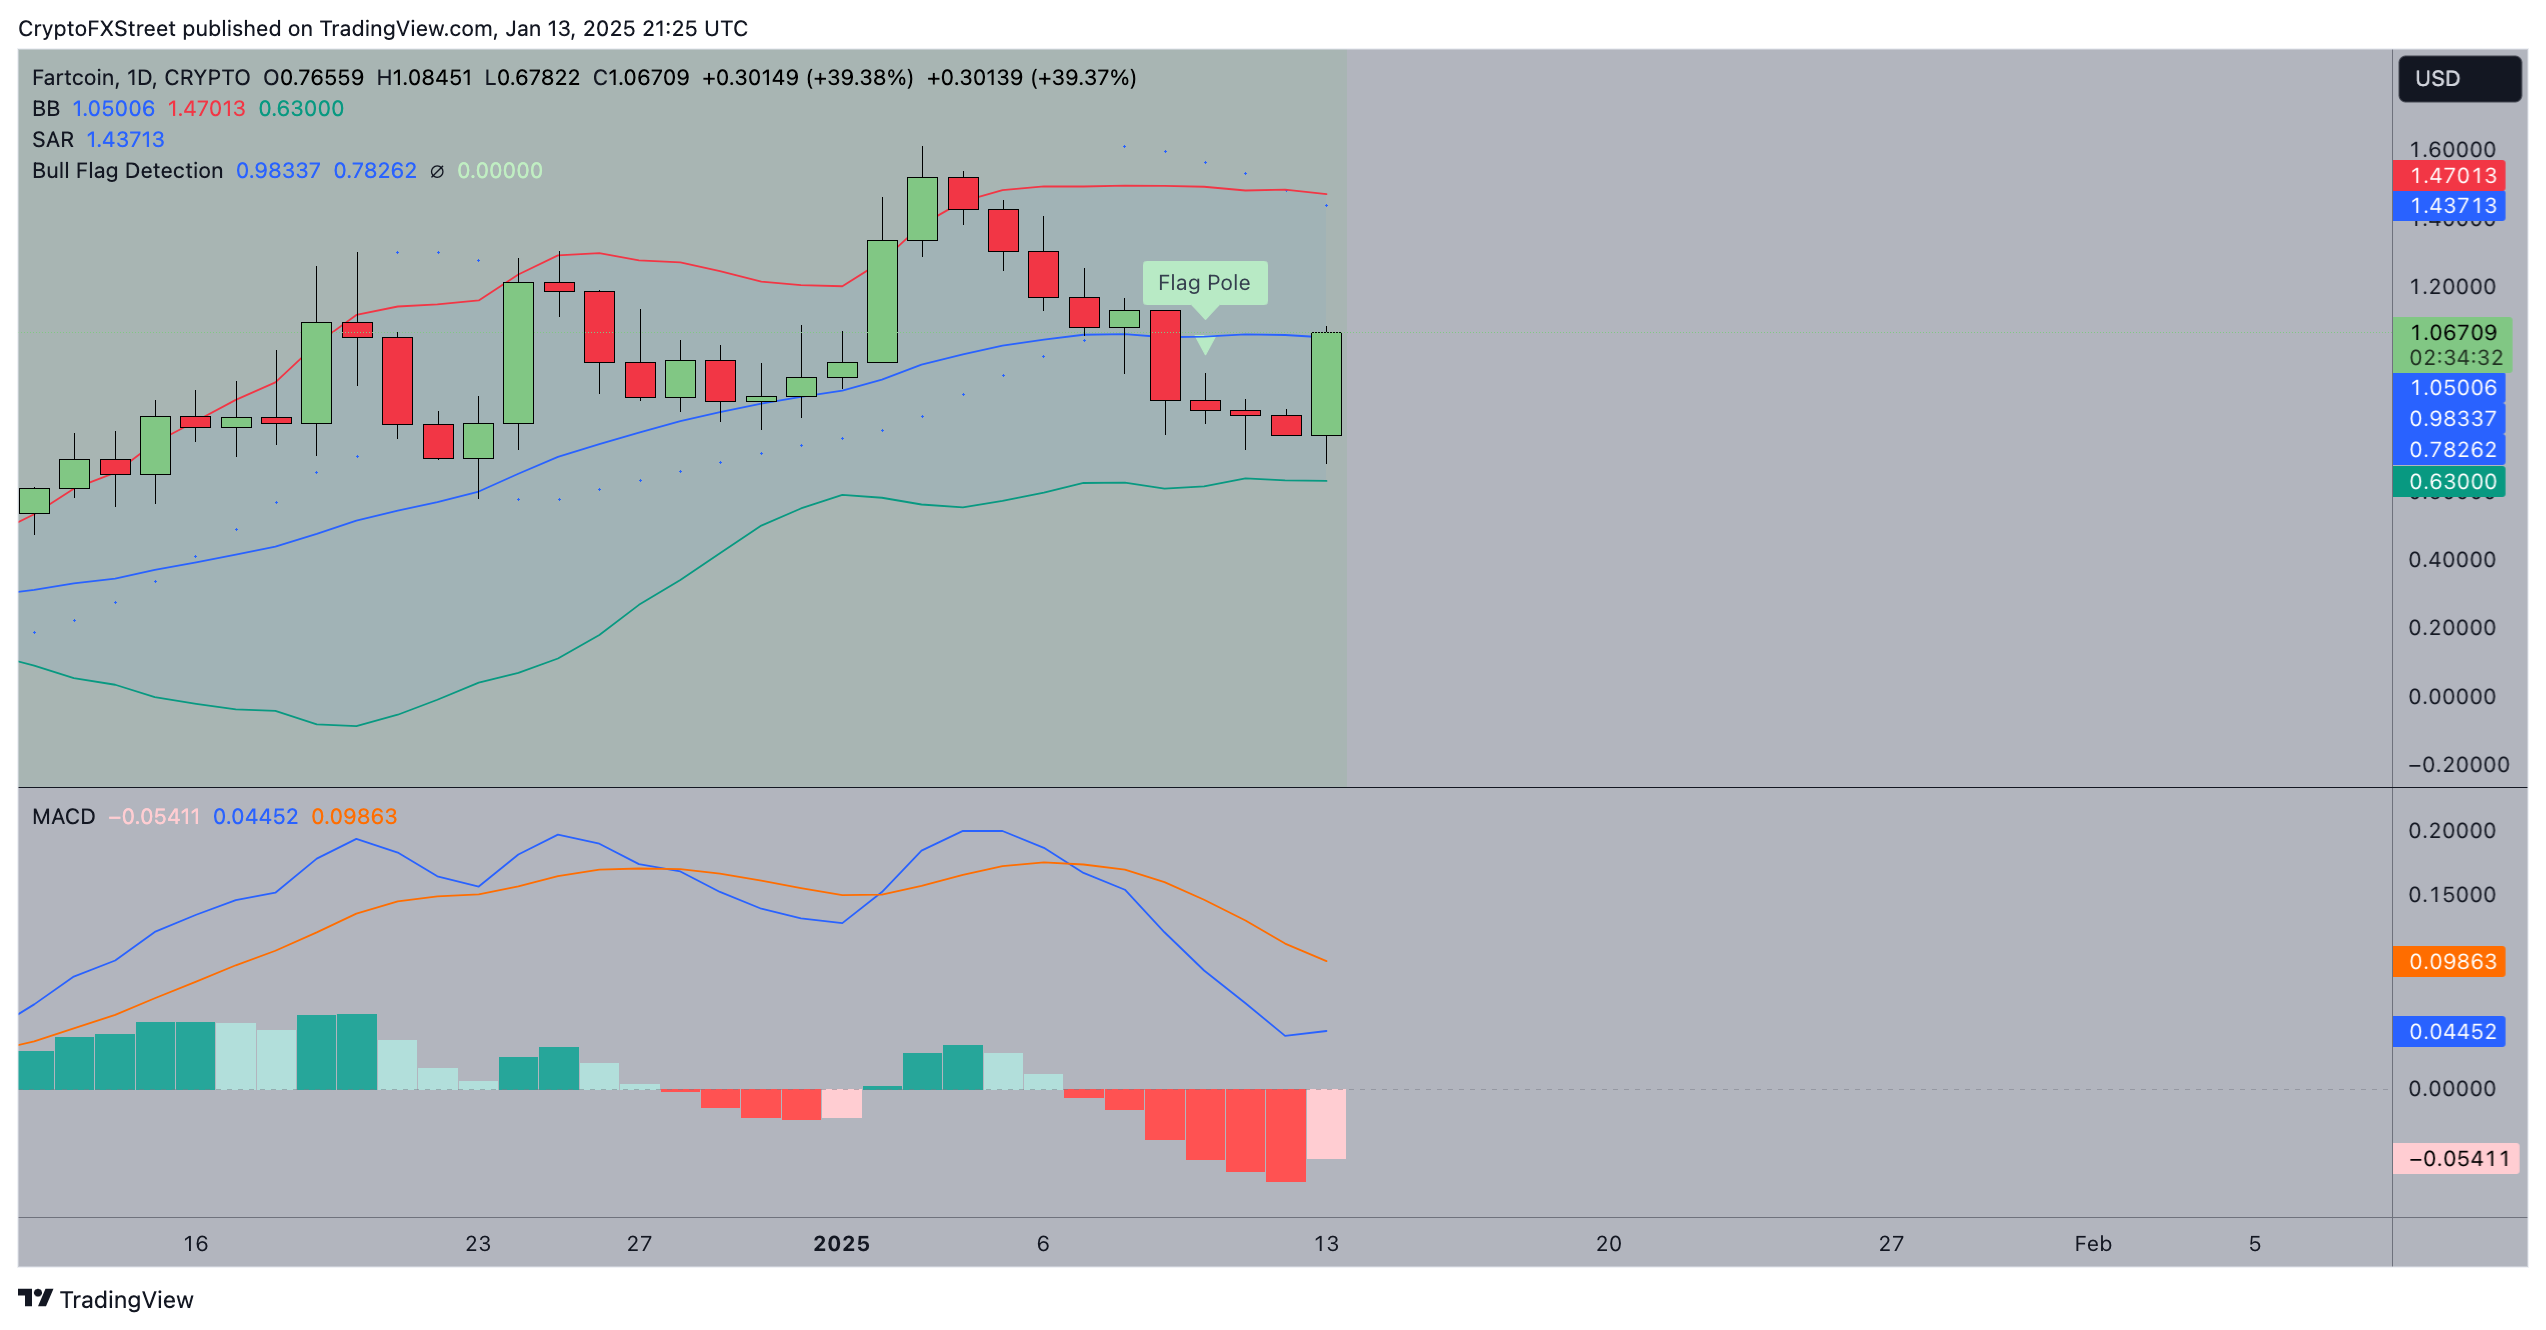
Fartcoin Price Forecast 

A breakout above $1.08 could pave the way for a rally toward $1.46, driven by expanding Bollinger Bands and renewed buying pressure.

The resilience of Fartcoin holders amid broader market weakness strengthens this case.

Conversely, failure to hold above $1.02 could trigger a correction toward $0.78, consistent with bearish signals from the Parabolic SAR.

A deepening MACD downtrend would amplify the likelihood of a retracement.
 

Disclaimer: For information purposes only. Past performance is not indicative of future results.
placeholder
Gold Price Forecast: XAU/USD drifts higher above $4,200 as Fed delivers expected cutGold price (XAU/USD) gains momentum to around $4,235 during the early Asian session on Thursday. The precious metal extends its upside after the US Federal Reserve (Fed) delivered an expected third consecutive interest rate cut and maintained its outlook for just one cut in 2026.
Author  FXStreet
Dec 11, Thu
Gold price (XAU/USD) gains momentum to around $4,235 during the early Asian session on Thursday. The precious metal extends its upside after the US Federal Reserve (Fed) delivered an expected third consecutive interest rate cut and maintained its outlook for just one cut in 2026.
placeholder
Gold remains bid as lack of Fed clarity and geopolitical frictions persistGold (XAU/USD) advances modestly on Friday as traders seem to book profits ahead of the weekend, yet clings to gains of over 0.51% after reaching a seven-week high of $4,353. At the time of writing, XAU/USD trades at $4,302 as traders digest comments from Federal Reserve (Fed) officials.
Author  FXStreet
Yesterday 01: 34
Gold (XAU/USD) advances modestly on Friday as traders seem to book profits ahead of the weekend, yet clings to gains of over 0.51% after reaching a seven-week high of $4,353. At the time of writing, XAU/USD trades at $4,302 as traders digest comments from Federal Reserve (Fed) officials.
placeholder
Ethereum Price Slips Lower — $3,000 Looms as the Key BattlegroundEthereum is attempting to recover from a $3,026 low but remains below $3,200 and the 100-hour SMA, with a bearish trend line near $3,175 capping rebounds as bulls need a clean break above $3,200 to target $3,250–$3,400, while a drop below $3,050 risks a retest of $3,000 and $2,940.
Author  Mitrade
Yesterday 03: 25
Ethereum is attempting to recover from a $3,026 low but remains below $3,200 and the 100-hour SMA, with a bearish trend line near $3,175 capping rebounds as bulls need a clean break above $3,200 to target $3,250–$3,400, while a drop below $3,050 risks a retest of $3,000 and $2,940.
placeholder
Macro Analysts: Hawkish Japan Could Push Bitcoin Below $70KAnalysts predict Bitcoin may face further declines towards the $70,000 mark if the Bank of Japan raises interest rates as expected.
Author  Mitrade
Yesterday 05: 48
Analysts predict Bitcoin may face further declines towards the $70,000 mark if the Bank of Japan raises interest rates as expected.
placeholder
Bitcoin Slides 5% as Sellers Lean In — Can BTC Reclaim $88,000?Bitcoin has dropped back below $88,000 after rolling over from $90,500, with price still trading under the 100-hour Simple Moving Average. The sell-off found a floor at $85,151, and BTC is now consolidating near that base, but rebounds are facing pressure from a bearish trend line around $89,000. Bulls need to retake $88,000–$89,000 to ease downside risk; failure to do so keeps $85,500–$85,000 and then $83,500 in play, with $80,000 as the deeper “line in the sand.” Bitcoin (BTC) is back in damage-control mode after a sharp pullback wiped out recent gains. The price failed to reclaim the $90,000–$90,500 band, rolled over, and slid through $88,500 before briefly dipping under $87,000. Buyers did show up around $85,000, but the rebound so far looks more like stabilization than a clear trend reversal. Bitcoin dips hard, finds a bid near $85,000(h3) BTC’s latest move lower began when it couldn’t build follow-through above $90,000 and $90,500. Once that upside stalled, sellers took control and pushed price down through $88,500. The slide accelerated enough to spike below $87,000, but the market didn’t free-fall. Bulls defended the $85,000 zone, printing a low at $85,151. Since then, Bitcoin has been consolidating below the 23.6% Fibonacci retracement of the drop from the $93,560 swing high to the $85,151 low — a clue that the bounce is still shallow and that sellers haven’t fully backed off yet. Structurally, BTC is still on the back foot: It’s trading below $88,000, and It remains below the 100-hour Simple Moving Average, keeping short-term trend pressure pointed downward. Resistance is layered, and $89,000 is the problem area(h3) If bulls try to turn this into a recovery, they’ll have to climb through multiple ceilings in quick succession. First, BTC faces resistance around $87,150, followed by a more meaningful barrier near $87,500. From there, the market’s attention snaps back to $88,000 — the level BTC just lost and now needs to reclaim. A close back above $88,000 would improve the tone, but it doesn’t solve the bigger issue: there’s a bearish trend line on the hourly BTC/USD chart (Kraken feed) with resistance near $89,000, which also lines up with the next technical hurdle. If BTC can push through $89,000 and hold, the rebound could extend toward $90,000, with follow-through targets at $91,000 and $91,500. But until price clears that $88,000–$89,000 zone, rallies are at risk of being sold rather than chased. If BTC fails to reclaim resistance, the downside path is clear(h3) The near-term bear case is simple: if Bitcoin can’t climb back above the $87,000 area and keep traction, sellers may attempt another leg lower. Support levels line up like this: Immediate support: $85,500 First major support: $85,000 Next support: $83,500 Then $82,500 in the near term Below that, the major “don’t break this” level is still $80,000. If BTC slips under $80,000, the risk of acceleration to the downside increases significantly — not because it’s magic, but because it’s the kind of psychological and structural level that tends to trigger forced de-risking. Indicators: momentum still leans bearish(h3) The intraday indicators aren’t offering much comfort yet: Hourly MACD is losing pace in the bearish zone. Hourly RSI remains below 50, suggesting sellers still have the upper hand on short timeframes. So while the $85,000 defense held for now, the market hasn’t flipped bullish — it’s just stopped bleeding.
Author  Mitrade
7 hours ago
Bitcoin has dropped back below $88,000 after rolling over from $90,500, with price still trading under the 100-hour Simple Moving Average. The sell-off found a floor at $85,151, and BTC is now consolidating near that base, but rebounds are facing pressure from a bearish trend line around $89,000. Bulls need to retake $88,000–$89,000 to ease downside risk; failure to do so keeps $85,500–$85,000 and then $83,500 in play, with $80,000 as the deeper “line in the sand.” Bitcoin (BTC) is back in damage-control mode after a sharp pullback wiped out recent gains. The price failed to reclaim the $90,000–$90,500 band, rolled over, and slid through $88,500 before briefly dipping under $87,000. Buyers did show up around $85,000, but the rebound so far looks more like stabilization than a clear trend reversal. Bitcoin dips hard, finds a bid near $85,000(h3) BTC’s latest move lower began when it couldn’t build follow-through above $90,000 and $90,500. Once that upside stalled, sellers took control and pushed price down through $88,500. The slide accelerated enough to spike below $87,000, but the market didn’t free-fall. Bulls defended the $85,000 zone, printing a low at $85,151. Since then, Bitcoin has been consolidating below the 23.6% Fibonacci retracement of the drop from the $93,560 swing high to the $85,151 low — a clue that the bounce is still shallow and that sellers haven’t fully backed off yet. Structurally, BTC is still on the back foot: It’s trading below $88,000, and It remains below the 100-hour Simple Moving Average, keeping short-term trend pressure pointed downward. Resistance is layered, and $89,000 is the problem area(h3) If bulls try to turn this into a recovery, they’ll have to climb through multiple ceilings in quick succession. First, BTC faces resistance around $87,150, followed by a more meaningful barrier near $87,500. From there, the market’s attention snaps back to $88,000 — the level BTC just lost and now needs to reclaim. A close back above $88,000 would improve the tone, but it doesn’t solve the bigger issue: there’s a bearish trend line on the hourly BTC/USD chart (Kraken feed) with resistance near $89,000, which also lines up with the next technical hurdle. If BTC can push through $89,000 and hold, the rebound could extend toward $90,000, with follow-through targets at $91,000 and $91,500. But until price clears that $88,000–$89,000 zone, rallies are at risk of being sold rather than chased. If BTC fails to reclaim resistance, the downside path is clear(h3) The near-term bear case is simple: if Bitcoin can’t climb back above the $87,000 area and keep traction, sellers may attempt another leg lower. Support levels line up like this: Immediate support: $85,500 First major support: $85,000 Next support: $83,500 Then $82,500 in the near term Below that, the major “don’t break this” level is still $80,000. If BTC slips under $80,000, the risk of acceleration to the downside increases significantly — not because it’s magic, but because it’s the kind of psychological and structural level that tends to trigger forced de-risking. Indicators: momentum still leans bearish(h3) The intraday indicators aren’t offering much comfort yet: Hourly MACD is losing pace in the bearish zone. Hourly RSI remains below 50, suggesting sellers still have the upper hand on short timeframes. So while the $85,000 defense held for now, the market hasn’t flipped bullish — it’s just stopped bleeding.
goTop
quote