


Cardano Price Forecast: ADA to hold $0.90 support as traders bet $1.2B on Trump policies
- Cardano price declined by 8% in 24 hours to hit $0.91 on Monday, after emerging as the best performer last week.
- ADA open interest held steady at $1.2 billion despite the market dip, signaling traders’ reluctance to exit.
- Historical indicators reflect frequent high-volume accumulation around the $0.90 support level.
Cardano’s price fell as low as $0.91 on Monday, entering an 8% correction after emerging as the best performer last week. Market data shows that ADA bull traders remain reluctant to exit despite volatile price movements. Will ADA stage a rapid rebound from $0.90?
Cardano downtrend halts at $0.90 as traders book profits
Cardano (ADA) was among the hardest-hit cryptocurrencies on Monday as the global crypto market faced another downturn.
The sell-off was largely driven by mounting concerns over inflation after stronger-than-expected United States (US) jobs data was released last week.
Investors are now bracing for an uptick in inflation, which could reduce the likelihood of further Federal Reserve (Fed) rate cuts in Q1 2025.
With the Consumer Price Index (CPI) report due on Wednesday, cryptocurrencies experienced heightened volatility as US markets reopened, prompting traders to recalibrate their positions ahead of the key data.
Notably, Cardano, which ranked as one of the best-performing assets last week, saw its bullish momentum reverse sharply on Monday.
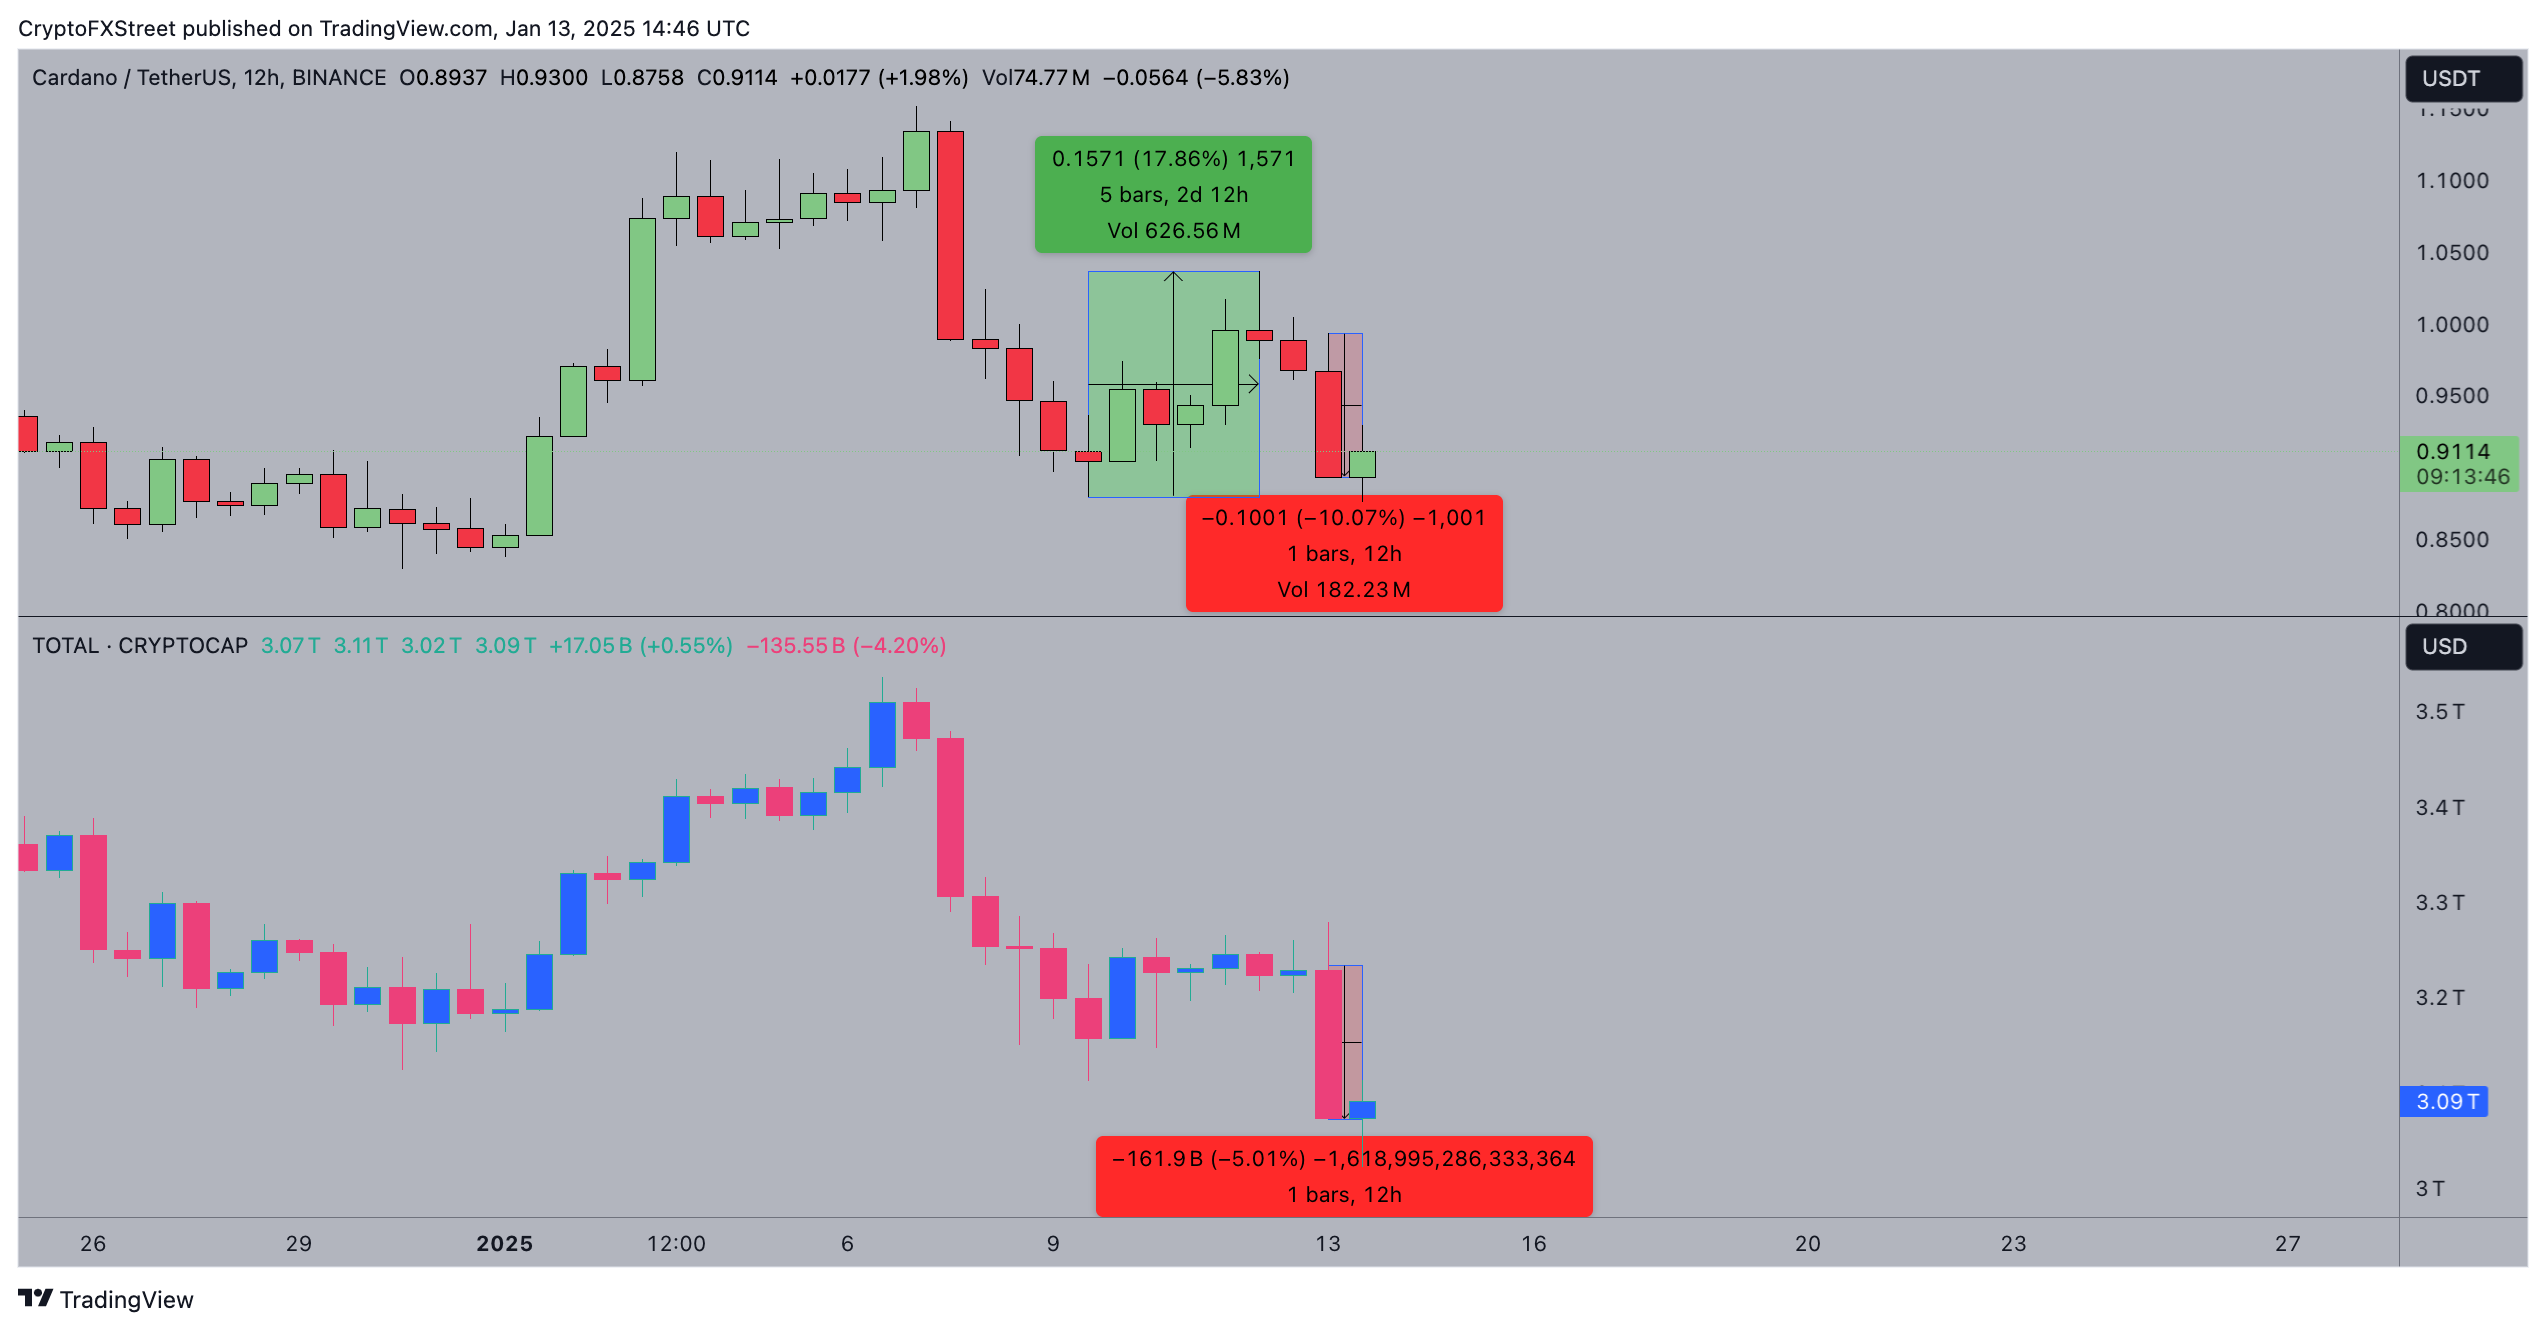 Cardano (ADA) Price vs. TOTAL Crypto Market Capitalization
Cardano's price plunged 10% on Monday, declining from its $0.99 opening price to $0.91 at press time.
By contrast, the TOTALCap chart indicates that the overall crypto market fell by just 5% during the same period.
This highlights that ADA is declining nearly twice as fast as the broader market average.
This suggests that traders who benefited from ADA’s chart-topping 17.8% gains last week are now locking in profits, driving the intensified sell pressure.
Speculative traders maintain $1.2B Open Interest on ADA ahead of Trump inauguration
The broader macroeconomic uncertainty, coupled with expectations of a rate pause and geopolitical developments like new US tariffs, have placed downward pressure on Cardano price and the wider crypto market on Monday.
However, derivatives market trends indicate that many investors remain focused on potential upside scenarios tied to upcoming events, particularly Donald Trump’s January 20 inauguration.
The Trump administration’s transition committee has proposed a crypto tax reform that could eliminate capital gains taxes for US-based cryptocurrency projects, including Cardano.
According to trends observed on Coinglass’ ADA Open Interest chart, Trump’s policy speculation currently appears to be influencing traders’ positions.
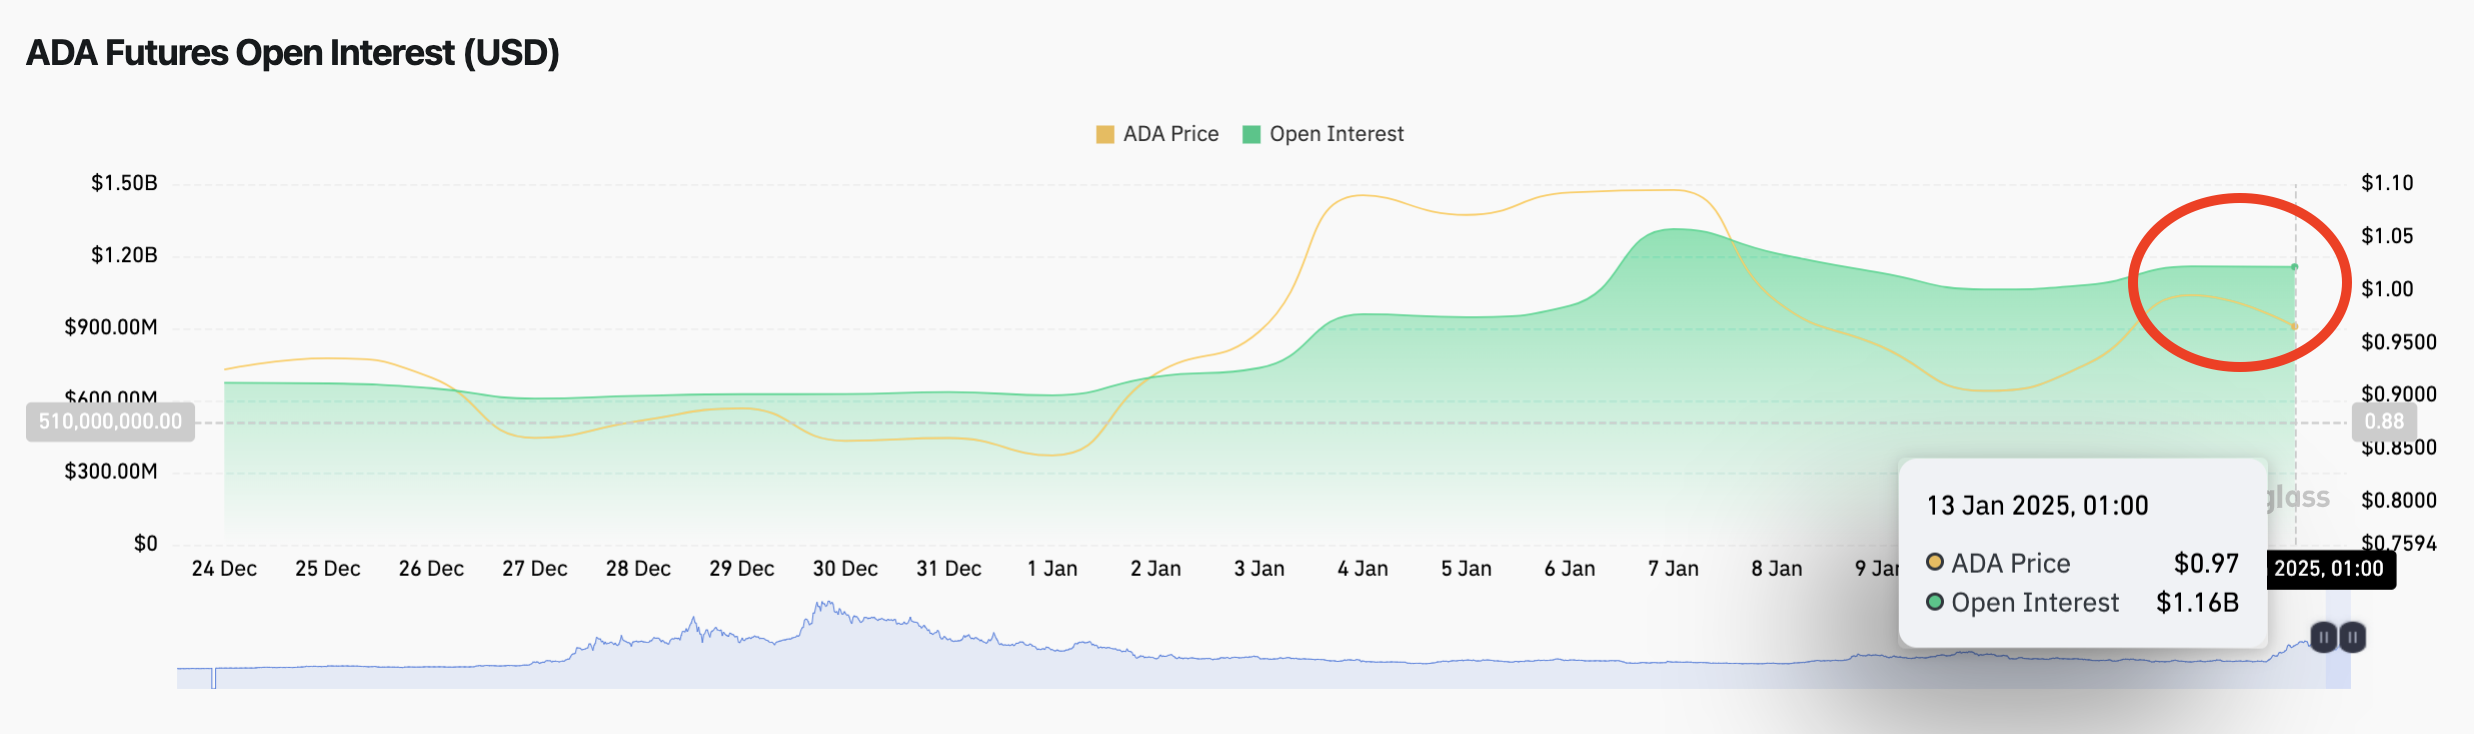 Cardano Open Interest vs. ADA Price | Source: Coinglass
Despite ADA’s 10% price decline over the past two days, the asset’s open interest remains steady at $1.16 billion. This signals that the ADA market continues to attract new speculative positions even as some traders exit amid the recent dip.
The steady $1.16 billion open interest in ADA derivatives illustrates that traders are adopting a defensive yet optimistic approach. With Trump’s inauguration now just days away, many appear to be anticipating a potential market rebound, particularly if the proposed crypto-friendly policy amendments materialize.
ADA Price Forecast: Bulls set to mount buy wall $0.90
Cardano (ADA) shows signs of recovery, with its price rebounding from the critical $0.90 support level after a steep 10% daily timeframe decline.
However, historical indicators reveal frequent high-volume accumulation near $0.90, suggesting it serves as a pivotal buy wall.
In affirmation of this stance, technical indicators on the 12-hour chart show ADA price has moved above the Volume-Weighted Average Price (VWAP) at $0.92 indicating strong buying support.
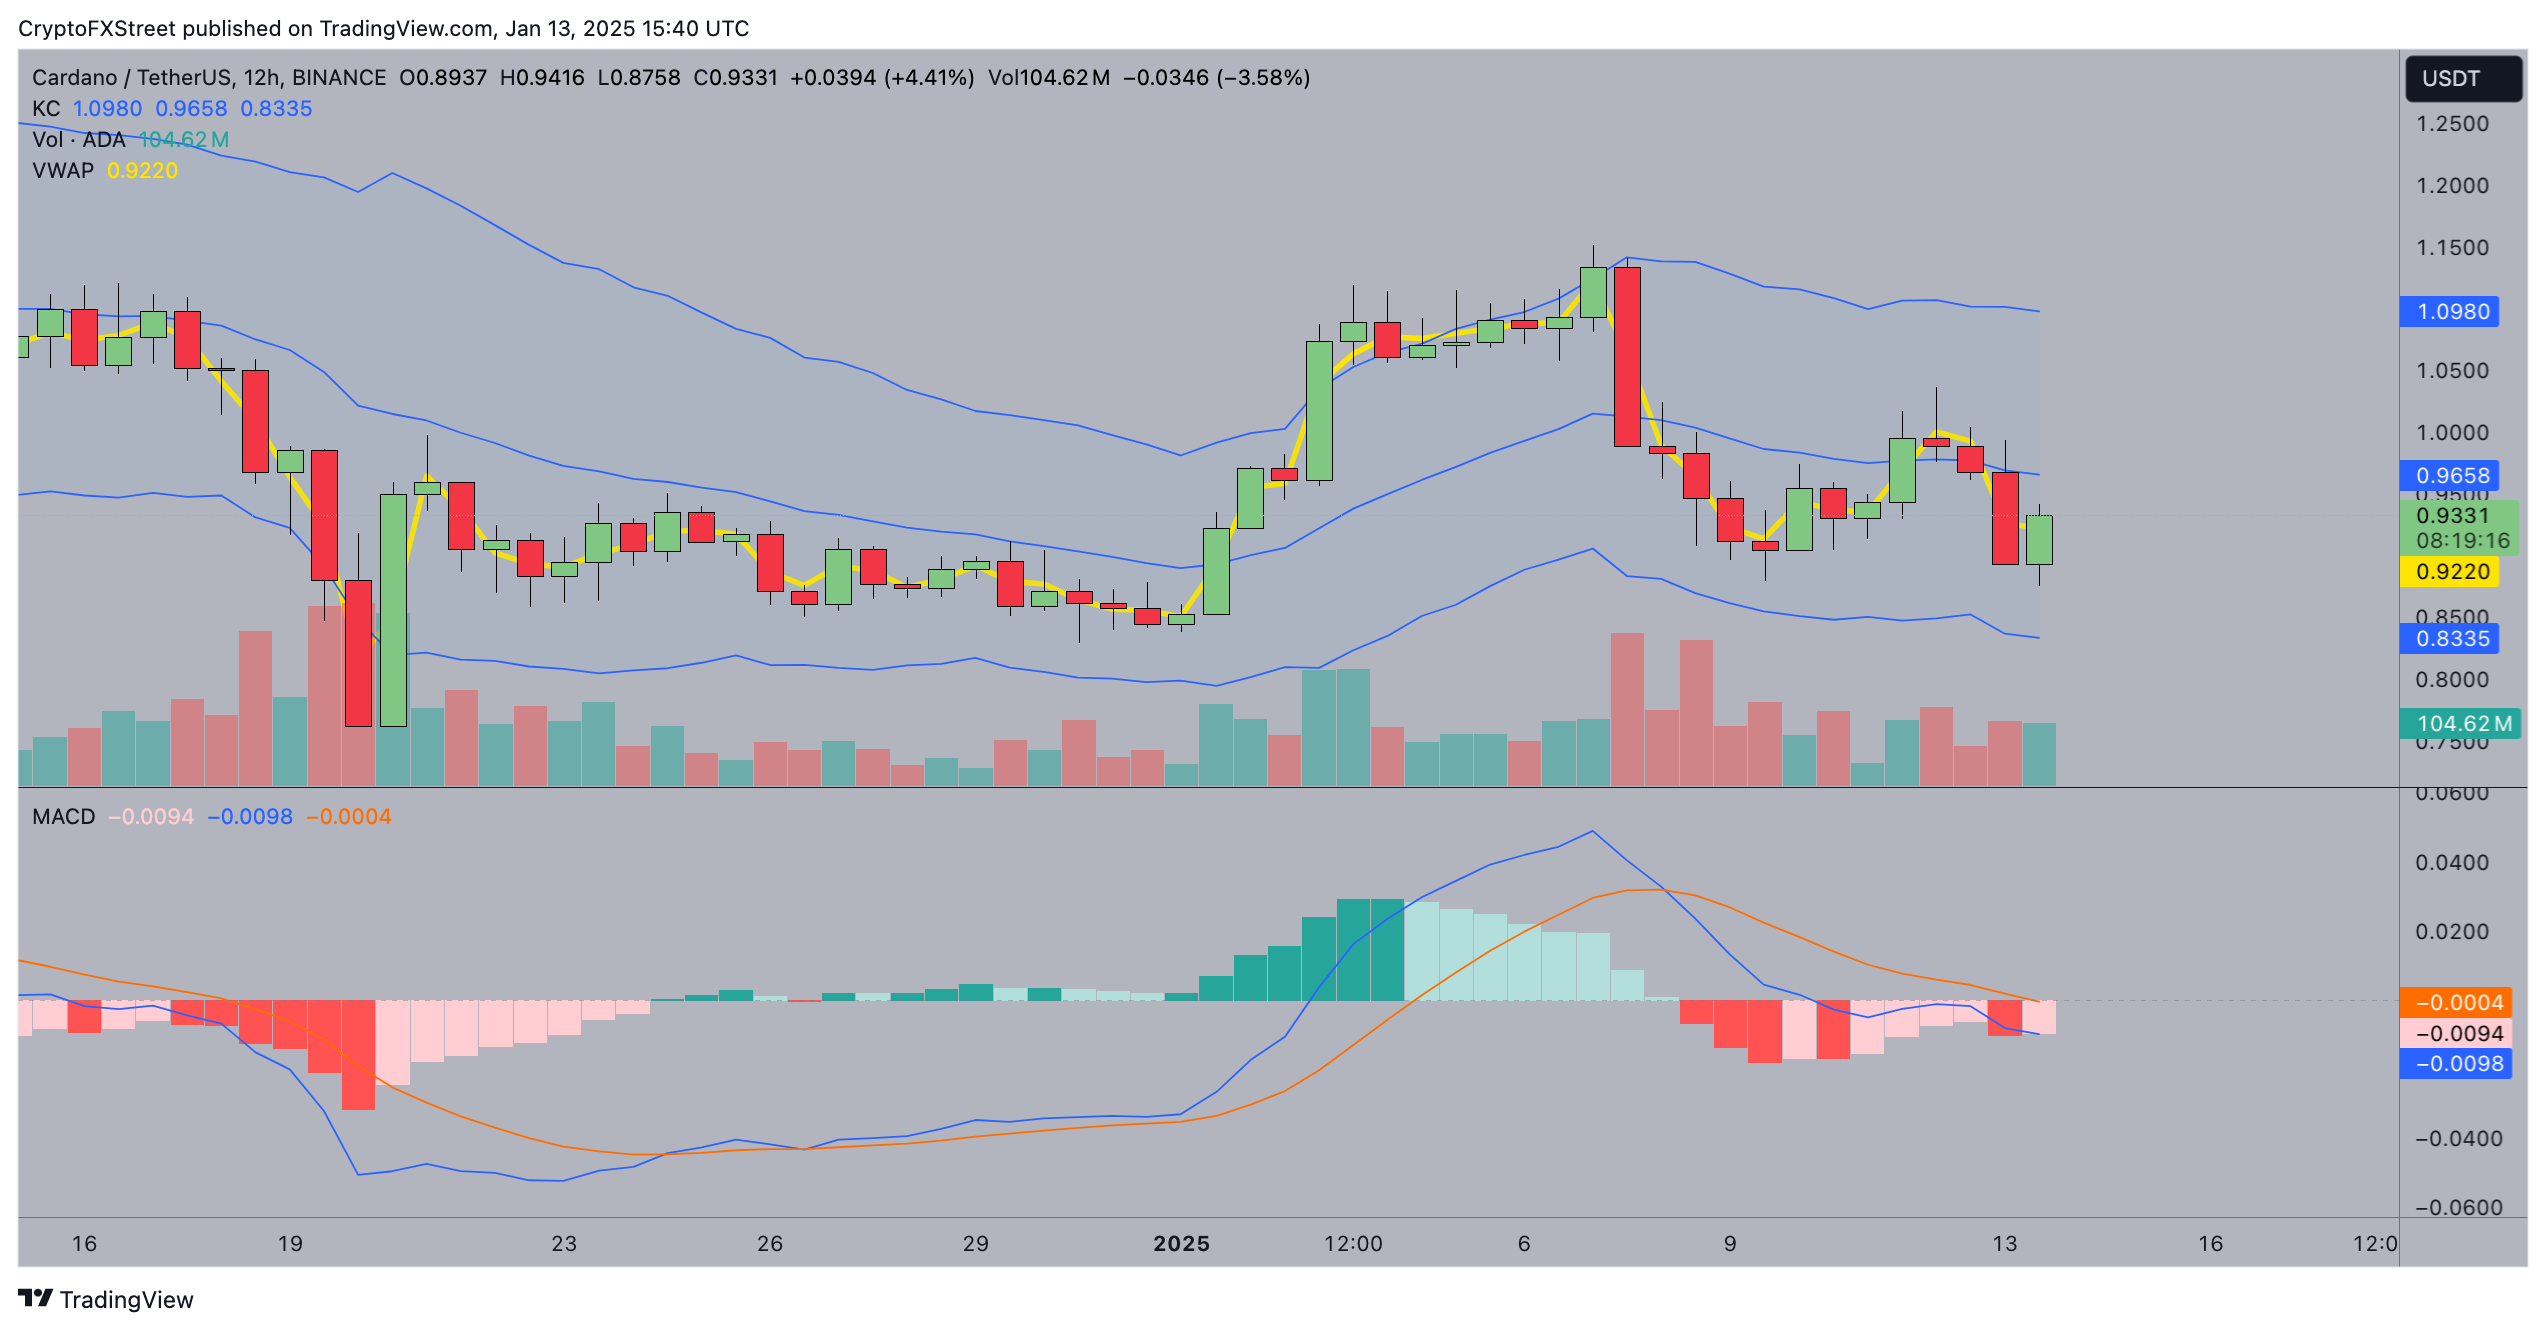 Cardano Price Forecast | ADAUSDT
Adding to this bullish case, the Moving Average Convergence Divergence (MACD) in the same time frame reflects a narrowing gap between the signal and MACD lines, nearing a bullish crossover zone.
Should the price stabilize above $0.91, a rally toward the upper Keltner Channel boundary at $0.96 could materialize, with $0.99 acting as a subsequent resistance target.
Conversely, failure to hold $0.90 could lead to renewed selling pressure, dragging ADA toward $0.83.
The MACD’s marginally negative readings signal vulnerability if buyers fail to sustain momentum.
Recommended Articles


