

Cardano (ADA) Momentum Builds: Rally Has More Room to Run

Source Newsbtc

Cardano price started a fresh surge above the $1.00 zone. ADA is consolidating and might aim for a fresh increase above the $1.1150 level.

  • ADA price started a downside correction from the $1.1150 zone.
  • The price is trading above $1.00 and the 100-hourly simple moving average.
  • There is a short-term rising channel forming with support at $1.075 on the hourly chart of the ADA/USD pair (data source from Kraken).
  • The pair could start another increase if it clears the $1.1150 resistance zone.

Cardano Price Starts Fresh Surge

After forming a base above the $0.80 level, Cardano started a fresh increase, beating Bitcoin and Ethereum. ADA surged above the $0.90 and $1.00 levels.

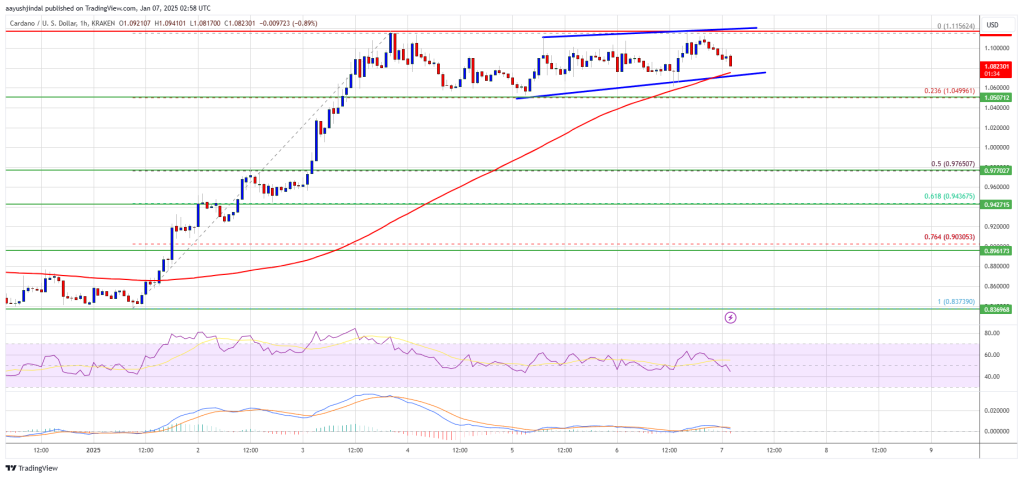
The bulls even pushed the price above $1.120. A high was formed at $1.1156 and the price is now consolidating gains. There was a minor decline below $1.1120, but the price remained above the 23.6% Fib retracement level of the upward move from the $0.8373 swing low to the $1.1156 high.

Cardano price is now trading above $1.00 and the 100-hourly simple moving average. There is also a short-term rising channel forming with support at $1.075 on the hourly chart of the ADA/USD pair.
Cardano Price

On the upside, the price might face resistance near the $1.10 zone. The first resistance is near $1.1120. The next key resistance might be $1.1150. If there is a close above the $1.1150 resistance, the price could start a strong rally. In the stated case, the price could rise toward the $1.20 region. Any more gains might call for a move toward $1.250 in the near term.

Downside Correction in ADA?

If Cardano’s price fails to climb above the $1.1120 resistance level, it could start another decline. Immediate support on the downside is near the $1.080 level.

The next major support is near the $1.050 level. A downside break below the $1.050 level could open the doors for a test of $0.975 or the 50% Fib retracement level of the upward move from the $0.8373 swing low to the $1.1156 high. The next major support is near the $0.950 level where the bulls might emerge.

Technical Indicators

Hourly MACD – The MACD for ADA/USD is gaining momentum in the bullish zone.

Hourly RSI (Relative Strength Index) – The RSI for ADA/USD is now above the 50 level.

Major Support Levels – $1.0800 and $1.050.

Major Resistance Levels – $1.1120 and $1.1150.

Disclaimer: For information purposes only. Past performance is not indicative of future results.
placeholder
WTI (USOIL) Is down 2.03% on Sep 25: Here Is WhyWTI (USOIL) is down 2.03% at Sep 24 22:20(UTC+0), now at $92.517, with a 7-day down of 3.63%.What is driving WTI (USOIL)’s stock price down today?The drop in WTI crude oil prices was primarily driven by
Author  TradingKey
17 hours ago
WTI (USOIL) is down 2.03% at Sep 24 22:20(UTC+0), now at $92.517, with a 7-day down of 3.63%.What is driving WTI (USOIL)’s stock price down today?The drop in WTI crude oil prices was primarily driven by
placeholder
Silver Price Forecast: XAG/USD remains steady near $64.00 as oil prices easeSilver price (XAG/USD) inches higher after two days of losses, trading around $63.90 per troy ounce during Asian hours on Friday. Non-yielding Silver is finding underlying support as inflation concerns ease following a pullback in crude oil prices.
Author  FXStreet
19 hours ago
Silver price (XAG/USD) inches higher after two days of losses, trading around $63.90 per troy ounce during Asian hours on Friday. Non-yielding Silver is finding underlying support as inflation concerns ease following a pullback in crude oil prices.
placeholder
Gold Price Forecast: Gold Drops Below $4,300, Will It Continue to Fall? As of the European session on September 24, gold prices (XAUUSD) extended their correction, dipping below $4,300 intraday to hit a low of $4,262.45. After previously rebounding close to $
Author  TradingKey
Yesterday 09: 57
As of the European session on September 24, gold prices (XAUUSD) extended their correction, dipping below $4,300 intraday to hit a low of $4,262.45. After previously rebounding close to $
placeholder
Yen touches 158.37 as Tokyo reopens, then slips back — ¥15.4 trillion of intervention and the 200-day line stand between here and 160USD/JPY reached 158.37 overnight, its highest since early September, then eased to 157.88 as Japanese markets reopened after a three-day holiday. The Ministry of Finance has spent ¥15.4 trillion defending the yen since late July and the BOJ ran a rate check on September 18. The 200-day average sits at 158.43.
Author  Irene Q.
Yesterday 06: 59
USD/JPY reached 158.37 overnight, its highest since early September, then eased to 157.88 as Japanese markets reopened after a three-day holiday. The Ministry of Finance has spent ¥15.4 trillion defending the yen since late July and the BOJ ran a rate check on September 18. The 200-day average sits at 158.43.
placeholder
US input costs rose at the fastest pace in four years — the September flash PMI beat is an inflation story, not a growth storyUS September flash PMIs came in far above expectations, with the composite at 58.4, a five-year high. But the detail that moved markets was input cost inflation at its fastest since October 2022, driven by fuel, transport and supply shortages. Brent is back above $100 and the 10-year Treasury yield has hit its highest since 2007.
Author  Suzie
Yesterday 06: 46
US September flash PMIs came in far above expectations, with the composite at 58.4, a five-year high. But the detail that moved markets was input cost inflation at its fastest since October 2022, driven by fuel, transport and supply shortages. Brent is back above $100 and the 10-year Treasury yield has hit its highest since 2007.
goTop
quote