XRP Price Prediction: XRP overtakes USDT after Ripple unlocks 500M ahead of Trump inauguration

Source Fxstreet
  • Ripple (XRP) price surged 22% in 3 days to hit $2.47 on Friday, as crypto markets started 2025 on a positive note.
  • On-chain data shows the price rally coincided with a cryptic Trump-related message embedded in Ripple’s latest 500 million XRP escrow transaction on January 1.
  • XRP Weighted Sentiment turned increasingly negative on Tuesday, signaling room for further upside as market sentiment rebounds from the holiday sell-off.


Ripple (XRP) price reached a 14-day peak of $2.5 on Friday, as the mega-cap altcoins make a positive start to 2025.

With market sentiment still trending cautious, on-chain data suggests XRP price could potentially score larger gains as the United States (US) President-elect Donald Trump inauguration nears. 

XRP starts 2025 with a 23% rally as Ripple’s Trump reference ruffles feathers

On Wednesday, Ripple unlocked another 500 million XRP tokens from its escrow account as a part of Ripple’s monthly schedule to manage the token supply.

However, a cryptic message referencing Trump's upcoming inauguration embedded in Ripple’s latest transaction has sparked a positive market reaction.

XRP community influencer JackTheRippler alerted his 302,400 followers on X to a memo accompanying Ripple’s latest transaction details. 

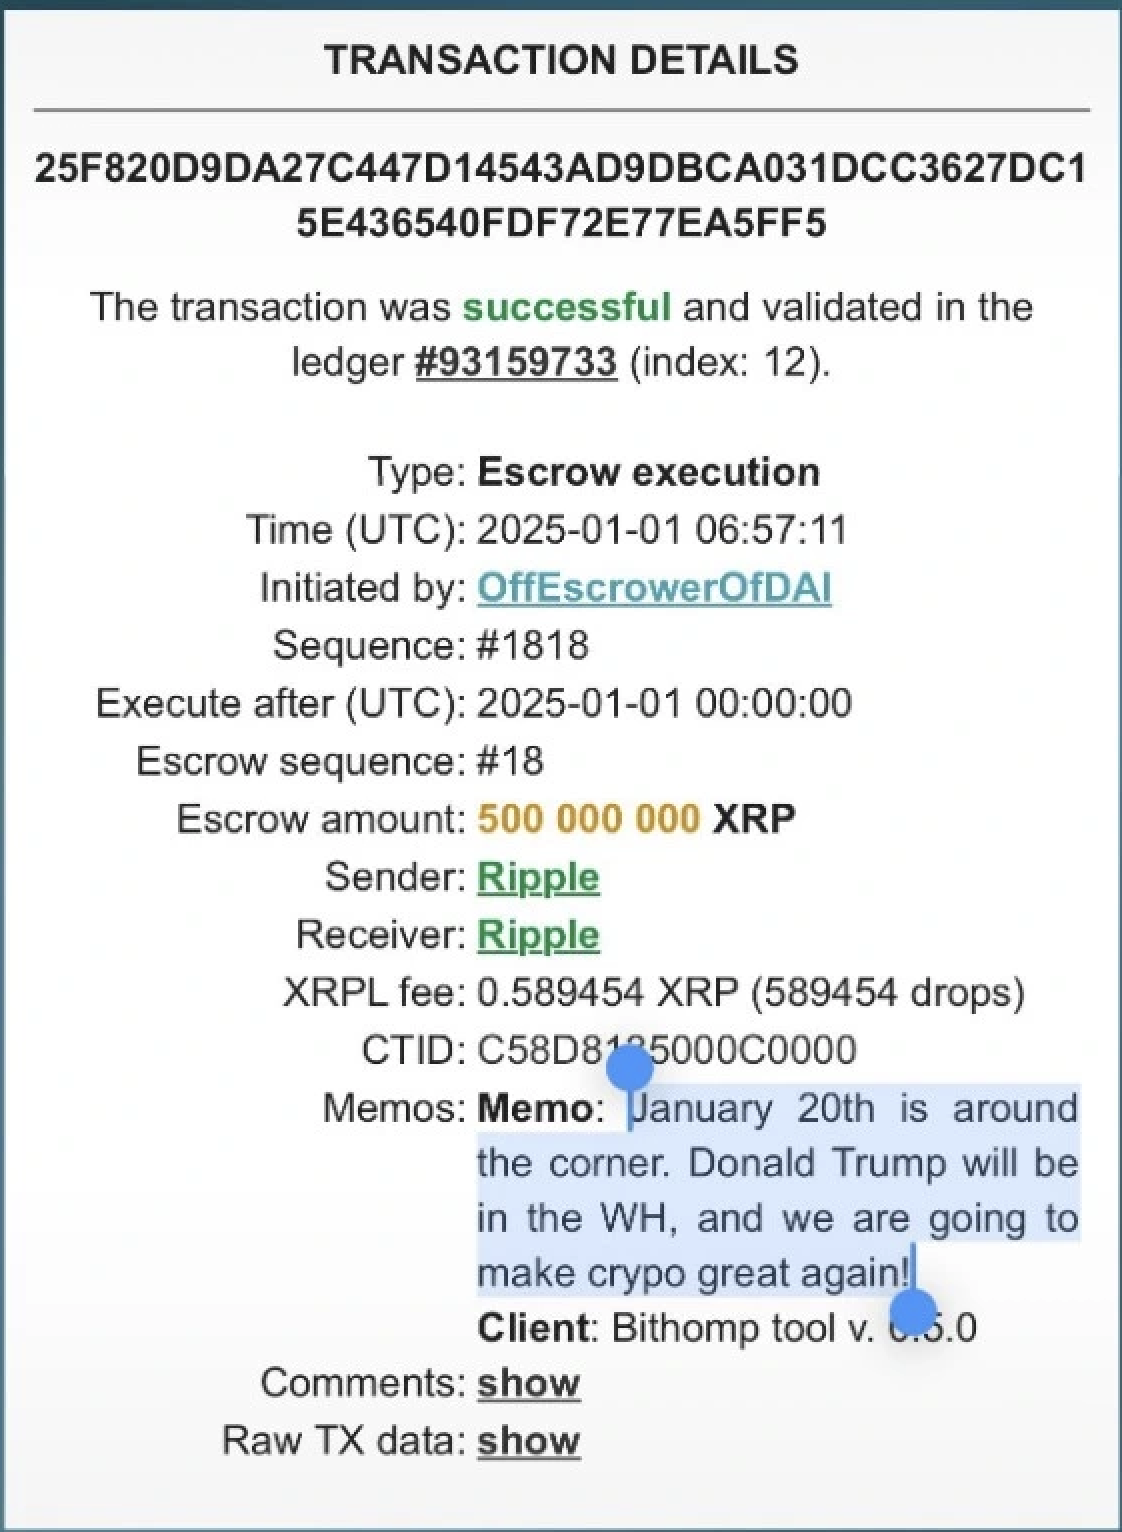
Transaction details of the 500M XRP Tokens (Source: X Post)

The meme read: “January 20th is around the corner. Donald Trump will be in WH [Whitehouse], and we are going to make crypto great again.” 

Hinting at potential transformative changes in crypto under the Trump administration, this transaction meme has ignited optimism within the XRP spot markets. 

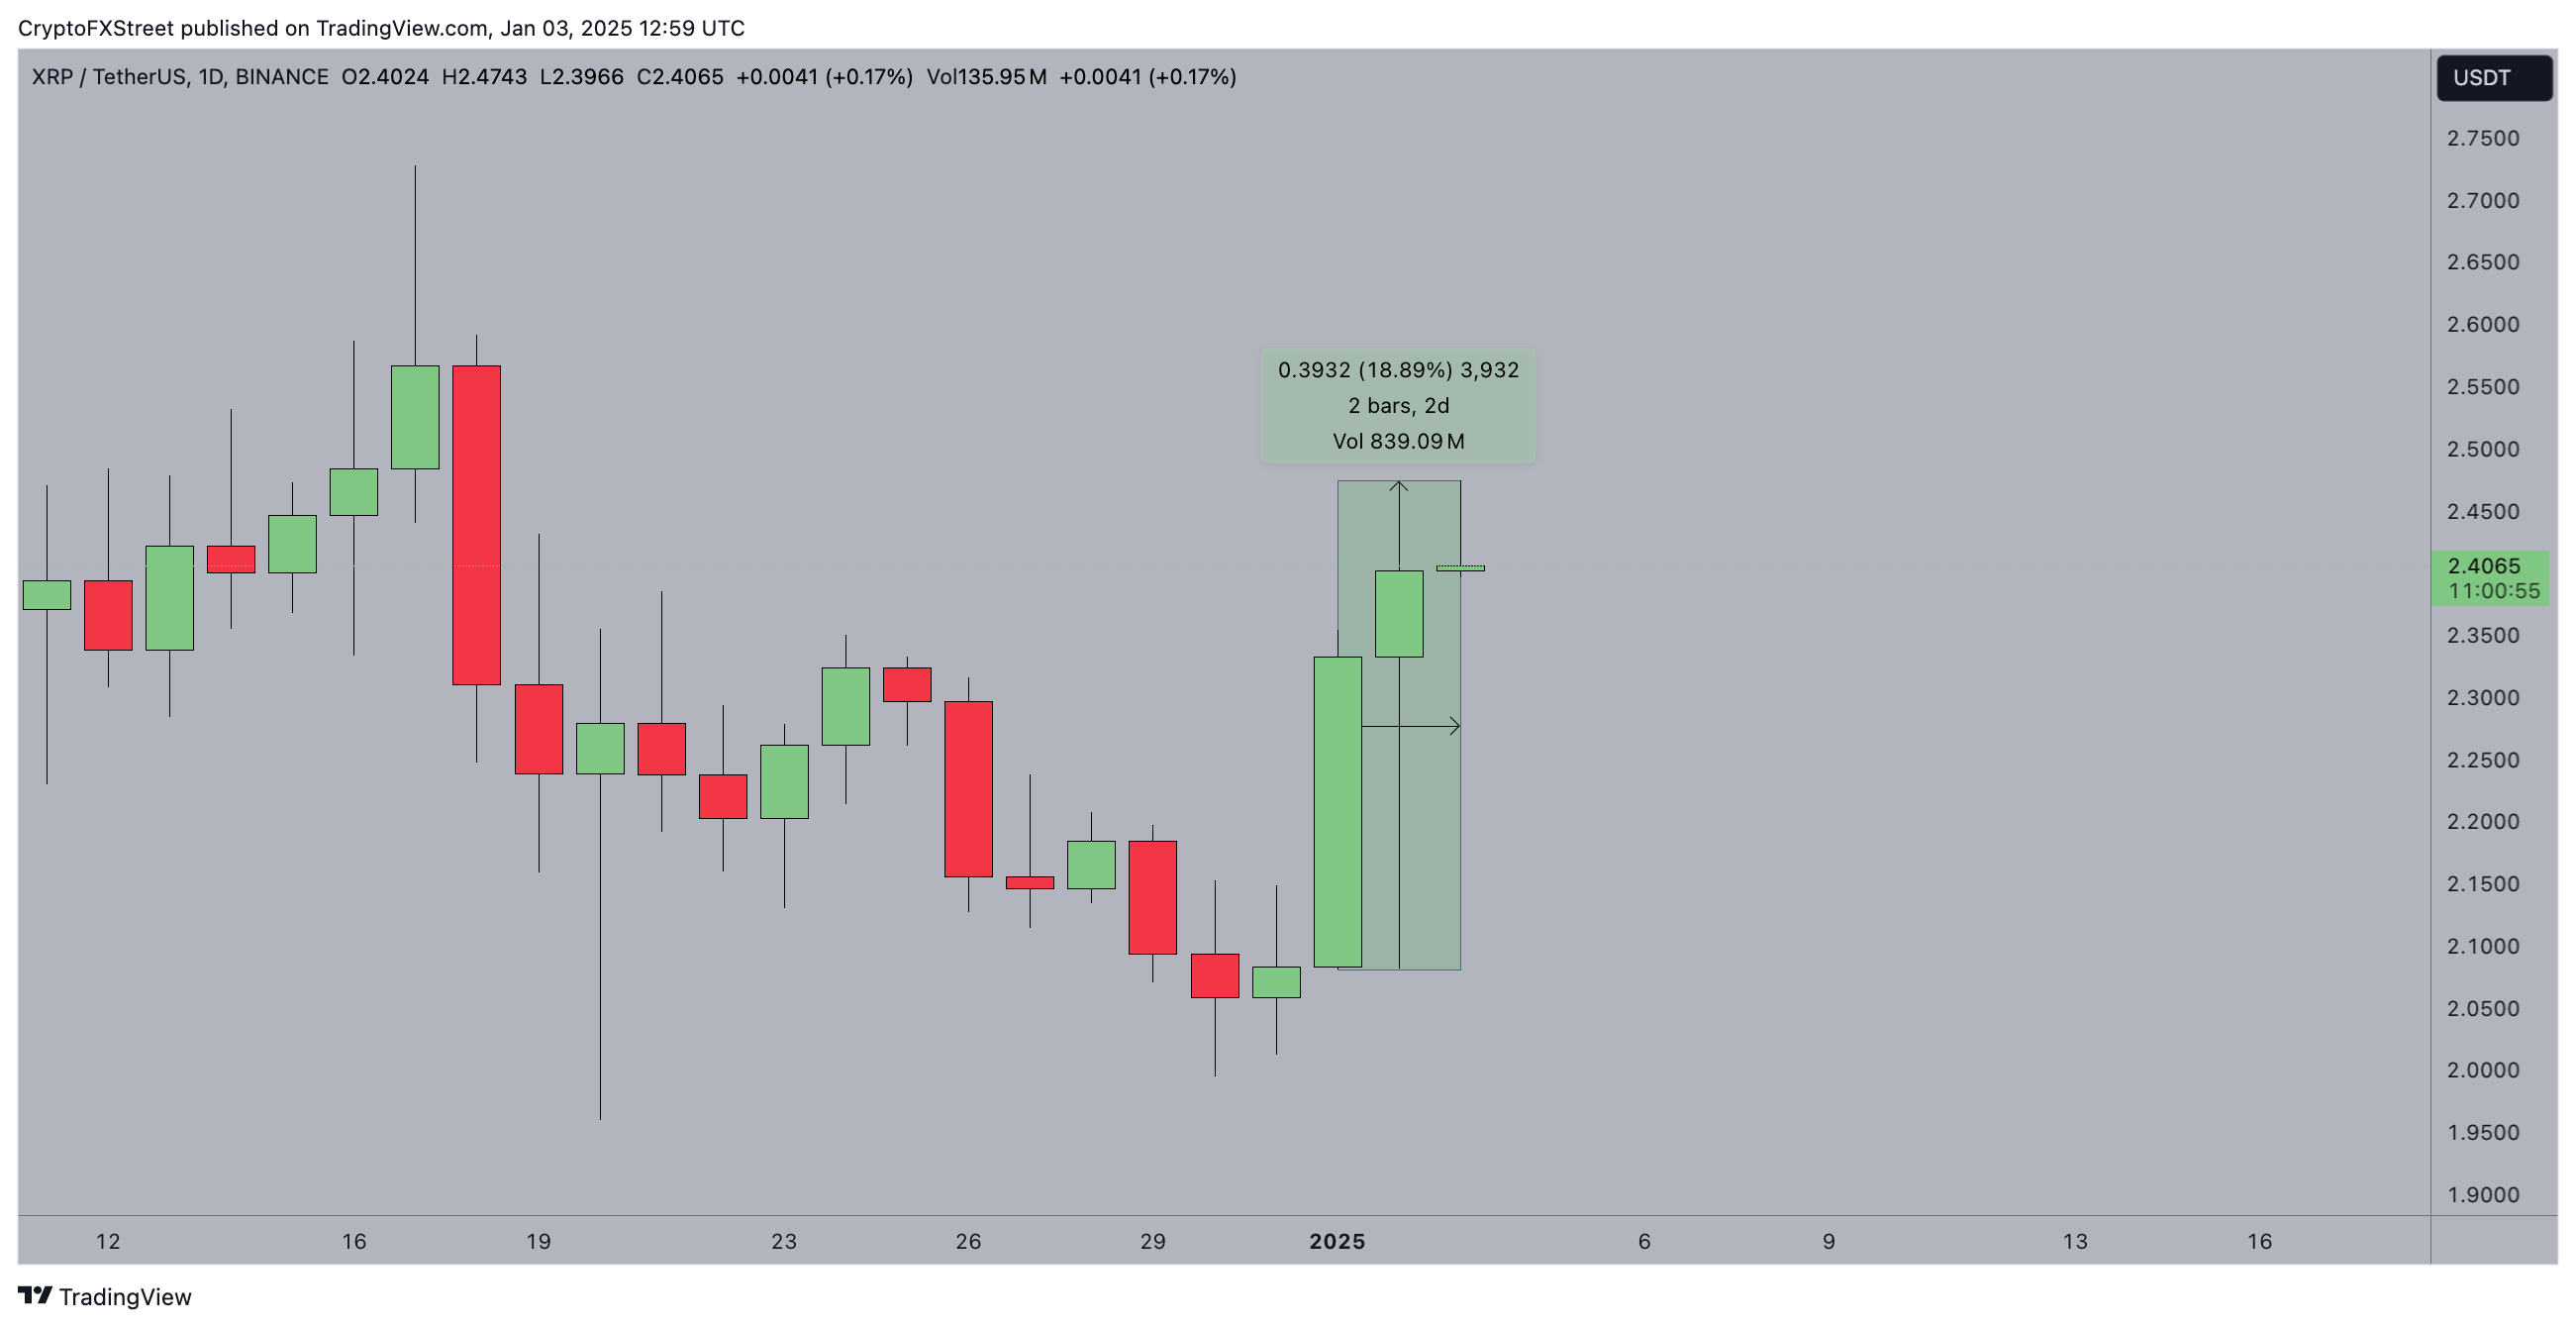
Ripple (XRP) price action | January 3, 2025 

As seen in the chart above, XRP opened trading at $2.1 on Wednesday. But since the Trump reference embedded in Ripple’s latest escrow transaction, XRP price has surged by 23% to hit the $2.5 level on Friday, overtaking Tether (USDT) as the third largest cryptocurrency project by market capitalization. 

Market sentiment remains cautious despite recent gains

Despite the recent price surge, on-chain data aggregates show market sentiment is yet to recover from the US Federal Reserve (Fed)-induced bearish headwinds in the second-half of December. 

Affirming this narrative, Santiment’s Weighted Sentiment chart below tracks the incidence of positive and negative discourse around XRP. 

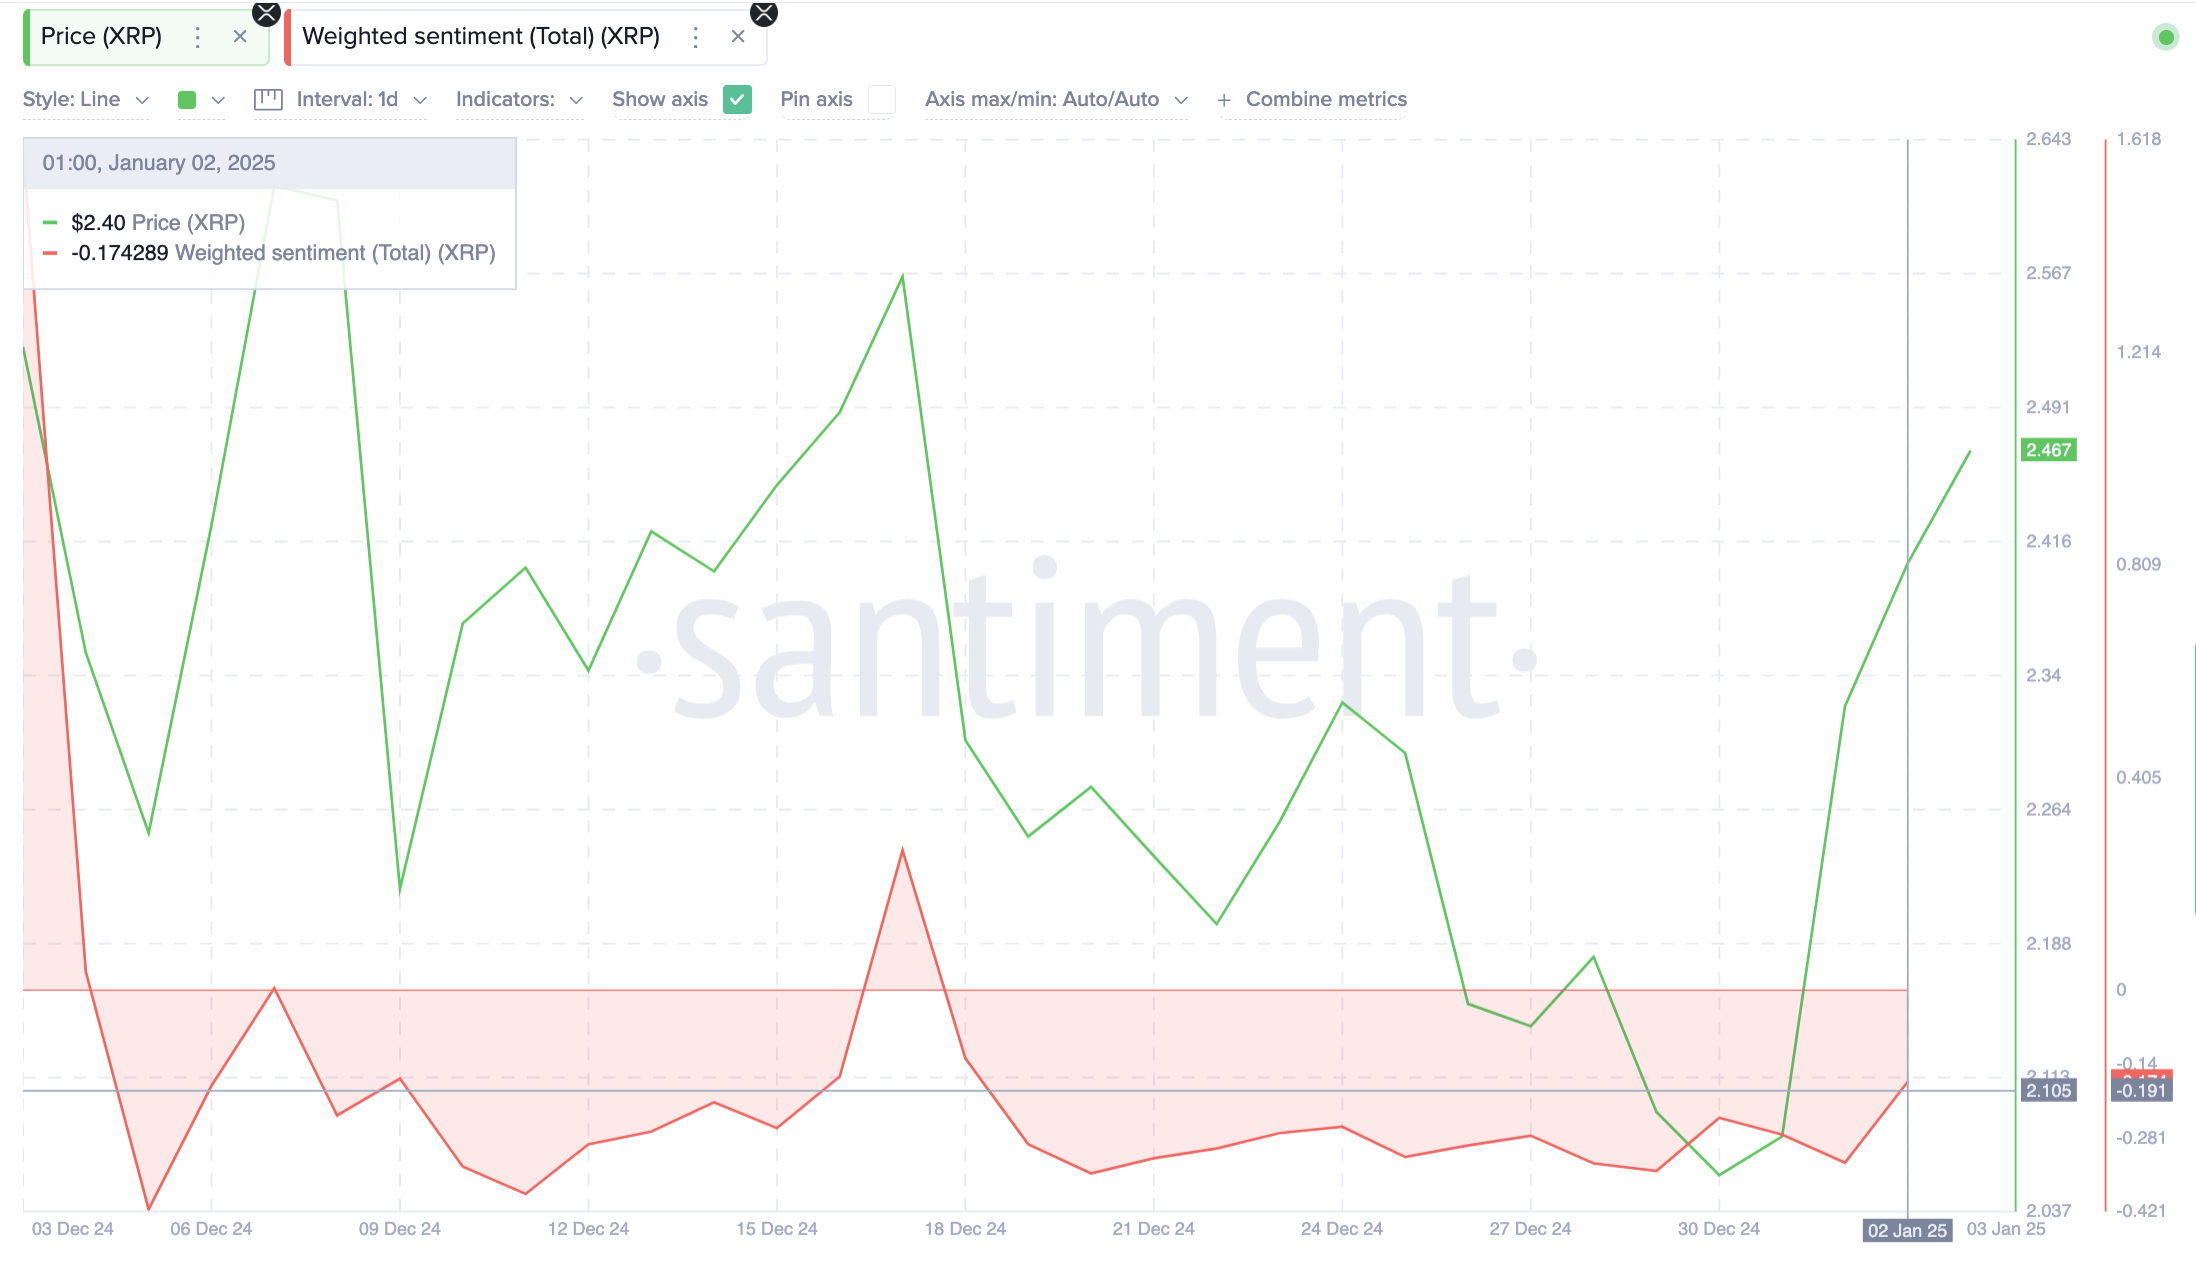
Ripple (XRP) Weighted Sentiment | January 2025 | Source: Santiment

As seen above, XRP Weighted Sentiment still trends in negative values of -0.2 as of Friday, showing that negative comments still outpace the positives.

This implies that despite the 23% gains in the first three days of 2025, the majority of traders still maintain a cautious outlook.  

Essentially, this hints at further XRP price upside potential for two reasons.

First, the lingering negative sentiment suggests that many traders may still be on the sidelines, providing room for fresh capital inflows as confidence improves.

Second, such an accelerated price rally amidst cautious aggregate market sentiment reflects underlying buying pressure from XRP whales and large institutional players. 

If the current market dynamics persist, XRP price could potentially advance further towards $3 ahead of Trump’s inauguration slated for January 20. 

XRP Price Forecast: Community hints $3 rally ahead of Trump inauguration

Ripple’s cryptic Trump-related message embedded in its Wednesday transaction memo sent XRP rallying 23% to $2.5 within three days, outperforming BTC and ETH as the crypto markets began 2025 with bullish momentum. 

Despite the price surge, cautious market sentiment persists, reflected in XRP’s weighted sentiment remaining negative.

This indicates potential for further upside as sidelined traders may re-enter the market, fueling more gains in the days leading to Trump’s inauguration.

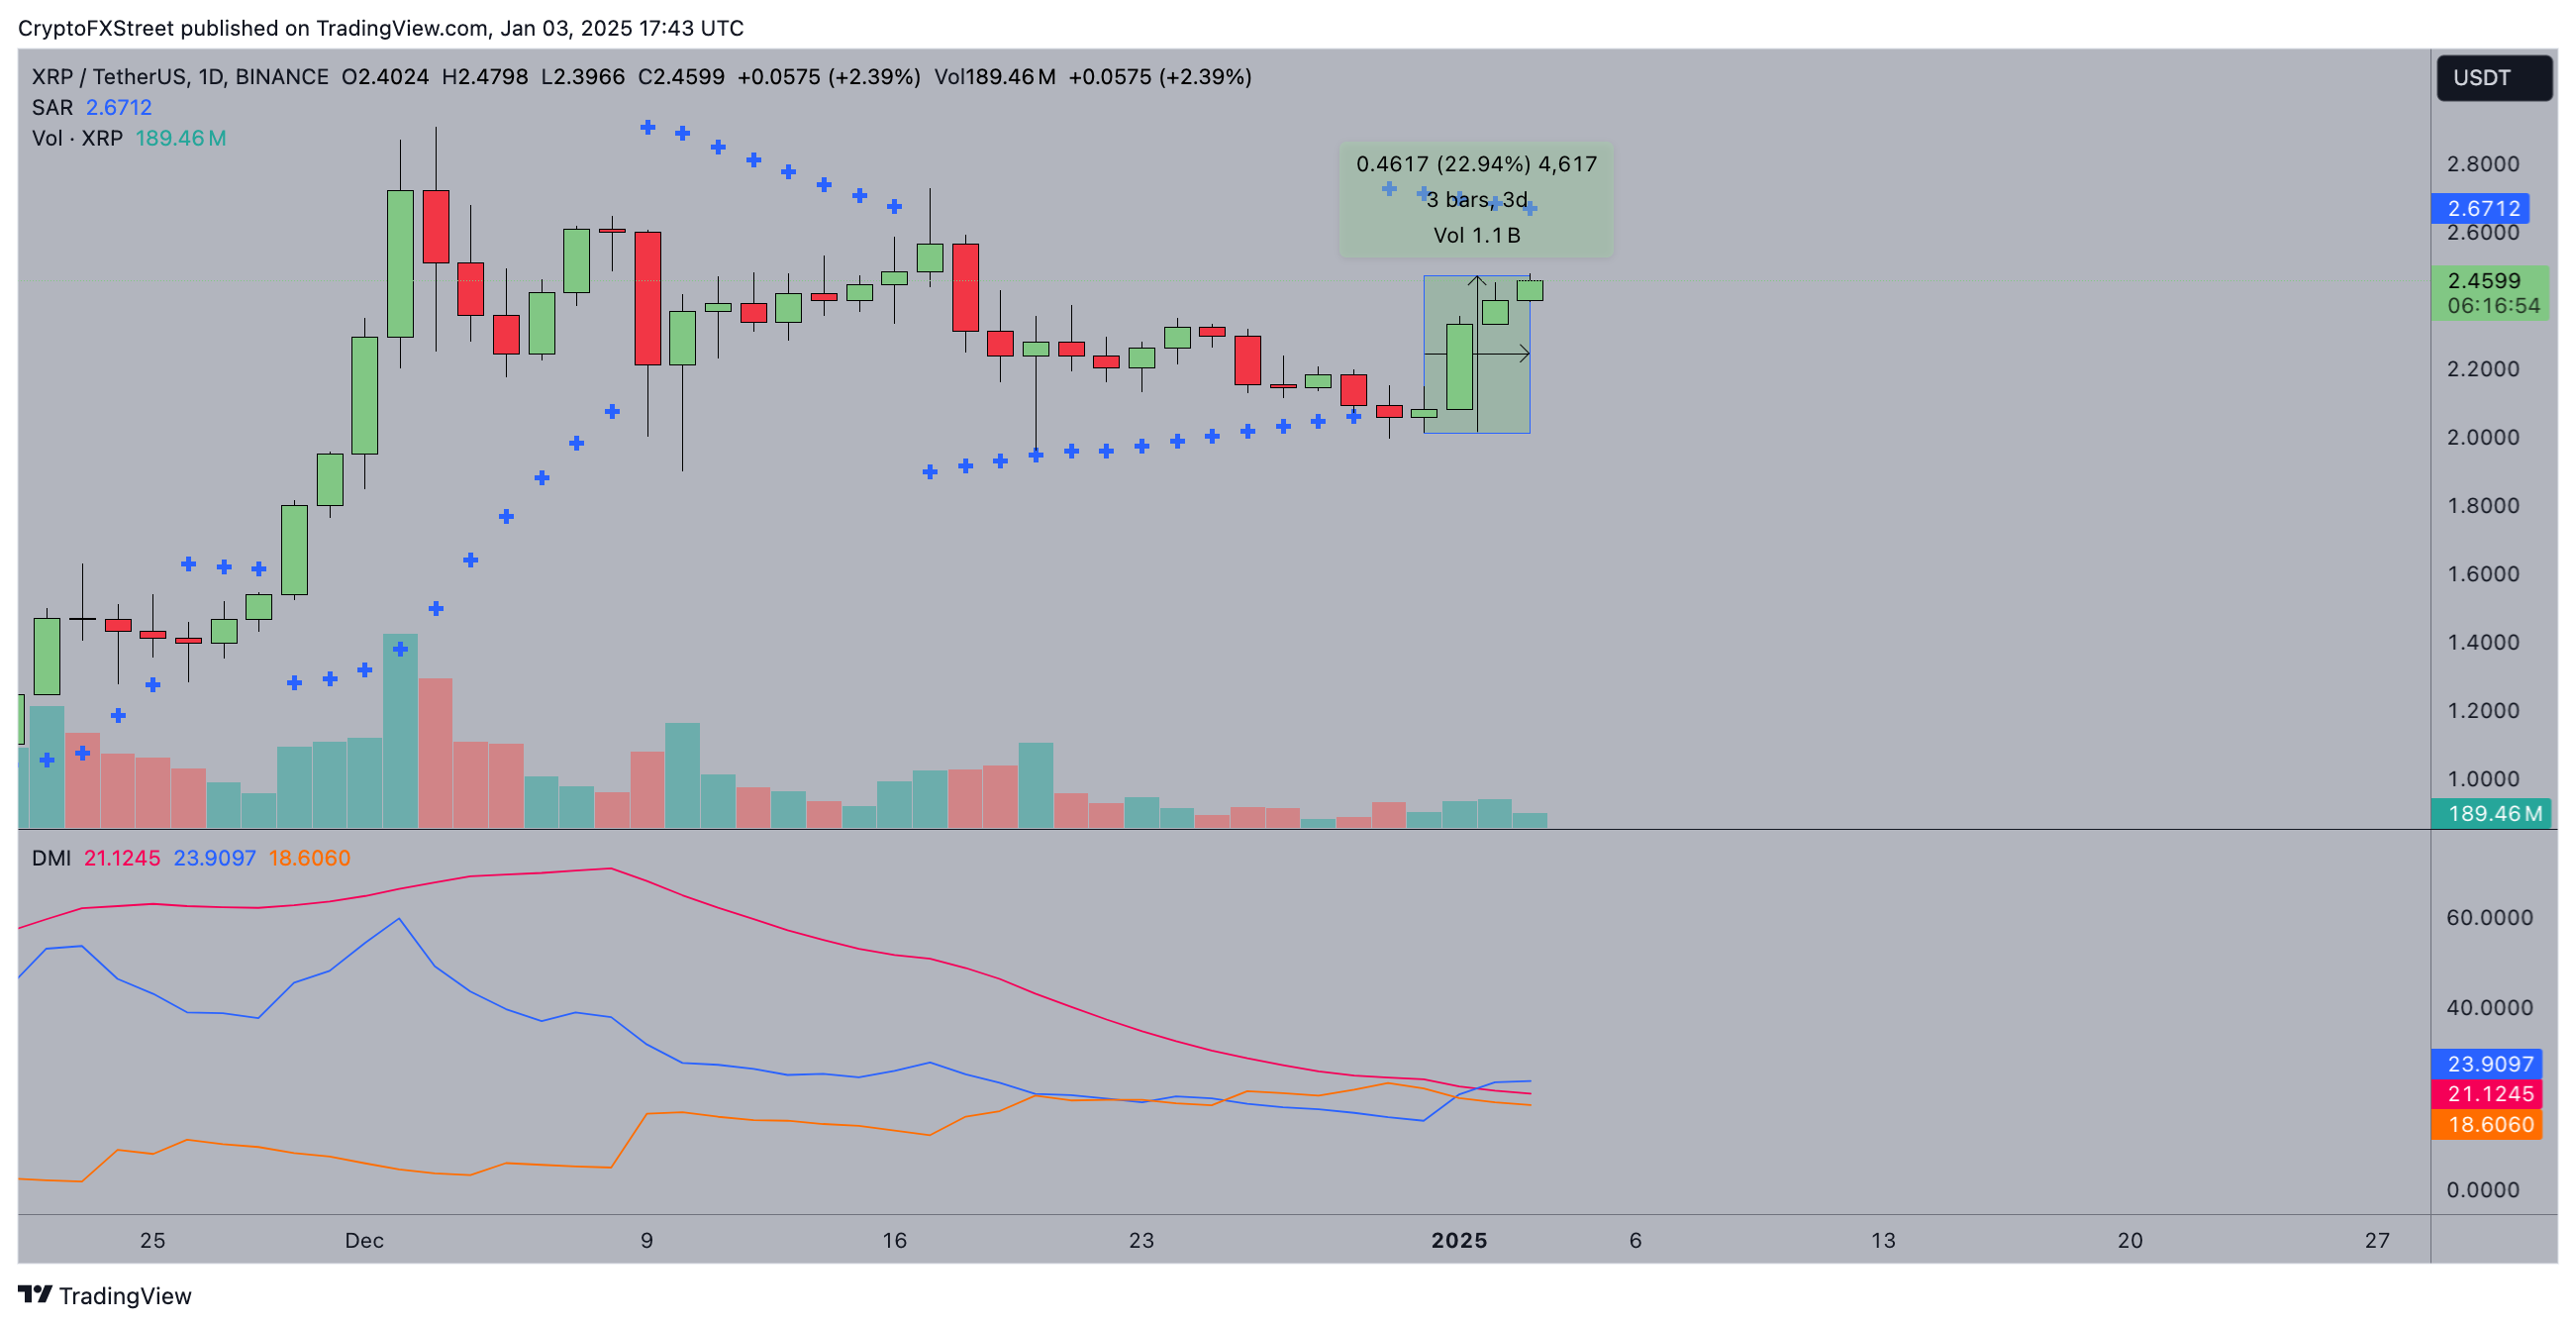
XRP price forecast | XRPUSDT

XRP’s bullish outlook is supported by rising trading volumes and four consecutive green candles, signaling strong buyer interest.

However, the Parabolic SAR remains above the current price, suggesting upside potential before market saturation.

A close above the $2.67 level could set the pace for the next breakout attempt toward the next major resistance at $3.

On the downside, support is seen at $2.30, with a critical level at $2.10 if bearish pressures escalate.
 

Disclaimer: For information purposes only. Past performance is not indicative of future results.
placeholder
U.S. November Nonfarm Payrolls: What Does the Rare "Weak Jobs, Strong Economy" Mix Mean for U.S. Equities?1. IntroductionAfter retreating from the late-October highs, U.S. equities embarked on a bottoming rebound in mid-to-late November, a trend driven by the interplay of multiple factors. That said, it i
Author  TradingKey
9 hours ago
1. IntroductionAfter retreating from the late-October highs, U.S. equities embarked on a bottoming rebound in mid-to-late November, a trend driven by the interplay of multiple factors. That said, it i
placeholder
Senate Delays Crypto Market Structure Hearings to Early 2026The Senate Banking Committee has postponed cryptocurrency market structure hearings until 2026, citing ongoing bipartisan negotiations.
Author  Mitrade
14 hours ago
The Senate Banking Committee has postponed cryptocurrency market structure hearings until 2026, citing ongoing bipartisan negotiations.
placeholder
Bitcoin Slides 5% as Sellers Lean In — Can BTC Reclaim $88,000?Bitcoin has dropped back below $88,000 after rolling over from $90,500, with price still trading under the 100-hour Simple Moving Average. The sell-off found a floor at $85,151, and BTC is now consolidating near that base, but rebounds are facing pressure from a bearish trend line around $89,000. Bulls need to retake $88,000–$89,000 to ease downside risk; failure to do so keeps $85,500–$85,000 and then $83,500 in play, with $80,000 as the deeper “line in the sand.” Bitcoin (BTC) is back in damage-control mode after a sharp pullback wiped out recent gains. The price failed to reclaim the $90,000–$90,500 band, rolled over, and slid through $88,500 before briefly dipping under $87,000. Buyers did show up around $85,000, but the rebound so far looks more like stabilization than a clear trend reversal. Bitcoin dips hard, finds a bid near $85,000(h3) BTC’s latest move lower began when it couldn’t build follow-through above $90,000 and $90,500. Once that upside stalled, sellers took control and pushed price down through $88,500. The slide accelerated enough to spike below $87,000, but the market didn’t free-fall. Bulls defended the $85,000 zone, printing a low at $85,151. Since then, Bitcoin has been consolidating below the 23.6% Fibonacci retracement of the drop from the $93,560 swing high to the $85,151 low — a clue that the bounce is still shallow and that sellers haven’t fully backed off yet. Structurally, BTC is still on the back foot: It’s trading below $88,000, and It remains below the 100-hour Simple Moving Average, keeping short-term trend pressure pointed downward. Resistance is layered, and $89,000 is the problem area(h3) If bulls try to turn this into a recovery, they’ll have to climb through multiple ceilings in quick succession. First, BTC faces resistance around $87,150, followed by a more meaningful barrier near $87,500. From there, the market’s attention snaps back to $88,000 — the level BTC just lost and now needs to reclaim. A close back above $88,000 would improve the tone, but it doesn’t solve the bigger issue: there’s a bearish trend line on the hourly BTC/USD chart (Kraken feed) with resistance near $89,000, which also lines up with the next technical hurdle. If BTC can push through $89,000 and hold, the rebound could extend toward $90,000, with follow-through targets at $91,000 and $91,500. But until price clears that $88,000–$89,000 zone, rallies are at risk of being sold rather than chased. If BTC fails to reclaim resistance, the downside path is clear(h3) The near-term bear case is simple: if Bitcoin can’t climb back above the $87,000 area and keep traction, sellers may attempt another leg lower. Support levels line up like this: Immediate support: $85,500 First major support: $85,000 Next support: $83,500 Then $82,500 in the near term Below that, the major “don’t break this” level is still $80,000. If BTC slips under $80,000, the risk of acceleration to the downside increases significantly — not because it’s magic, but because it’s the kind of psychological and structural level that tends to trigger forced de-risking. Indicators: momentum still leans bearish(h3) The intraday indicators aren’t offering much comfort yet: Hourly MACD is losing pace in the bearish zone. Hourly RSI remains below 50, suggesting sellers still have the upper hand on short timeframes. So while the $85,000 defense held for now, the market hasn’t flipped bullish — it’s just stopped bleeding.
Author  Mitrade
17 hours ago
Bitcoin has dropped back below $88,000 after rolling over from $90,500, with price still trading under the 100-hour Simple Moving Average. The sell-off found a floor at $85,151, and BTC is now consolidating near that base, but rebounds are facing pressure from a bearish trend line around $89,000. Bulls need to retake $88,000–$89,000 to ease downside risk; failure to do so keeps $85,500–$85,000 and then $83,500 in play, with $80,000 as the deeper “line in the sand.” Bitcoin (BTC) is back in damage-control mode after a sharp pullback wiped out recent gains. The price failed to reclaim the $90,000–$90,500 band, rolled over, and slid through $88,500 before briefly dipping under $87,000. Buyers did show up around $85,000, but the rebound so far looks more like stabilization than a clear trend reversal. Bitcoin dips hard, finds a bid near $85,000(h3) BTC’s latest move lower began when it couldn’t build follow-through above $90,000 and $90,500. Once that upside stalled, sellers took control and pushed price down through $88,500. The slide accelerated enough to spike below $87,000, but the market didn’t free-fall. Bulls defended the $85,000 zone, printing a low at $85,151. Since then, Bitcoin has been consolidating below the 23.6% Fibonacci retracement of the drop from the $93,560 swing high to the $85,151 low — a clue that the bounce is still shallow and that sellers haven’t fully backed off yet. Structurally, BTC is still on the back foot: It’s trading below $88,000, and It remains below the 100-hour Simple Moving Average, keeping short-term trend pressure pointed downward. Resistance is layered, and $89,000 is the problem area(h3) If bulls try to turn this into a recovery, they’ll have to climb through multiple ceilings in quick succession. First, BTC faces resistance around $87,150, followed by a more meaningful barrier near $87,500. From there, the market’s attention snaps back to $88,000 — the level BTC just lost and now needs to reclaim. A close back above $88,000 would improve the tone, but it doesn’t solve the bigger issue: there’s a bearish trend line on the hourly BTC/USD chart (Kraken feed) with resistance near $89,000, which also lines up with the next technical hurdle. If BTC can push through $89,000 and hold, the rebound could extend toward $90,000, with follow-through targets at $91,000 and $91,500. But until price clears that $88,000–$89,000 zone, rallies are at risk of being sold rather than chased. If BTC fails to reclaim resistance, the downside path is clear(h3) The near-term bear case is simple: if Bitcoin can’t climb back above the $87,000 area and keep traction, sellers may attempt another leg lower. Support levels line up like this: Immediate support: $85,500 First major support: $85,000 Next support: $83,500 Then $82,500 in the near term Below that, the major “don’t break this” level is still $80,000. If BTC slips under $80,000, the risk of acceleration to the downside increases significantly — not because it’s magic, but because it’s the kind of psychological and structural level that tends to trigger forced de-risking. Indicators: momentum still leans bearish(h3) The intraday indicators aren’t offering much comfort yet: Hourly MACD is losing pace in the bearish zone. Hourly RSI remains below 50, suggesting sellers still have the upper hand on short timeframes. So while the $85,000 defense held for now, the market hasn’t flipped bullish — it’s just stopped bleeding.
placeholder
AUD/USD remains depressed below mid-0.6600s; downside seems limited ahead of US NFP reportThe AUD/USD pair attracts some sellers for the fourth straight day on Tuesday and trades around the 0.6630 region, down just over 0.10%, during the Asian session.
Author  FXStreet
18 hours ago
The AUD/USD pair attracts some sellers for the fourth straight day on Tuesday and trades around the 0.6630 region, down just over 0.10%, during the Asian session.
placeholder
Macro Analysts: Hawkish Japan Could Push Bitcoin Below $70KAnalysts predict Bitcoin may face further declines towards the $70,000 mark if the Bank of Japan raises interest rates as expected.
Author  Mitrade
Yesterday 05: 48
Analysts predict Bitcoin may face further declines towards the $70,000 mark if the Bank of Japan raises interest rates as expected.
goTop
quote