Volatility Ahead With 3 US Economic Data Driving Bitcoin Sentiment This Week

Source Beincrypto

Crypto market participants have three US economic data to monitor this week that could influence Bitcoin (BTC) sentiment and cause volatility. The interest comes amid the significant influence of US macroeconomic data on Bitcoin and crypto markets in general this year, after a dried-up period in 2023.

Meanwhile, Bitcoin price remains just shy of $100,000, hovering within the $99,000 range throughout the weekend.

3 US Economic Data That Could Influence Bitcoin Price This Week

This week promises to be very event-rich, with the following US economic data expected to drive volatility in the Bitcoin and altcoin markets.

US Economic Data
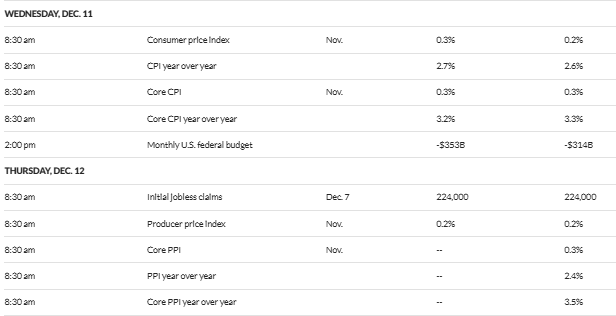
US Economic Data This Week. Source: MarketWatch

US CPI

The US CPI (Consumer Price Index) is a key watch among US economic data this week. It is due for release on Wednesday, December 11, at 8:30 A.M. Eastern Time. Released by the US Bureau of Labor Statistics (BLS), this macroeconomic data measures the monthly change in prices paid by consumers, effectively tracking inflation over time.

During the previous US CPI data release, the BLS revealed rising inflation to 2.6%. Specifically, inflation held steady at 0.2%, matching September’s figure. However, the annual increase of 2.6% marked the first uptick in eight months. 

This raised speculation of Federal Reserve (Fed) tightening. However, institutional interest in BTC buoyed the value of the pioneer crypto as it continues to appeal as a store of value, thereby attracting demand.

There is a median forecast of 0.3%, which means prices are expected to rise 0.3% on a month-over-month basis, per economist projections. This would be above the 0.2% month-over-month increase in September. There is also a consensus of 2.7% among Wall Street economists.

All eyes will be on the Labor Department this Wednesday as US inflation data comes into focus. In addition to the headline data, the core CPI inflation will also be a key watch this week, offering a more stable reading on inflation because it strips out food and energy prices from the calculation.

Core CPI inflation is of key interest because the prices of goods tend to see sizable and unpredictable changes month to month that have little to do with consumer demand. In November, the core CPI is expected to have risen 3.3% over last year. If it happens this way, it would mark the fourth straight month of a 3.3% reading.

Meanwhile, monthly core price increases are expected at 0.3%, also in line with the October gain.

Due to its decentralized nature and limited supply, Bitcoin is considered a hedge against inflation. On Wednesday, BTC could benefit from a rising trend in US CPI and core CPI. 

For the layperson, if investors perceive rising inflation as a threat to the purchasing power of traditional currencies like the US dollar, they may turn to alternative assets like Bitcoin as a store of value. This increased demand could potentially drive up the price of Bitcoin.

Initial Jobless Claims

The US jobless claims report for the week ending December 7 is due for release on Thursday. The data will provide insights into the labor market’s health and overall economic conditions.

Typically, high levels of jobless claims indicate economic distress and uncertainty. On the other hand, low levels suggest a strong job market and economic stability.

For the week ending November 30, applications for unemployment insurance increased to 224,000. This print came in above initial estimates of 215,000. It was also higher than the previous week’s tally of 215,000, revised from 213,000.

According to the BLS employment data, however, the American job market picked up slightly in November. The unemployment rate rose to 4.2%.

Specifically, the US added 227,000 nonfarm payroll (NFP) jobs in November after the labor market faltered in October. This was amid the Boeing strike and Hurricane Milton’s aftermath.

“The latest jobs data says the labor market is still going strong. After the softer numbers in October from the weather and striking workers, November bounces back with strong job growth along with upward revisions. On average, the economy added 173,000 jobs in the last 3 months,” Senior Economist with the Economic Policy Institute Elise Gould shared.

High levels of jobless claims on Thursday may contribute to negative market sentiment and uncertainty. This could lead investors to seek safe-haven assets like gold or Bitcoin. This increased demand for Bitcoin as a store of value could potentially drive up its price.

In the same way, high jobless claims could suggest weakening consumer spending and economic growth. This could influence central banks to implement expansionary monetary policies. Such an outcome may increase concerns about inflation and currency devaluation, prompting investors to turn to alternative assets like Bitcoin to protect their wealth.

US PPI

Also, on Thursday, the BLS will release the Producer Price Index (PPI), a reading on wholesale inflation. The data measures the average change over time in the selling prices received by domestic producers for their output. 

The CPI and PPI price data this week will be the main determinant of the Fed’s interest rate decision this month. What the data will show will mark significant milestones in the Fed’s policy adjustment calculus.  Of note is that this marks the final week of inflation data before the December Fed meeting.

“All eyes are on CPI and PPI inflation data as markets hope to solidify another 25 bps rate cut,” The Kobeissi Letter said.

BTC Price Performance
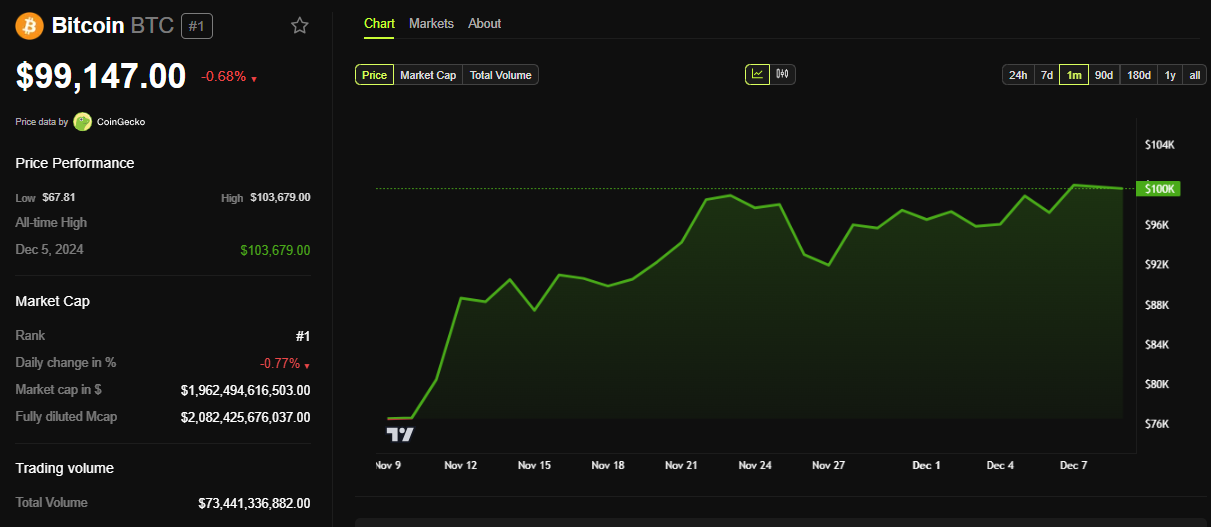
BTC Price Performance. Source: BeInCrypto

Meanwhile, BeInCrypto data shows that markets are down today, with Bitcoin trading for $99,147 as of this writing, a 0.68% decline.

Disclaimer: For information purposes only. Past performance is not indicative of future results.
placeholder
Gold Price Forecast: XAU/USD drifts higher above $4,200 as Fed delivers expected cutGold price (XAU/USD) gains momentum to around $4,235 during the early Asian session on Thursday. The precious metal extends its upside after the US Federal Reserve (Fed) delivered an expected third consecutive interest rate cut and maintained its outlook for just one cut in 2026.
Author  FXStreet
Dec 11, Thu
Gold price (XAU/USD) gains momentum to around $4,235 during the early Asian session on Thursday. The precious metal extends its upside after the US Federal Reserve (Fed) delivered an expected third consecutive interest rate cut and maintained its outlook for just one cut in 2026.
placeholder
Ethereum Price Slips Lower — $3,000 Looms as the Key BattlegroundEthereum is attempting to recover from a $3,026 low but remains below $3,200 and the 100-hour SMA, with a bearish trend line near $3,175 capping rebounds as bulls need a clean break above $3,200 to target $3,250–$3,400, while a drop below $3,050 risks a retest of $3,000 and $2,940.
Author  Mitrade
Dec 15, Mon
Ethereum is attempting to recover from a $3,026 low but remains below $3,200 and the 100-hour SMA, with a bearish trend line near $3,175 capping rebounds as bulls need a clean break above $3,200 to target $3,250–$3,400, while a drop below $3,050 risks a retest of $3,000 and $2,940.
placeholder
Bitcoin Slides 5% as Sellers Lean In — Can BTC Reclaim $88,000?Bitcoin has dropped back below $88,000 after rolling over from $90,500, with price still trading under the 100-hour Simple Moving Average. The sell-off found a floor at $85,151, and BTC is now consolidating near that base, but rebounds are facing pressure from a bearish trend line around $89,000. Bulls need to retake $88,000–$89,000 to ease downside risk; failure to do so keeps $85,500–$85,000 and then $83,500 in play, with $80,000 as the deeper “line in the sand.” Bitcoin (BTC) is back in damage-control mode after a sharp pullback wiped out recent gains. The price failed to reclaim the $90,000–$90,500 band, rolled over, and slid through $88,500 before briefly dipping under $87,000. Buyers did show up around $85,000, but the rebound so far looks more like stabilization than a clear trend reversal. Bitcoin dips hard, finds a bid near $85,000(h3) BTC’s latest move lower began when it couldn’t build follow-through above $90,000 and $90,500. Once that upside stalled, sellers took control and pushed price down through $88,500. The slide accelerated enough to spike below $87,000, but the market didn’t free-fall. Bulls defended the $85,000 zone, printing a low at $85,151. Since then, Bitcoin has been consolidating below the 23.6% Fibonacci retracement of the drop from the $93,560 swing high to the $85,151 low — a clue that the bounce is still shallow and that sellers haven’t fully backed off yet. Structurally, BTC is still on the back foot: It’s trading below $88,000, and It remains below the 100-hour Simple Moving Average, keeping short-term trend pressure pointed downward. Resistance is layered, and $89,000 is the problem area(h3) If bulls try to turn this into a recovery, they’ll have to climb through multiple ceilings in quick succession. First, BTC faces resistance around $87,150, followed by a more meaningful barrier near $87,500. From there, the market’s attention snaps back to $88,000 — the level BTC just lost and now needs to reclaim. A close back above $88,000 would improve the tone, but it doesn’t solve the bigger issue: there’s a bearish trend line on the hourly BTC/USD chart (Kraken feed) with resistance near $89,000, which also lines up with the next technical hurdle. If BTC can push through $89,000 and hold, the rebound could extend toward $90,000, with follow-through targets at $91,000 and $91,500. But until price clears that $88,000–$89,000 zone, rallies are at risk of being sold rather than chased. If BTC fails to reclaim resistance, the downside path is clear(h3) The near-term bear case is simple: if Bitcoin can’t climb back above the $87,000 area and keep traction, sellers may attempt another leg lower. Support levels line up like this: Immediate support: $85,500 First major support: $85,000 Next support: $83,500 Then $82,500 in the near term Below that, the major “don’t break this” level is still $80,000. If BTC slips under $80,000, the risk of acceleration to the downside increases significantly — not because it’s magic, but because it’s the kind of psychological and structural level that tends to trigger forced de-risking. Indicators: momentum still leans bearish(h3) The intraday indicators aren’t offering much comfort yet: Hourly MACD is losing pace in the bearish zone. Hourly RSI remains below 50, suggesting sellers still have the upper hand on short timeframes. So while the $85,000 defense held for now, the market hasn’t flipped bullish — it’s just stopped bleeding.
Author  Mitrade
Dec 16, Tue
Bitcoin has dropped back below $88,000 after rolling over from $90,500, with price still trading under the 100-hour Simple Moving Average. The sell-off found a floor at $85,151, and BTC is now consolidating near that base, but rebounds are facing pressure from a bearish trend line around $89,000. Bulls need to retake $88,000–$89,000 to ease downside risk; failure to do so keeps $85,500–$85,000 and then $83,500 in play, with $80,000 as the deeper “line in the sand.” Bitcoin (BTC) is back in damage-control mode after a sharp pullback wiped out recent gains. The price failed to reclaim the $90,000–$90,500 band, rolled over, and slid through $88,500 before briefly dipping under $87,000. Buyers did show up around $85,000, but the rebound so far looks more like stabilization than a clear trend reversal. Bitcoin dips hard, finds a bid near $85,000(h3) BTC’s latest move lower began when it couldn’t build follow-through above $90,000 and $90,500. Once that upside stalled, sellers took control and pushed price down through $88,500. The slide accelerated enough to spike below $87,000, but the market didn’t free-fall. Bulls defended the $85,000 zone, printing a low at $85,151. Since then, Bitcoin has been consolidating below the 23.6% Fibonacci retracement of the drop from the $93,560 swing high to the $85,151 low — a clue that the bounce is still shallow and that sellers haven’t fully backed off yet. Structurally, BTC is still on the back foot: It’s trading below $88,000, and It remains below the 100-hour Simple Moving Average, keeping short-term trend pressure pointed downward. Resistance is layered, and $89,000 is the problem area(h3) If bulls try to turn this into a recovery, they’ll have to climb through multiple ceilings in quick succession. First, BTC faces resistance around $87,150, followed by a more meaningful barrier near $87,500. From there, the market’s attention snaps back to $88,000 — the level BTC just lost and now needs to reclaim. A close back above $88,000 would improve the tone, but it doesn’t solve the bigger issue: there’s a bearish trend line on the hourly BTC/USD chart (Kraken feed) with resistance near $89,000, which also lines up with the next technical hurdle. If BTC can push through $89,000 and hold, the rebound could extend toward $90,000, with follow-through targets at $91,000 and $91,500. But until price clears that $88,000–$89,000 zone, rallies are at risk of being sold rather than chased. If BTC fails to reclaim resistance, the downside path is clear(h3) The near-term bear case is simple: if Bitcoin can’t climb back above the $87,000 area and keep traction, sellers may attempt another leg lower. Support levels line up like this: Immediate support: $85,500 First major support: $85,000 Next support: $83,500 Then $82,500 in the near term Below that, the major “don’t break this” level is still $80,000. If BTC slips under $80,000, the risk of acceleration to the downside increases significantly — not because it’s magic, but because it’s the kind of psychological and structural level that tends to trigger forced de-risking. Indicators: momentum still leans bearish(h3) The intraday indicators aren’t offering much comfort yet: Hourly MACD is losing pace in the bearish zone. Hourly RSI remains below 50, suggesting sellers still have the upper hand on short timeframes. So while the $85,000 defense held for now, the market hasn’t flipped bullish — it’s just stopped bleeding.
placeholder
December Santa Claus Rally: New highs in sight for US and European stocks?Historical data show a rising trend of US and European stocks in December. If the momentum is strong, fund managers may rush in with a buying frenzy.
Author  Mitrade
Yesterday 02: 50
Historical data show a rising trend of US and European stocks in December. If the momentum is strong, fund managers may rush in with a buying frenzy.
placeholder
XRP’s Price Action Flashes a Warning Even as ETF Flows Stay PositiveXRP’s structure remains weak despite 18 straight positive closes in spot XRP ETFs, with analysts warning that $1.98 and other nearby resistance zones could cap rebounds unless the YO region is reclaimed, while deeper downside scenarios keep $1.53 on watch as a potential (not guaranteed) accumulation area.
Author  Mitrade
Yesterday 06: 37
XRP’s structure remains weak despite 18 straight positive closes in spot XRP ETFs, with analysts warning that $1.98 and other nearby resistance zones could cap rebounds unless the YO region is reclaimed, while deeper downside scenarios keep $1.53 on watch as a potential (not guaranteed) accumulation area.
goTop
quote