

Ethereum Crosses $3,800: Is The ‘God Candle’ Nearing? Analysts Weigh In

Source Newsbtc

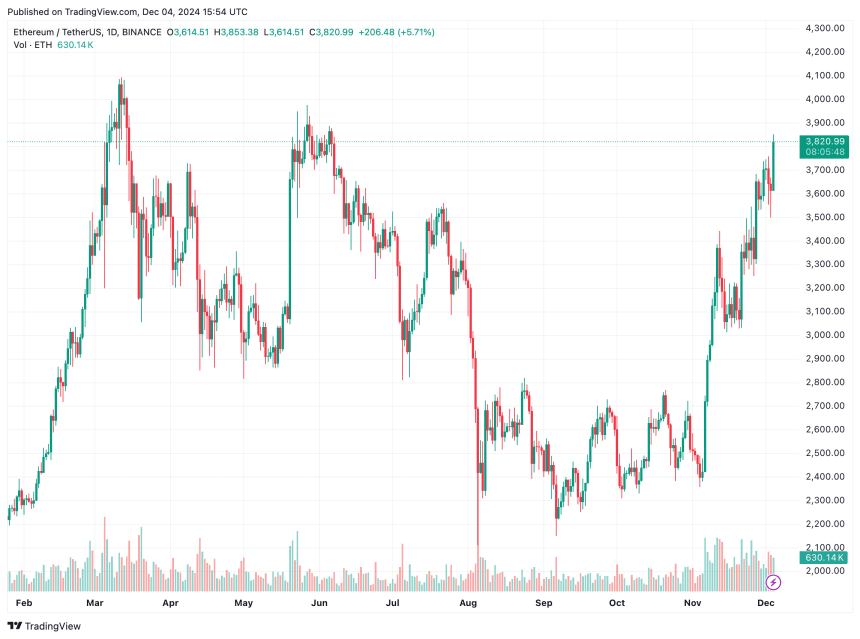
Ethereum (ETH) appears to be finally waking up from its slumber as the second-largest cryptocurrency by market cap has jumped 8% in the past 24 hours, surpassing the key $3,800 price level. 

Is An ETH God Candle On The Horizon?

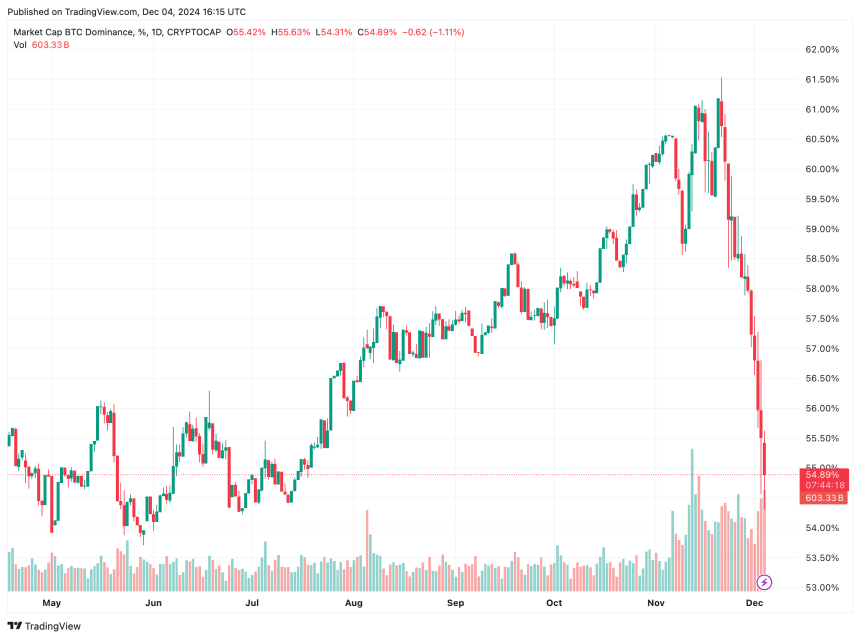
Ethereum’s rise appears to align with declining Bitcoin (BTC) dominance. This important metric is tracked to gauge the proportion of the total crypto market cap commanded by the top cryptocurrency. 

According to the chart below, BTC dominance has been falling dramatically over the past two weeks – sliding from 61.1% on November 20 to 54.9% at the time of writing. As previously reported, trading firm QCP Capital highlighted BTC dominance sliding below 58% as a key condition that could signal the onset of the altcoin season.
btc dominance

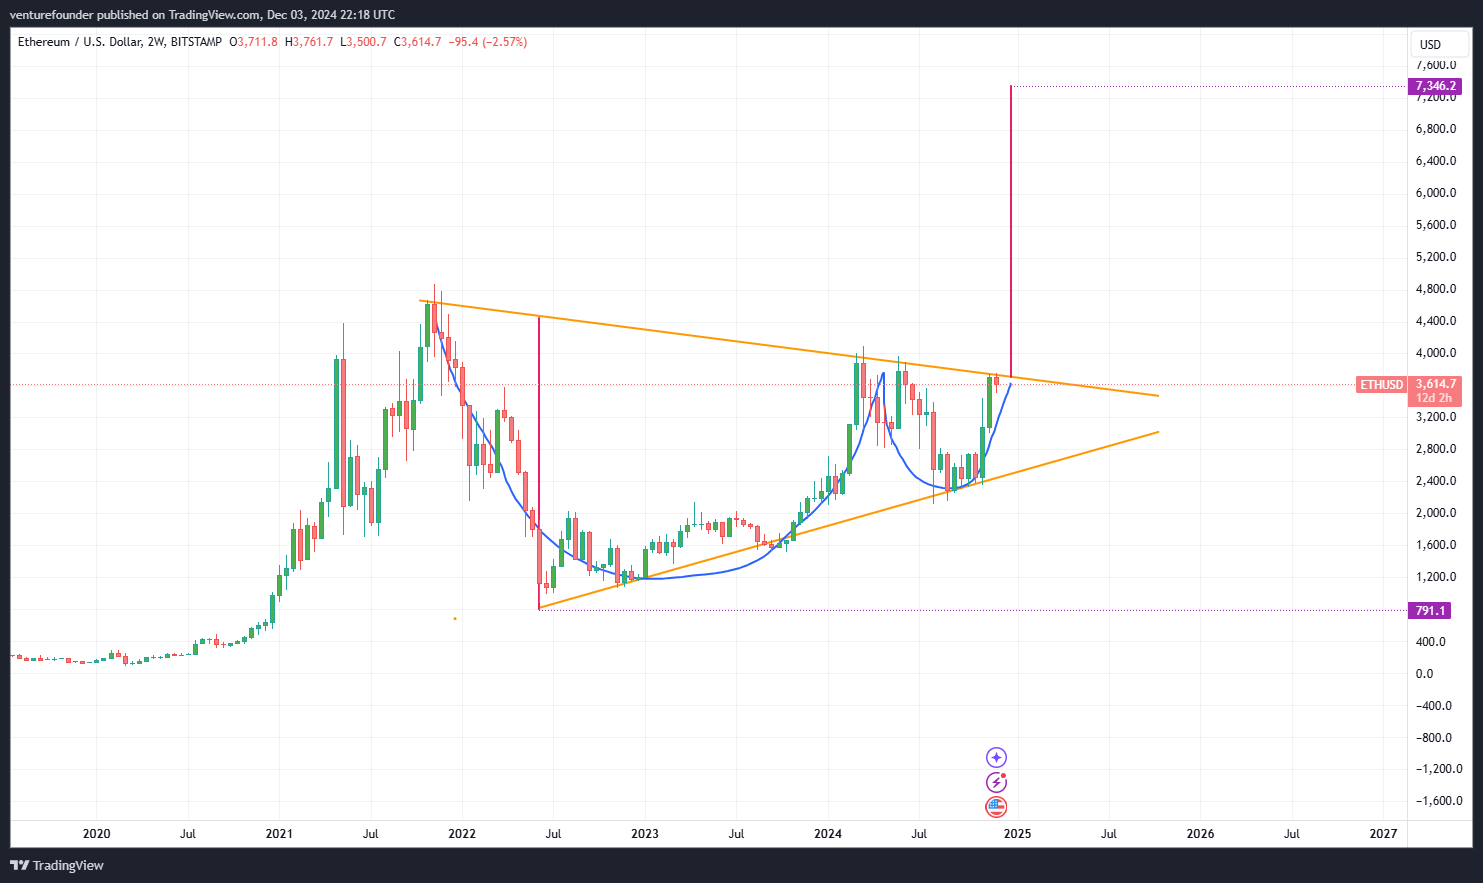
With ETH now surpassing the $3,800 level, analysts are weighing in on how far the digital asset can rally. Crypto analyst @venturefounder shared his target for ETH on X, pointing to a prolonged cup-and-handle pattern forming for ETH since November 2021. He noted that if ETH decisively breaks $3,800, it could climb as high as $7,346.
ETH cup and handle

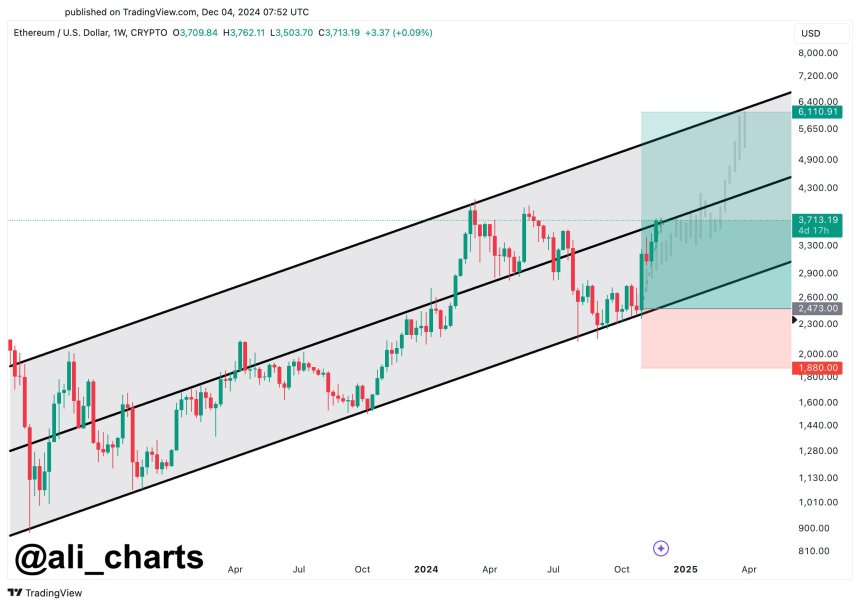
Similarly, crypto analyst Ali Martinez shared his insights on ETH’s recent price action. Martinez emphasized that the $3,300 support level could be a ‘potential buying opportunity’ should the digital asset pullback from its recent surge. 
eth pullback

Martinez added that his mid-term target for ETH remains $6,000, while the long-term target is $10,000. The analyst also highlighted the Ethereum network’s steady growth over the past month, with more than 134,000 new Ethereum addresses added daily.

Another crypto enthusiast, @MisterSpread noted that if ETH breaks the $4,000 area, there is a “high chance we see a God candle to $5,000.” Indeed, ETH breaking out of a three-year long downtrend and attempting to establish a new all-time high (ATH) has piqued the attention of the entire crypto industry.

Ethereum Fundamentals Continue Getting Stronger

Although BTC has led much of the current crypto rally, experts believe Ethereum might be the time to shine due to the multiple positive developments in the top smart contract platform. For instance, Ethereum exchange-traded funds (ETF) are finally attracting large daily inflows, rivaling BTC ETFs consistently. 

Further, several proposed network upgrades – including the Ethereum Improvement Proposal-7781 and the possibility of reduction in the amount of ETH required to participate in network staking could serve as catalysts for ETH to hit a new ATH.

That said, concerns remain about ETH’s ‘ultrasound money’ narrative due to the inflation surge witnessed in the cryptocurrency’s issuance rate. ETH trades at $3,820 at press time, up 8 % in the past 24 hours.
ethereum
Disclaimer: For information purposes only. Past performance is not indicative of future results.
placeholder
US August CPI lands tonight: after a 5.4% PPI shock, will the Fed hike on September 16?US August PPI came in at 5.4% year-on-year, above the 5.3% consensus, with core PPI at 4.6%. Traders have pushed the odds of a 25bp Fed hike on September 15-16 to around 70%. Tonight's CPI is the last major inflation print before the decision — here is the full calendar, the consensus numbers, and what a hot versus cool reading would mean for the dollar, yields, gold and stocks.
Author  Irene Q.
Sep 11, Fri
US August PPI came in at 5.4% year-on-year, above the 5.3% consensus, with core PPI at 4.6%. Traders have pushed the odds of a 25bp Fed hike on September 15-16 to around 70%. Tonight's CPI is the last major inflation print before the decision — here is the full calendar, the consensus numbers, and what a hot versus cool reading would mean for the dollar, yields, gold and stocks.
placeholder
Brent tests $108 as a key export pipeline stays shut — can the rally clear $110?Brent crude rose 2.55% to $106.97 and WTI 2.32% to $102.30 as a major regional export pipeline remained offline with no restart timeline. Front-month backwardation has widened to $5.53 from $3.84 a week ago, European gas is at its highest since December 2022, and one analyst sees $119.48 if talks stall.
Author  Irene Q.
Sep 14, Mon
Brent crude rose 2.55% to $106.97 and WTI 2.32% to $102.30 as a major regional export pipeline remained offline with no restart timeline. Front-month backwardation has widened to $5.53 from $3.84 a week ago, European gas is at its highest since December 2022, and one analyst sees $119.48 if talks stall.
placeholder
Fed hike odds near 90% into Wednesday's decision — how to trade the dollar, gold and the S&P 500A 0.3% monthly core CPI print has lifted the market-implied probability of a 25bp Fed hike on 16 September to roughly 86.5% ~ 90%, which would be the first increase since July 2023. Here is the decision timeline, the pricing versus the forecasts, both scenarios, and the key levels for the dollar, gold and the S&P 500.
Author  Suzie
Sep 14, Mon
A 0.3% monthly core CPI print has lifted the market-implied probability of a 25bp Fed hike on 16 September to roughly 86.5% ~ 90%, which would be the first increase since July 2023. Here is the decision timeline, the pricing versus the forecasts, both scenarios, and the key levels for the dollar, gold and the S&P 500.
placeholder
Gold falls below $4,300 as higher US yields bolster Fed rate hike betsGold price (XAU/USD) tumbles to near $4,295 during the early Asian session on Tuesday. The precious metal faces some selling pressure as rising bond yields and surging energy prices strengthen expectations that the US Federal Reserve (Fed) will raise interest rates this week. 
Author  FXStreet
Yesterday 01: 23
Gold price (XAU/USD) tumbles to near $4,295 during the early Asian session on Tuesday. The precious metal faces some selling pressure as rising bond yields and surging energy prices strengthen expectations that the US Federal Reserve (Fed) will raise interest rates this week. 
placeholder
【Daily Brief】10-year Treasury yield briefly tops 5%, S&P 500 slips to 7,602 and the dollar firms at 99.3 as the Fed's decision eve beginsThe 10-year Treasury yield touched 5.014% on Monday — its first print above 5% since October 2023 — while the S&P 500 closed 0.48% lower at 7,619.98 and the dollar index firmed to 99.3. Here is the full market wrap ahead of Wednesday's FOMC decision, the dot plot and the August retail sales report, plus today's CLARITY Act Senate vote.
Author  Irene Q.
23 hours ago
The 10-year Treasury yield touched 5.014% on Monday — its first print above 5% since October 2023 — while the S&P 500 closed 0.48% lower at 7,619.98 and the dollar index firmed to 99.3. Here is the full market wrap ahead of Wednesday's FOMC decision, the dot plot and the August retail sales report, plus today's CLARITY Act Senate vote.
goTop
quote