

Top 3 Price Prediction Bitcoin, Ethereum, Ripple: BTC reaches a new all-time high near $81,800
- Bitcoin's price reaches a new all-time high of $81,846 on Monday, following a rally of over 17% the previous week.
- Ethereum's price is nearing its weekly resistance at $3,236, and a firm close above it would continue its rally.
- Ripple price is approaching its daily resistance at $0.626; a close above this level could signal the continuation of its rally.
Bitcoin (BTC) reached a new all-time high of $81,846 on Monday, while Ethereum (ETH) and Ripple (XRP) are following suit and nearing their crucial resistance levels; a strong close above these levels could fuel further rally for both assets.
Bitcoin bulls eye for $83,000
Bitcoin reached an all-time high (ATH) of $81,500 on Sunday last week after rallying over 17% following Donald Trump’s decisive victory in the US presidential election. At the time of writing on Monday, it reaches a new ATH of $81,846.
If BTC continues its upward momentum, it would extend the rally to retest its 161.8% Fibonacci extension level (drawn from July’s high of $70,079 to August’s low of $49,072) at $83,062.
The Relative Strength Index (RSI) stands at 78, trading above its overbought level of 70. Traders should be cautious because the chances of a price pullback are increasing. If RSI exits overbought territory, it would give a clear selling signal. Another possibility is that the rally continues, and the RSI remains above the overbought level.
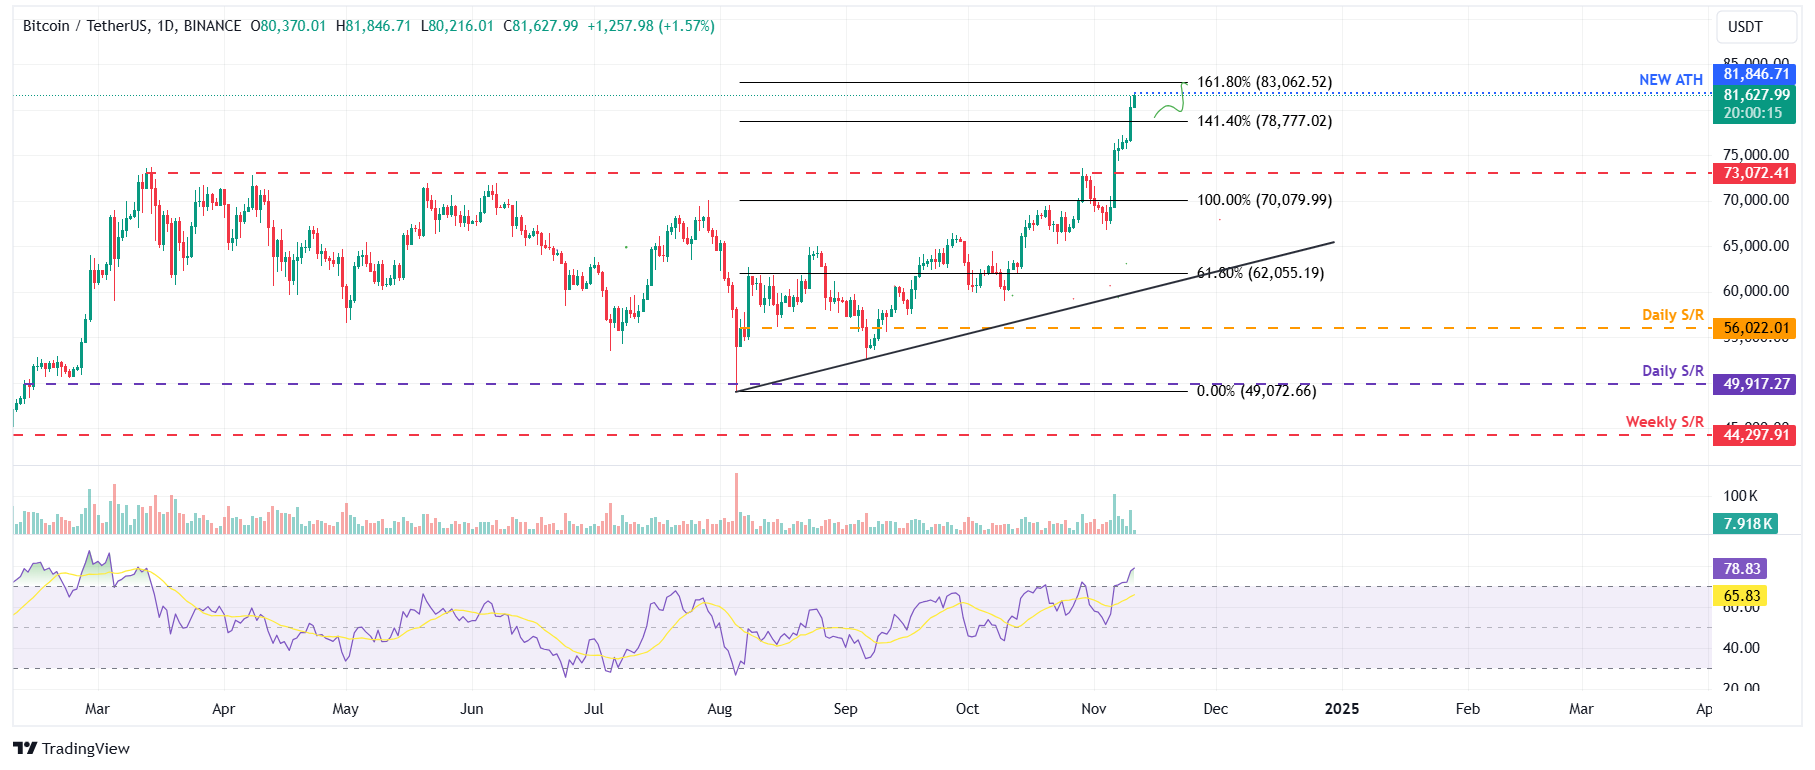
BTC/USDT daily chart
However, if BTC closes below $78,000, it could extend the decline and retest its key daily support at $73,072.
Ethereum price is poised for a rally if it closes above $3,200
Ethereum's price broke above the daily resistance level of $2,820 on Thursday and rallied over 7.7% until Sunday, retesting its weekly resistance at $3,236. At the time of writing on Monday, it trades slightly below $3,182.
If ETH closes above the weekly resistance at $3,236, it would extend the rally by 9.8% to retest its July 22 high of $3,562.
The RSI stands at 75, trading above its overbought 70, like Bitcoin’s.
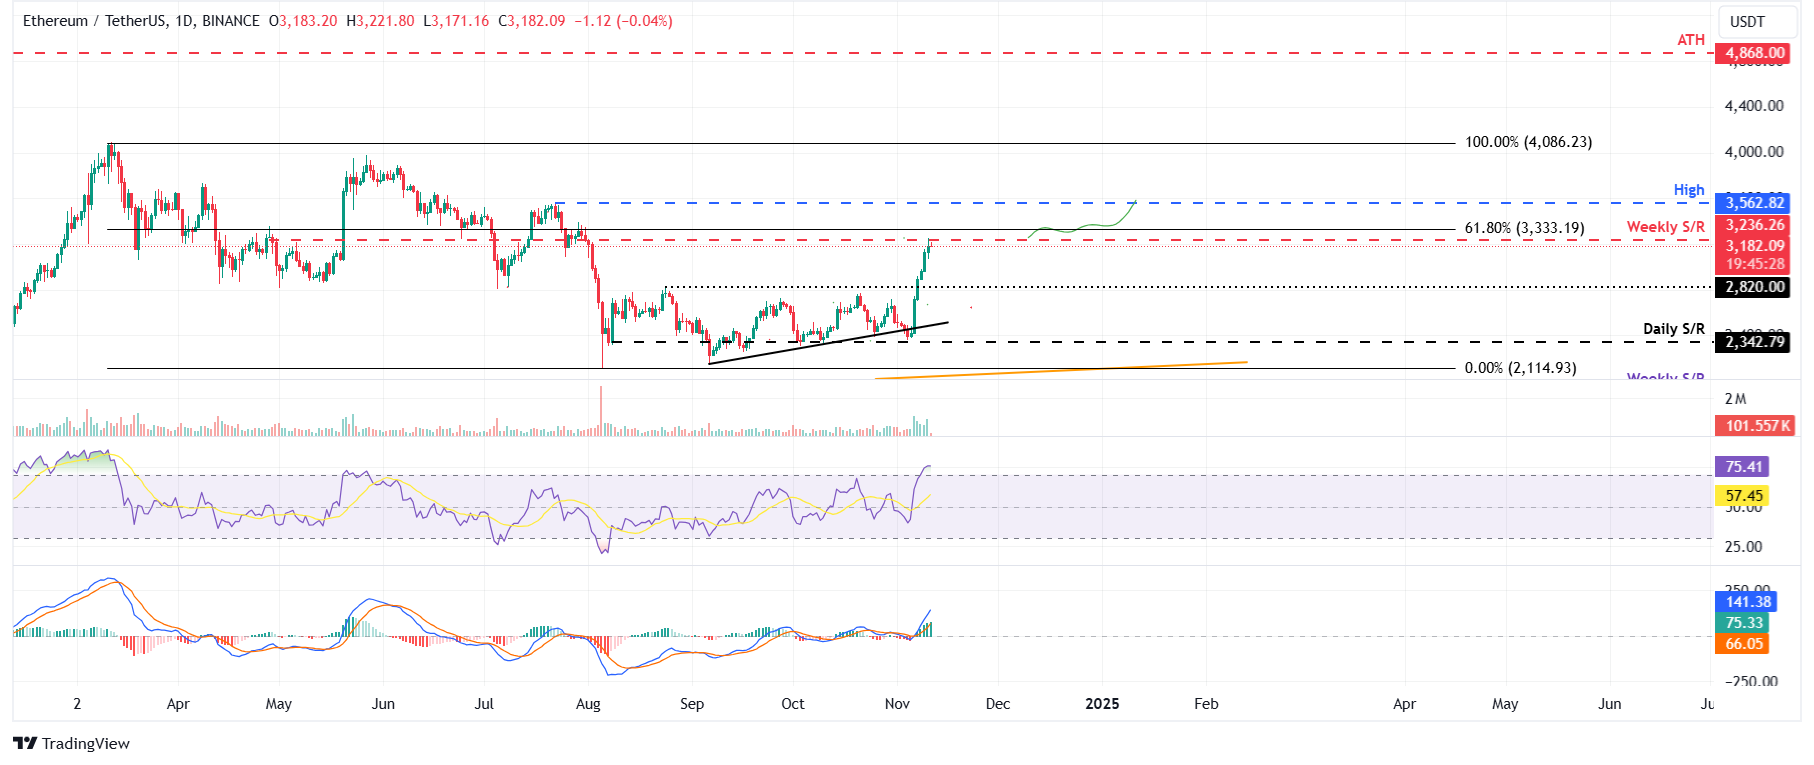
ETH/USDT daily chart
If the weekly resistance continues to hold as resistance, ETH would decline to retest its next daily support at $2,820.
Ripple price shows potential for a rally ahead
Ripple price broke above the daily resistance level at $0.544 and its 200-day Exponential Moving Average (EMA) at $0.548 on Thursday and rallied over 6.3% in three days. As of Monday, it trades slightly above around $0.595.
If XRP continues its upward momentum, it could extend the rally to retest its daily resistance at $0.626. A successful close above this level could extend an additional rally of 4% to retest its July 31 high of $0.657.
The RSI stands at 70, around its overbought level. If the RSI tilts down, traders should be cautious because the chances of a price pullback increase.
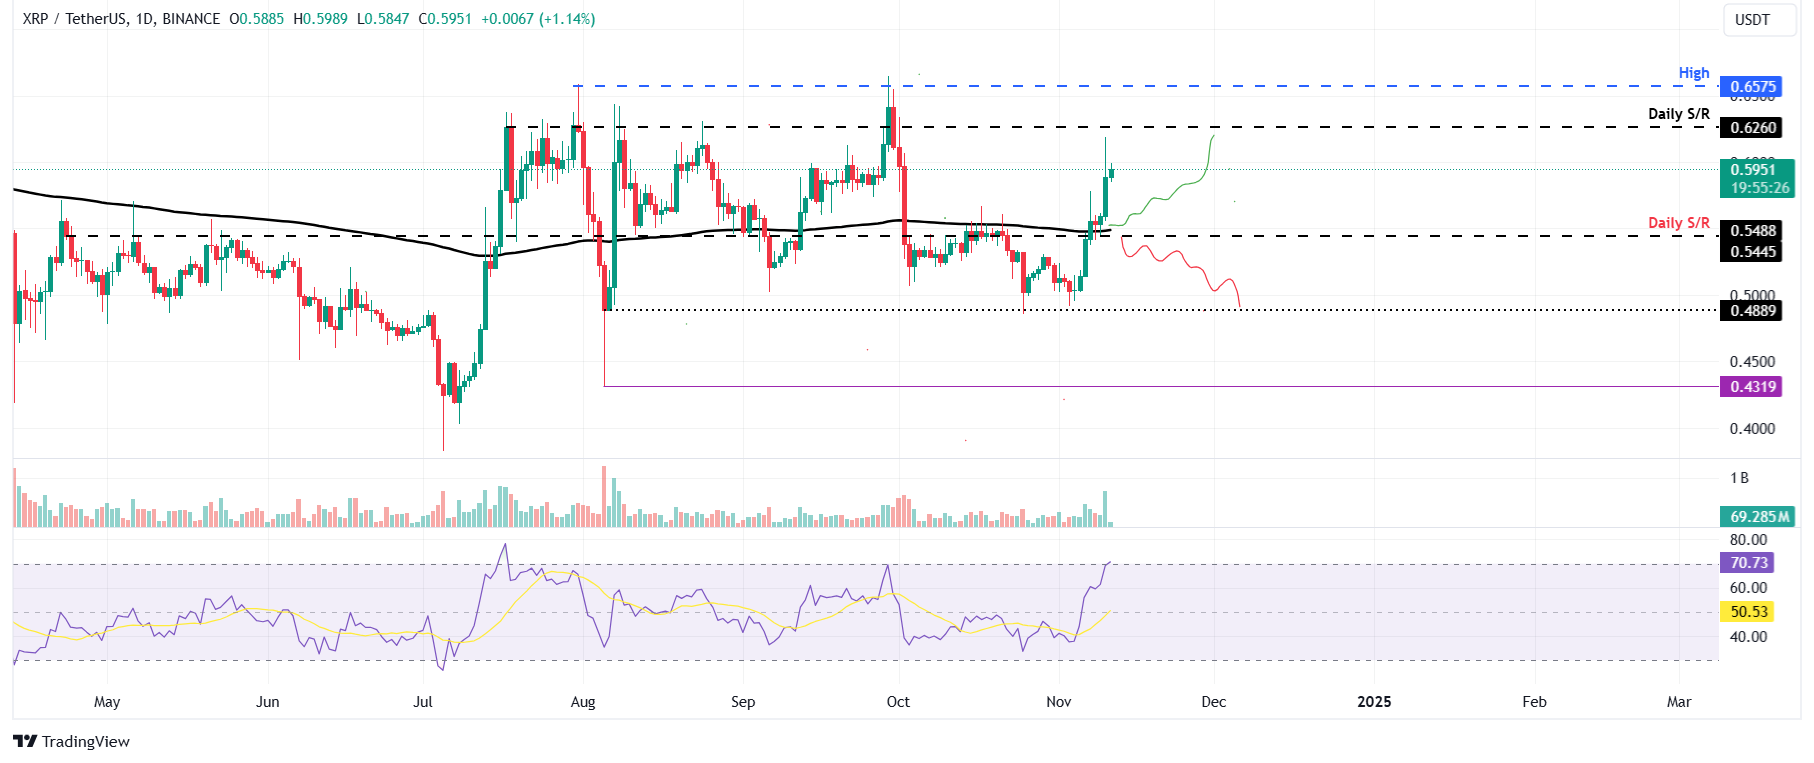
XRP/USDT daily chart
However, if the 200-day EMA at $0.548 fails, XRP could extend the decline to retest its next key support at $0.488.
Bitcoin, altcoins, stablecoins FAQs
Bitcoin is the largest cryptocurrency by market capitalization, a virtual currency designed to serve as money. This form of payment cannot be controlled by any one person, group, or entity, which eliminates the need for third-party participation during financial transactions.
Altcoins are any cryptocurrency apart from Bitcoin, but some also regard Ethereum as a non-altcoin because it is from these two cryptocurrencies that forking happens. If this is true, then Litecoin is the first altcoin, forked from the Bitcoin protocol and, therefore, an “improved” version of it.
Stablecoins are cryptocurrencies designed to have a stable price, with their value backed by a reserve of the asset it represents. To achieve this, the value of any one stablecoin is pegged to a commodity or financial instrument, such as the US Dollar (USD), with its supply regulated by an algorithm or demand. The main goal of stablecoins is to provide an on/off-ramp for investors willing to trade and invest in cryptocurrencies. Stablecoins also allow investors to store value since cryptocurrencies, in general, are subject to volatility.
Bitcoin dominance is the ratio of Bitcoin's market capitalization to the total market capitalization of all cryptocurrencies combined. It provides a clear picture of Bitcoin’s interest among investors. A high BTC dominance typically happens before and during a bull run, in which investors resort to investing in relatively stable and high market capitalization cryptocurrency like Bitcoin. A drop in BTC dominance usually means that investors are moving their capital and/or profits to altcoins in a quest for higher returns, which usually triggers an explosion of altcoin rallies.
Recommended Articles


