

Bitcoin Records Highest Growth Since January 2023 Amid ATH Surge

Source Beincrypto

Bitcoin has recently seen a remarkable uptrend, with the cryptocurrency reaching new all-time highs almost daily this week. Unlike previous peaks, this rally appears more sustainable, driven by robust market fundamentals. 

Bitcoin’s consistent growth has drawn significant attention, positioning the asset for even more potential upside.

Bitcoin Gains Strength

As per Glassnode’s analysis Bitcoin’s Realized Cap has risen by 3.8% over the past 30 days, marking one of the most substantial inflow levels seen since January 2023. This increase reflects heightened investment activity and growing confidence in the cryptocurrency’s value stability.

“The Realized Cap is currently trading at an ATH value of $656 billion, supported by a net 30-day capital inflow of $2.5 billion,” Glassnode noted.
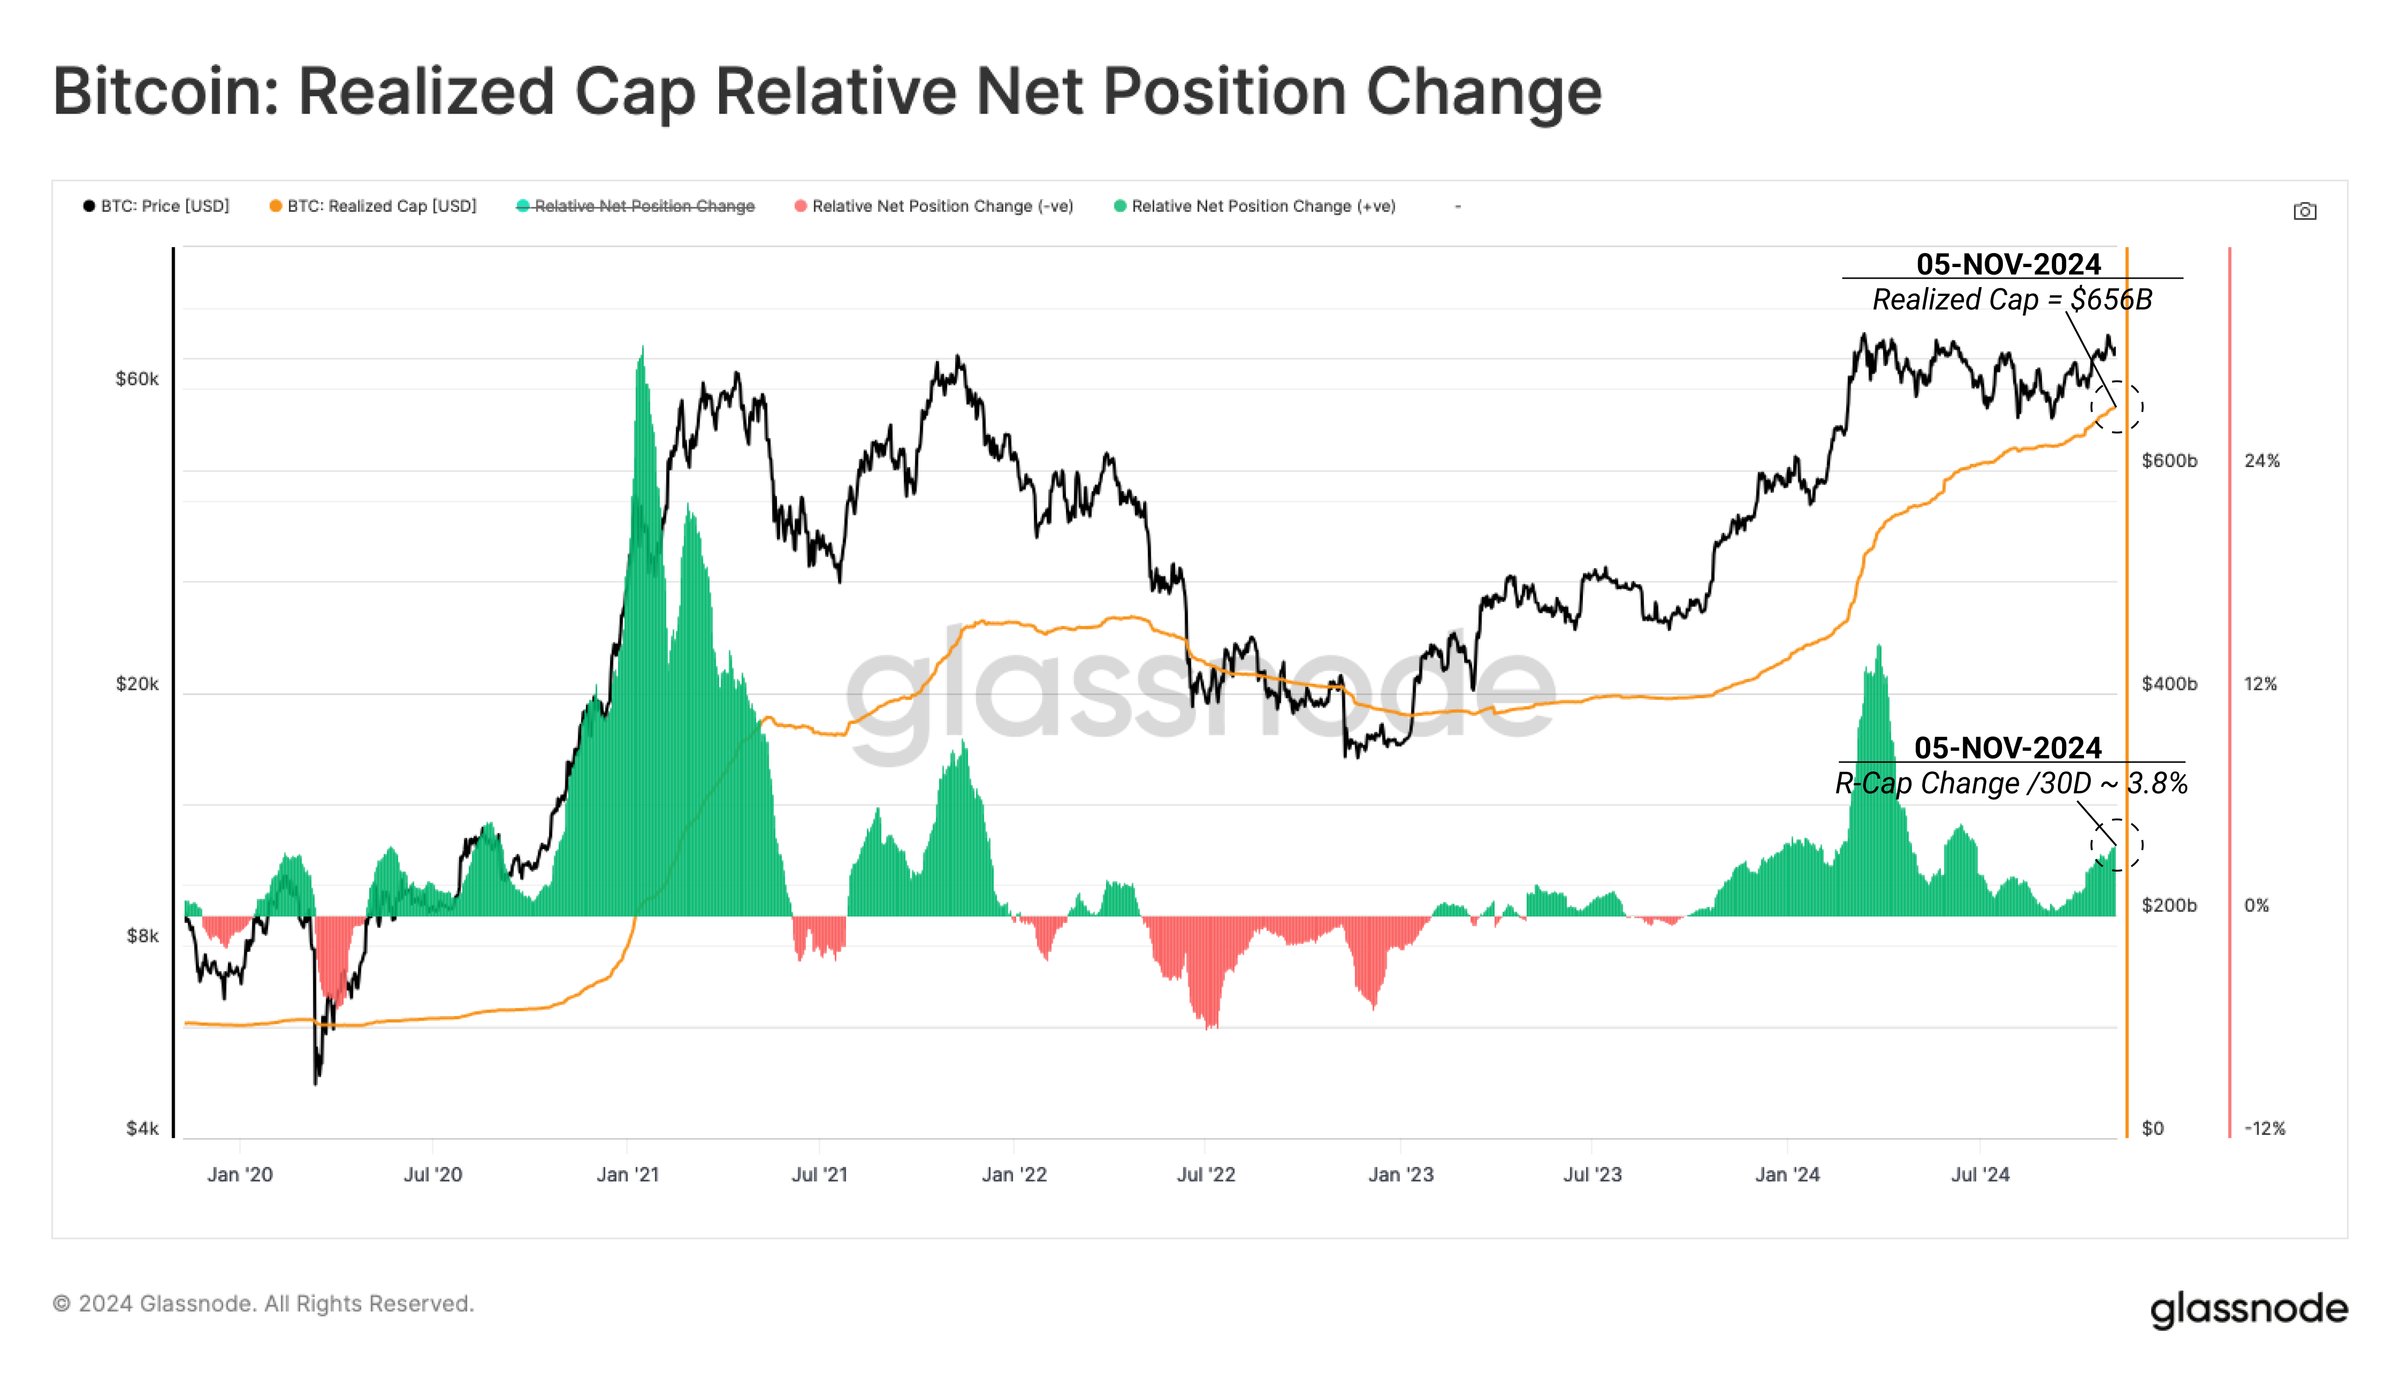
Bitcoin Realized Cap. Bitcoin Realized Cap. Source: TradingView

The macro momentum for Bitcoin is strong, supported by the NVT (Network Value to Transactions) Ratio, which currently stands at a three-month low. A lower NVT Ratio indicates that Bitcoin is not overvalued, reducing the likelihood of an immediate correction.

This undervaluation, as shown by the NVT, suggests that Bitcoin’s growth is not driven by speculative excess, as in previous rallies. With its value rooted in transactional strength, Bitcoin appears well-positioned to maintain its upward trajectory, drawing confidence from investors who view this as a more stable phase of growth.
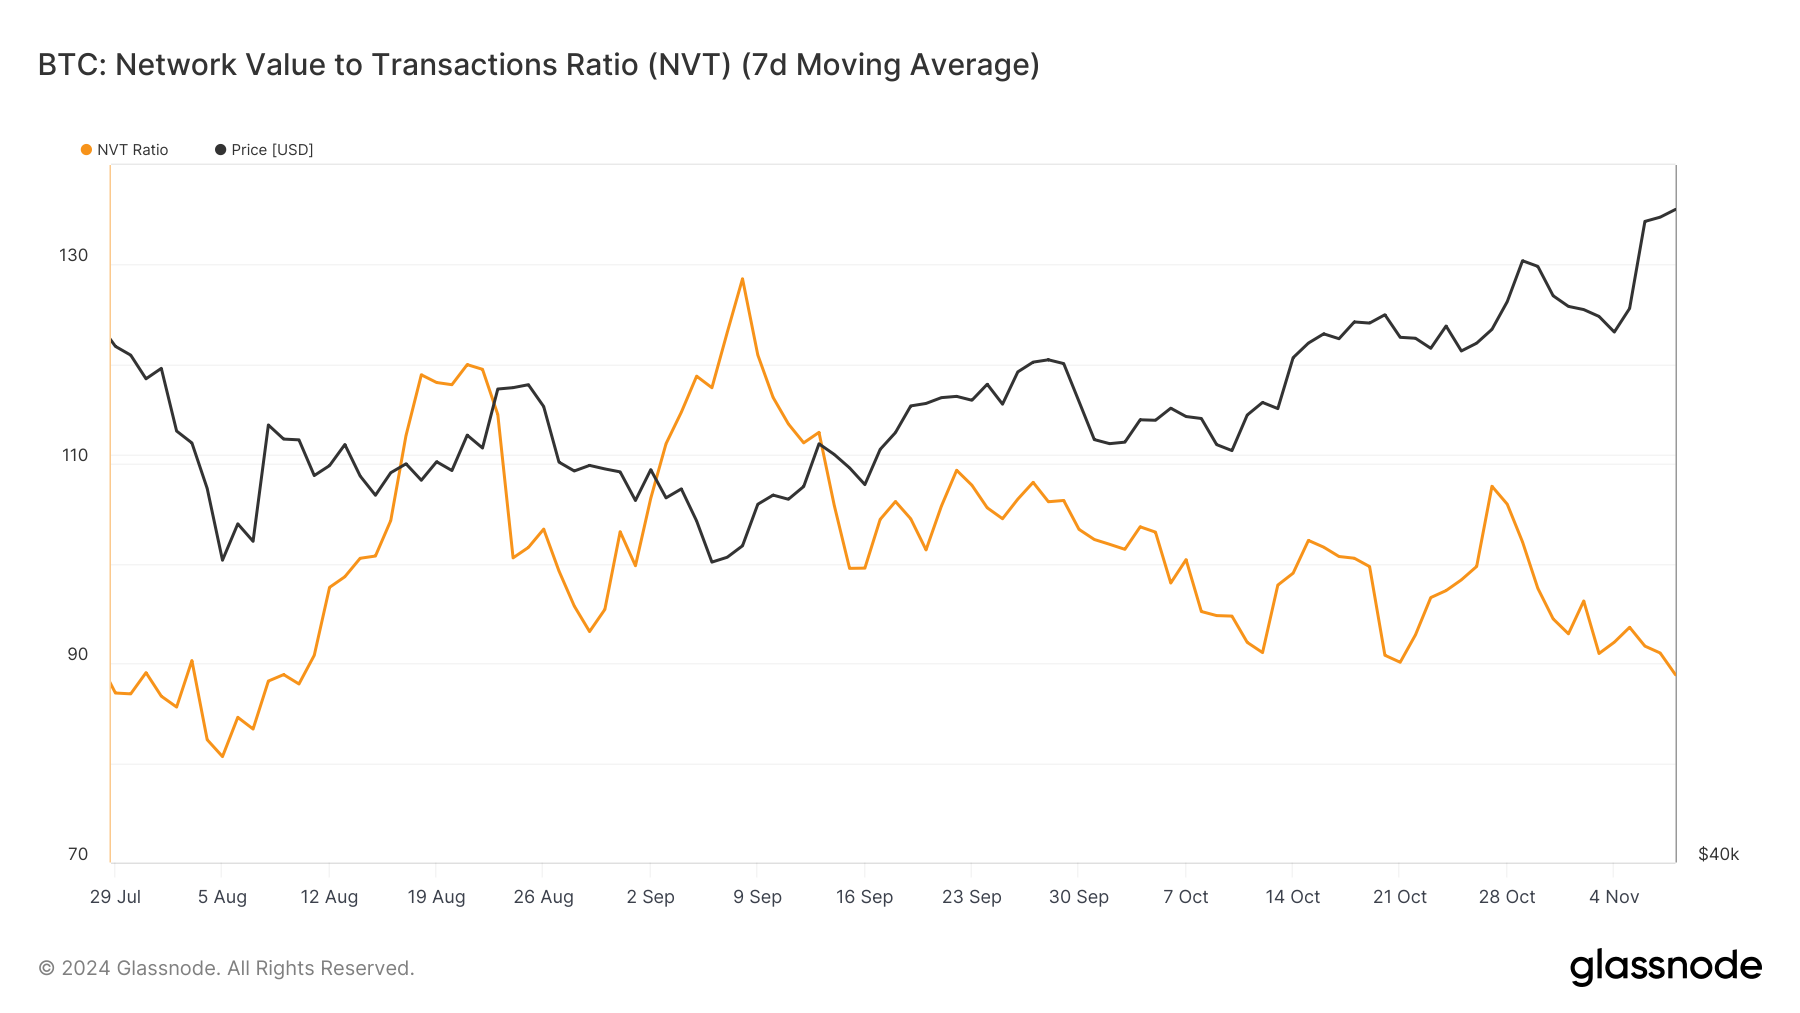
Bitcoin NVT RatioBitcoin NVT Ratio. Source: TradingView

ETH Price Prediction: ATHs Continue

At the time of writing, Bitcoin is trading at $76,443 after achieving a new all-time high of $77,175 during intra-day trading on Friday. This continued rise reflects Bitcoin’s strength in the face of broader economic shifts and confirms strong buyer interest.

While Bitcoin is on the verge of crossing $80,000, it may see a slight dip to test support around $73,773. This pullback would allow BTC to consolidate before resuming its uptrend, maintaining healthy growth without triggering overbought conditions.
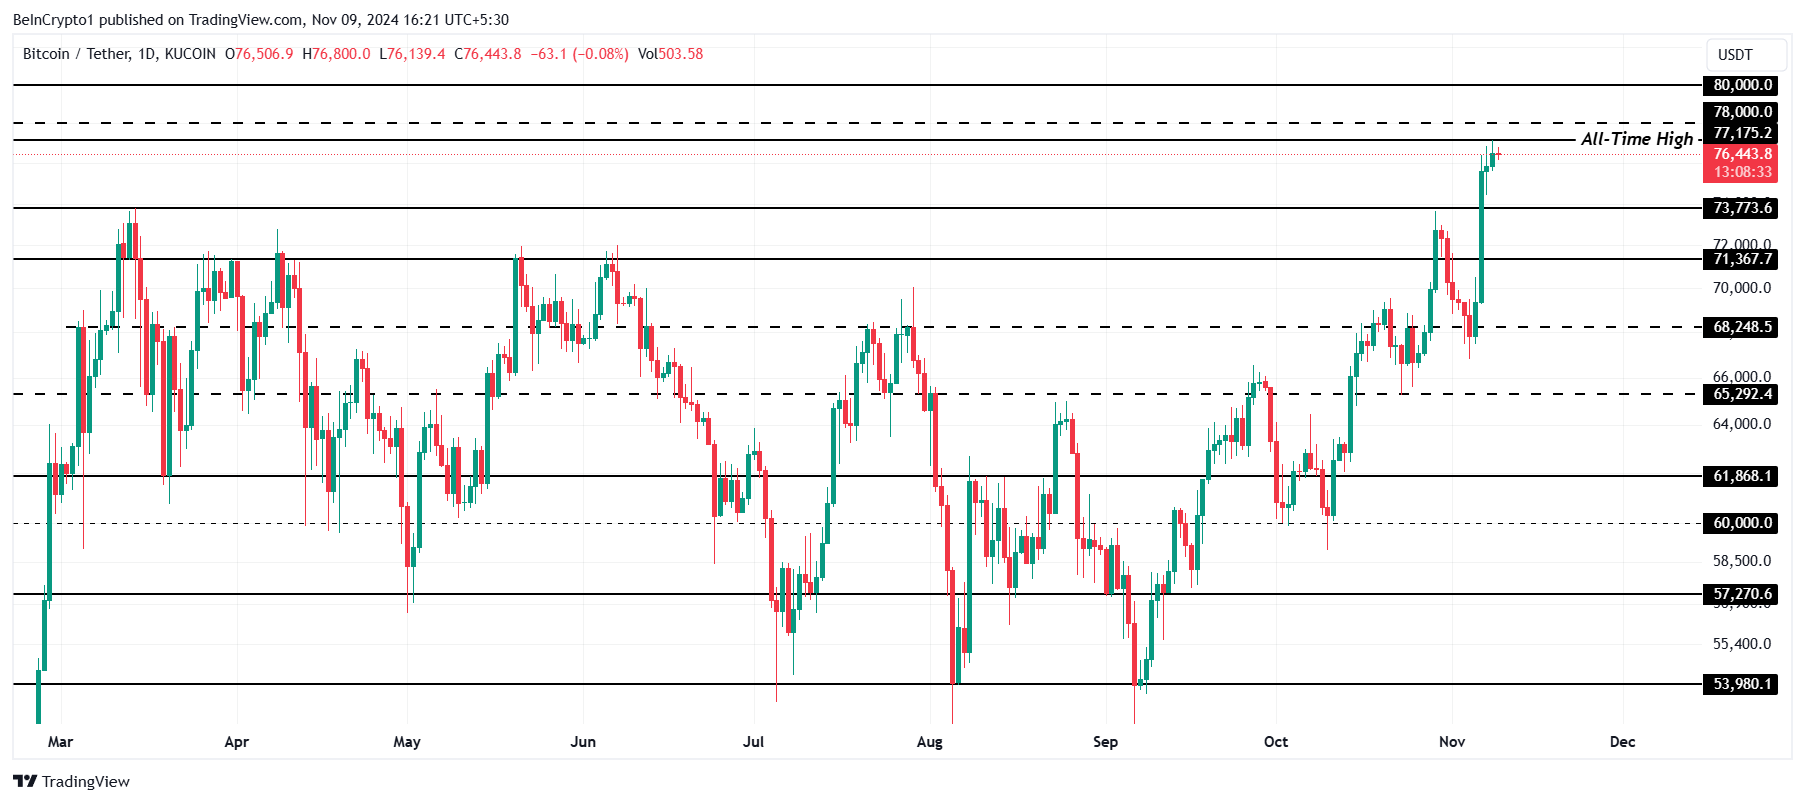
Bitcoin Price Analysis. Bitcoin Price Analysis. Source: TradingView

If, however, Bitcoin fails to rebound from this level and investors begin profit-taking, the price could dip further. A fall below $73,773 might lead to a decline to $71,367, which would challenge the current bullish outlook and introduce caution for short-term traders.

Disclaimer: For information purposes only. Past performance is not indicative of future results.
placeholder
Japanese Yen rallies to February 18 high as upbeat wage data and GDP lift BoJ hike betsThe USD/JPY pair declines for the second straight day – also marking the fourth day of a fall in the previous five – and sinks to its lowest level since February 18, around mid-153.00s during the Asian session on Tuesday.
Author  FXStreet
Sep 08, Tue
The USD/JPY pair declines for the second straight day – also marking the fourth day of a fall in the previous five – and sinks to its lowest level since February 18, around mid-153.00s during the Asian session on Tuesday.
placeholder
Brent holds above $100 as tanker attacks tighten supply — but four forces are capping the rallyBrent crude is holding above $100 a barrel for a second session, its first close above the level since late July, as tanker attacks near the Strait of Hormuz squeeze an already tight physical market. Yet the rally has been gradual: 8.3 mb/d of Gulf output is still shut in, diesel is at a record, and forecasts now range from $74 to $100.
Author  Irene Q.
Sep 10, Thu
Brent crude is holding above $100 a barrel for a second session, its first close above the level since late July, as tanker attacks near the Strait of Hormuz squeeze an already tight physical market. Yet the rally has been gradual: 8.3 mb/d of Gulf output is still shut in, diesel is at a record, and forecasts now range from $74 to $100.
placeholder
US August CPI Preview: Will Inflation Reaccelerate? US Stocks, Dollar and Gold Face Key Test On Friday, September 11 (ET), the U.S. Bureau of Labor Statistics will release the Consumer Price Index (CPI) for August, the final major inflation report before the Federal Reserve's Sep
Author  TradingKey
Sep 10, Thu
On Friday, September 11 (ET), the U.S. Bureau of Labor Statistics will release the Consumer Price Index (CPI) for August, the final major inflation report before the Federal Reserve's Sep
placeholder
US August CPI lands tonight: after a 5.4% PPI shock, will the Fed hike on September 16?US August PPI came in at 5.4% year-on-year, above the 5.3% consensus, with core PPI at 4.6%. Traders have pushed the odds of a 25bp Fed hike on September 15-16 to around 70%. Tonight's CPI is the last major inflation print before the decision — here is the full calendar, the consensus numbers, and what a hot versus cool reading would mean for the dollar, yields, gold and stocks.
Author  Irene Q.
Yesterday 07: 26
US August PPI came in at 5.4% year-on-year, above the 5.3% consensus, with core PPI at 4.6%. Traders have pushed the odds of a 25bp Fed hike on September 15-16 to around 70%. Tonight's CPI is the last major inflation print before the decision — here is the full calendar, the consensus numbers, and what a hot versus cool reading would mean for the dollar, yields, gold and stocks.
placeholder
Gold Price Forecast: PPI and Oil Prices Fuel Inflation Concerns, Can CPI Change Gold's Direction?As of the Asian session on September 11, gold prices (XAUUSD) remained in weak consolidation today after dropping sharply to near $4,300 on Thursday, with the latest price trading around
Author  TradingKey
Yesterday 09: 43
As of the Asian session on September 11, gold prices (XAUUSD) remained in weak consolidation today after dropping sharply to near $4,300 on Thursday, with the latest price trading around
goTop
quote