Solana Price Forecast: SOL could break above $190 as network activity rises
Solana price today: $176
- Solana price corrects from Tuesday’s high above $183 after rallying alongside Bitcoin.
- The number of unique active wallets has doubled in the past five days, according to on-chain data.
- SOL could gain nearly 9%, breaking above the $190 level, according to technical indicators.
Solana (SOL) loses 2% on Wednesday, putting an end to a four-day rally fuelled by Bitcoin’s (BTC) sharp rise to almost a fresh all-time high. Despite the correction, the outlook for SOL remains positive, on-chain data and technical indicators show, adding to the chances that the recent uptrend could continue toward $190.
These catalysts could push Solana higher
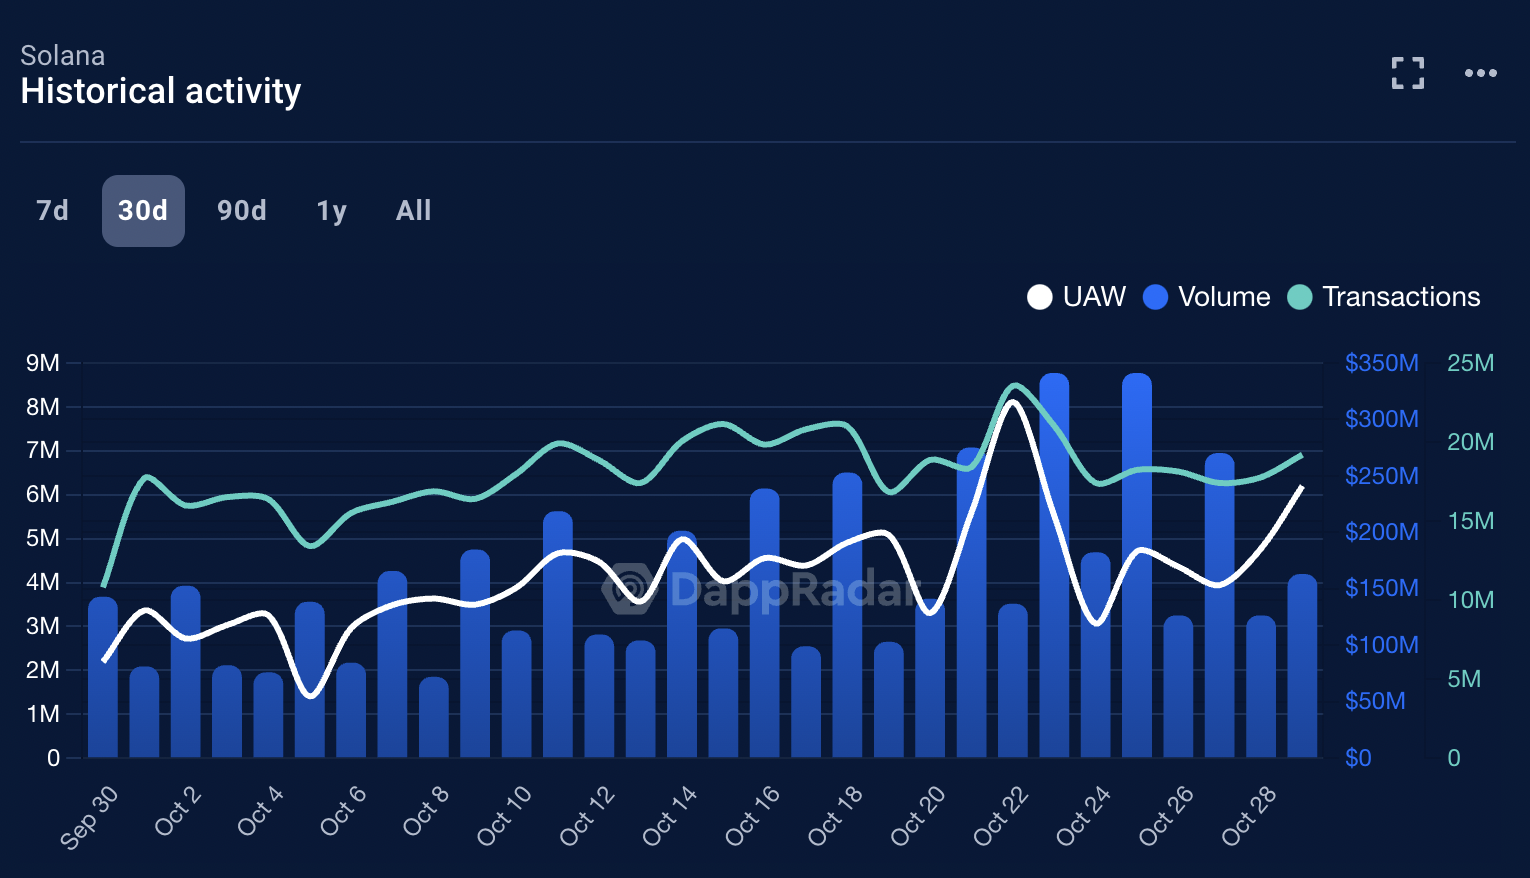
On-chain metrics such as the volume of SOL traded, the number of transactions and the number of unique active wallets (UAW) have increased in the past five days, according to data from DappRadar.
Volume climbed from $126.46 million on October 24 to $163.09 on October 29. It peaked on October 25 at $341.1 million.
As for transactions, increased from 17.4 million on October 24 to 19.2 million, while UAW more than doubled from 3.06 million to 6.19 million in the same period. Typically, an increase in active wallets within a short period of time is a sign of rising interest and demand from traders.

UAW, Volume and Transactions in the Solana network. Source: DappRadar
Solana Price Forecast: SOL could add 9% gain
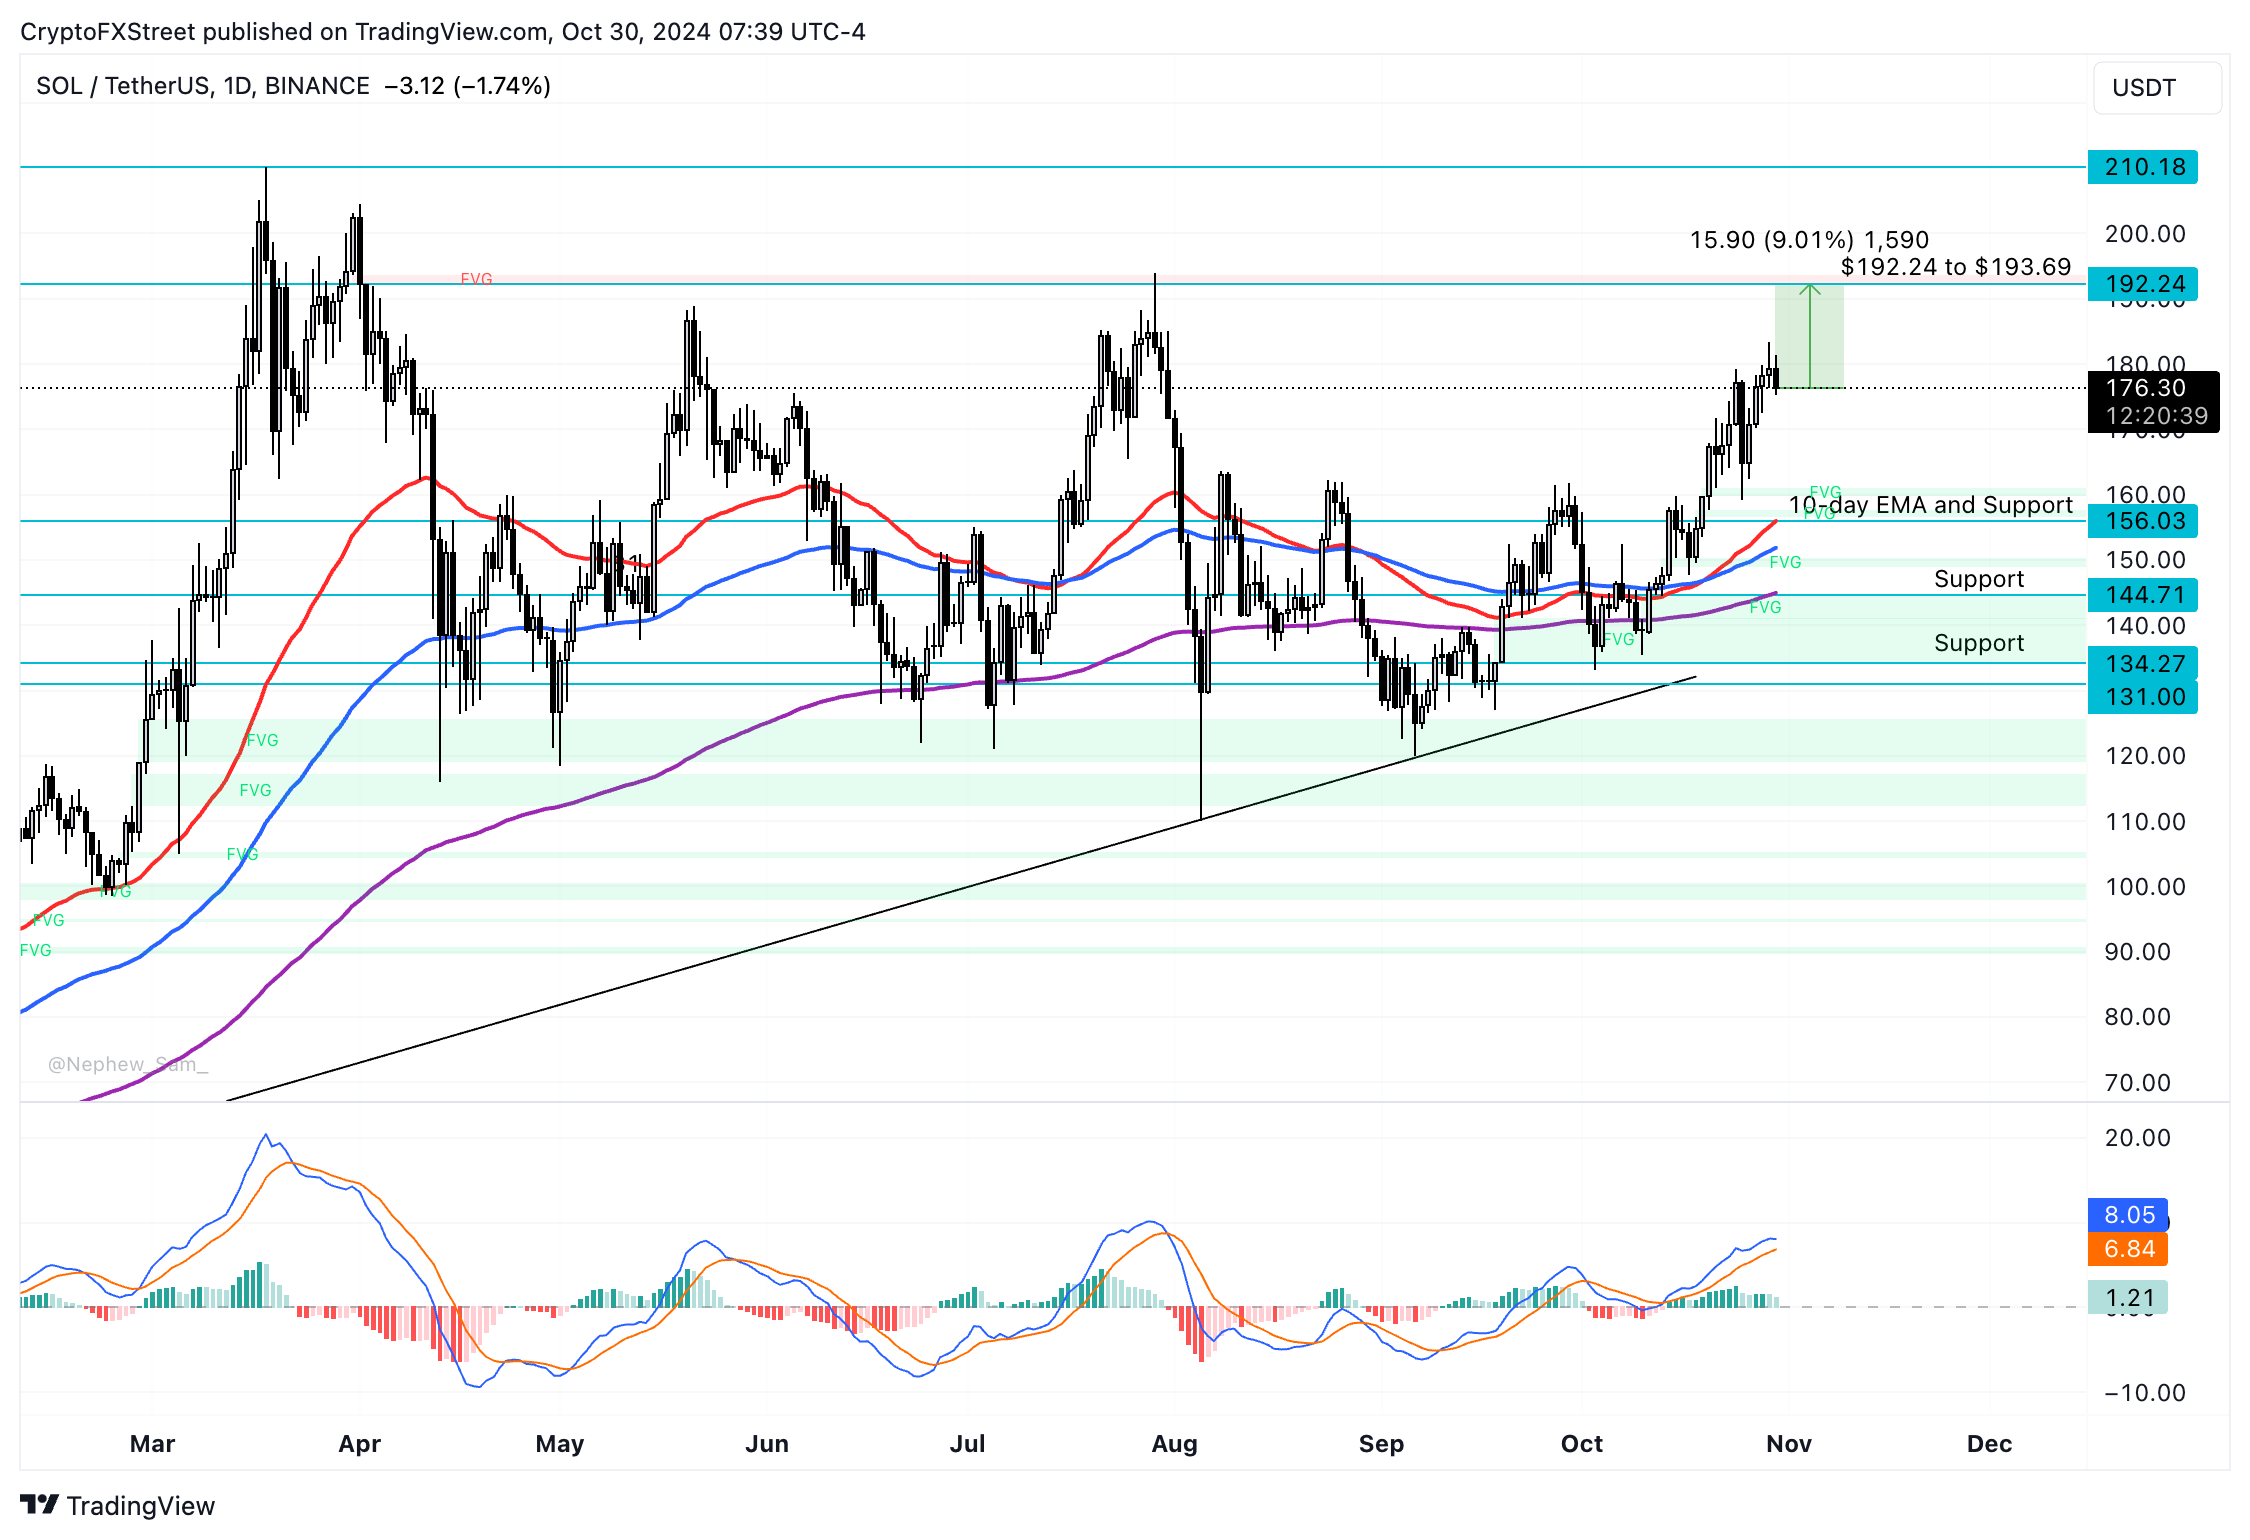
Solana price is in a clear uptrend in October. SOL climbed to a three-month high of $183.38 on Tuesday but corrected thereafter.
If the uptrend persists, SOL could target the lower boundary of the Fair Value Gap (FVG) between $193.69, a 9% increase from the current levels, and $192.24.
The Moving Average Convergence Divergence (MACD), a momentum indicator, shows green histogram bars above the neutral line. This implies that there may be positive underlying momentum in SOL price trend.
Traders need to watch this indicator closely, if the histogram bars turn red and appear under the neutral line, it could indicate a reversal in the asset’s price trend.

SOL/USDT daily chart
If the recent correction becomes a more pronounced pullback, Solana could find support at the 10-day Exponential Moving Average (EMA) at $156.03.


