


Bitcoin Price Forecast: Flirting with fresh all-time high
Bitcoin price today: $72,200
- Bitcoin is close to its all-time high, making a high of $73,620 on Tuesday and correcting slightly afterward.
- US spot Bitcoin ETFs posted $827 million in inflows on Tuesday, the third largest single-day inflow since their launch in January.
- Analysts highlight that any dip below $70,000 is likely to attract strong buying support ahead of the US presidential election.
Bitcoin (BTC) is trading slightly down around $72,200 on Wednesday, just below its all-time high after reaching $73,620 on Tuesday and correcting slightly. However, BTC is likely to hit fresh all-time highs this week, bolstered by $827 million in ETFs inflows on Tuesday – its third-largest single-day inflow since launch – and analysts suggest that any dip below $70,000 is likely to attract strong buying support ahead of the US presidential election.
Rising institutional demand drives Bitcoin prices higher
Institutional demand for Bitcoin remains strong, with Coinglass ETF data showing that US spot Exchange Traded Funds (ETFs) saw an inflow of $827 million on Tuesday, the third largest single-day inflow. If this trend continues, it could further fuel the ongoing Bitcoin price rally.

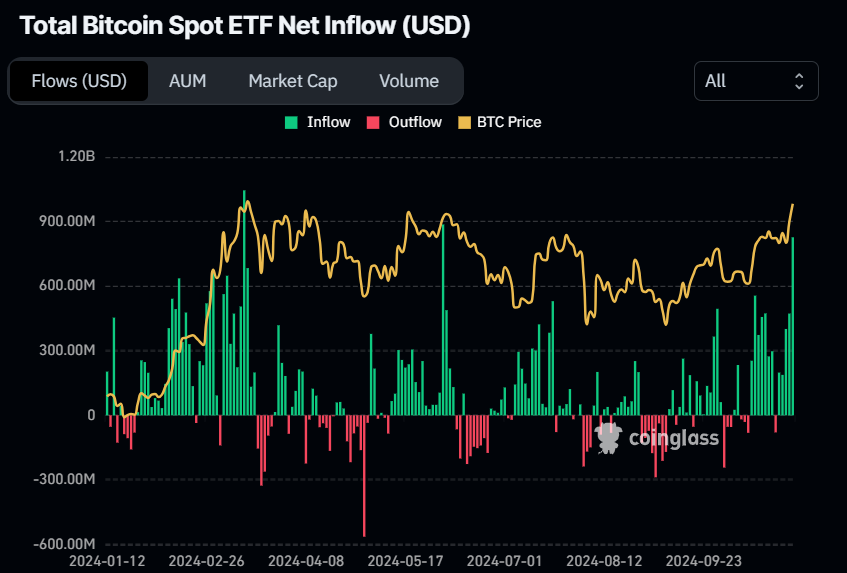
Total Bitcoin Spot ETF Net Inflow chart. Source: Coinglass
“Bitcoin price is hovering around its previous all-time high as demand from ETFs continues to accelerate,” analysts at CryptoQuant said in a report published on Tuesday. “The price of Bitcoin has rallied even as there is more supply available for ETFs to purchase on OTC desks than at the start of the year,” they said.
CryptoQuant estimates that the total amount of Bitcoin on OTC desks is around 416,000 BTC, compared to a daily balance of 183K-193K Bitcoin in Q1. Higher OTC desk balances allow ETFs to source Bitcoin without purchasing on exchanges, thus avoiding any direct effect on the price.
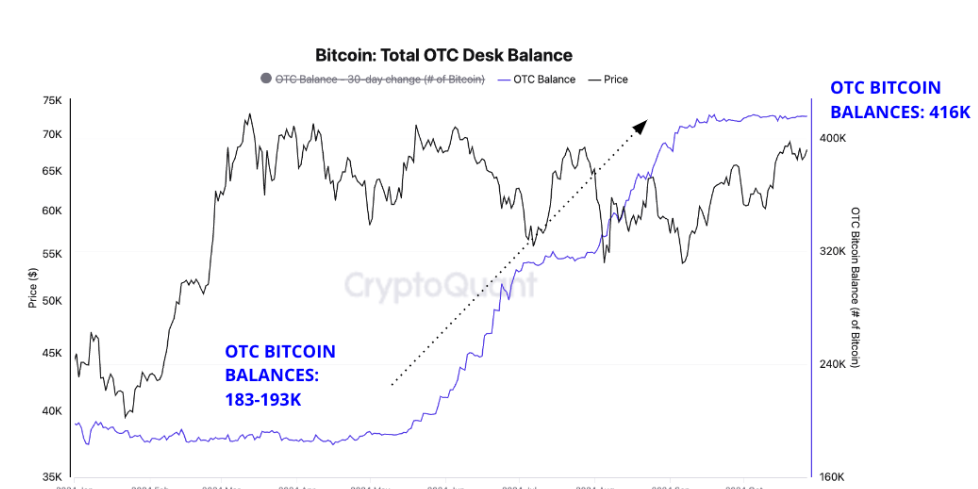
Bitcoin Total OTC Desk Balance chart. Source: CryptoQuant
Daily Bitcoin inflows to OTC desks have declined to the lowest level in 2024. So far in October, they have averaged 90K Bitcoin, down 52% from the daily average of 189K Bitcoin in the period between January and September. Lower inflows at a time when demand accelerates could reduce OTC desks’ balances, with a corresponding positive effect on the price.
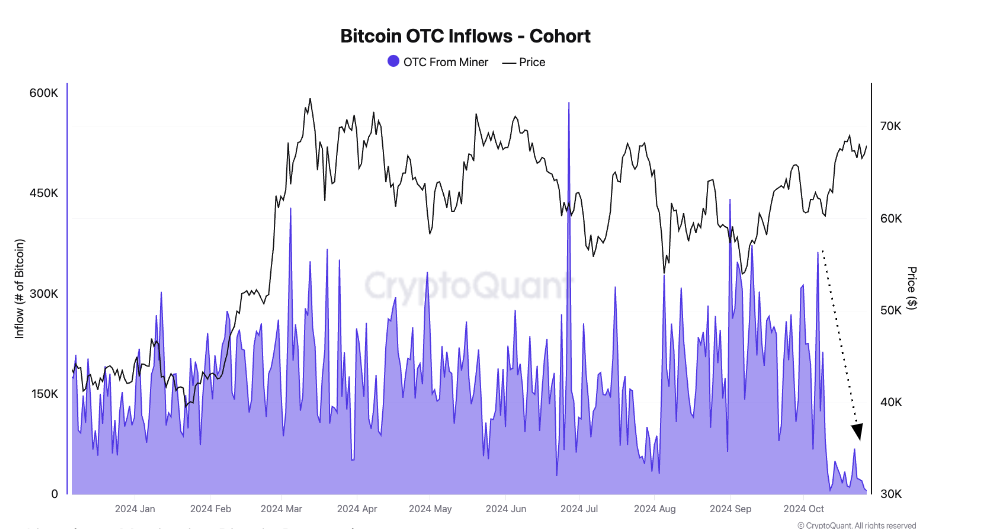
Bitcoin OTC Inflows chart. Source: Cryptoquant
BTC Holders are likely to take some profits at the peak
According to Arkham Intelligence, data on Tuesday shows crypto wallets belonging to the Government of Bhutan moved $66.55 million BTC to Binance. This move suggests a potential strategy to capitalize on its mined bitcoin for broader fiscal or operational plans amid pressures from the recent halving and fluctuating mining outputs.
Bhutan, which holds a significant Bitcoin mining operation through its national investment company, Druk Holdings and Investments, currently holds $889.36 million in Bitcoin. However, its monthly mining output has dropped from around 780 BTC to approximately 260 BTC since August, likely due to the halving and increased global hashrate.
$
— Arkham (@ArkhamIntel) October 29, 2024
Crypto wallets belonging to the Royal Government of Bhutan moved $66.55M BTC to Binance this morning. The last time they deposited to exchanges was 4 months ago, at the start of July.
The Royal Government of… pic.twitter.com/9VKamwnACZ
QCP Capital’s report on Tuesday highlights that Emory University recently invested $15 million in the Grayscale Bitcoin Mini Trust. This marks the first known university endowment dipping into digital assets, signaling growing interest from traditionally conservative funds. The Singapore-based firm also pointed out that heightened chances of a Trump win are helping both stocks and Bitcoin.
QCP sees Bitcoin poised to benefit over the medium term compared to equities.
“Any dip below 70k now is likely to attract strong buying support ahead of the election. The 8 Nov expiry at the 80K strike shows over $200 million in open interest. If BTC holds above 70K this week, we may be on the path to an all-time high—and potentially beyond,” says the report.
Bitcoin Price Forecast: Chances of break above all-time high grow
Bitcoin price found support at around $66,000 on Friday and rose 9% until Tuesday, reaching a daily high of $73,620. At the time of writing on Wednesday, it trades slightly down around $72,200.
If BTC maintains its upward momentum, it may soon rally to retest its next key barrier of $73,777, the all-time high reached in mid-March. A successful close above this level could pave the way for BTC to target the 141.40% Fibonacci extension level (drawn from July’s high of $70,079 to August’s low of $49,072) at $78,777.
The Relative Strength Index (RSI) trades at its overbought level of 70, showing strong bullish momentum. However, traders will be advised not to add to their long positions as the chances of a deeper price pullback would increase. Another option is that the rally continues, and the RSI climbs further up into overbought and remains there.
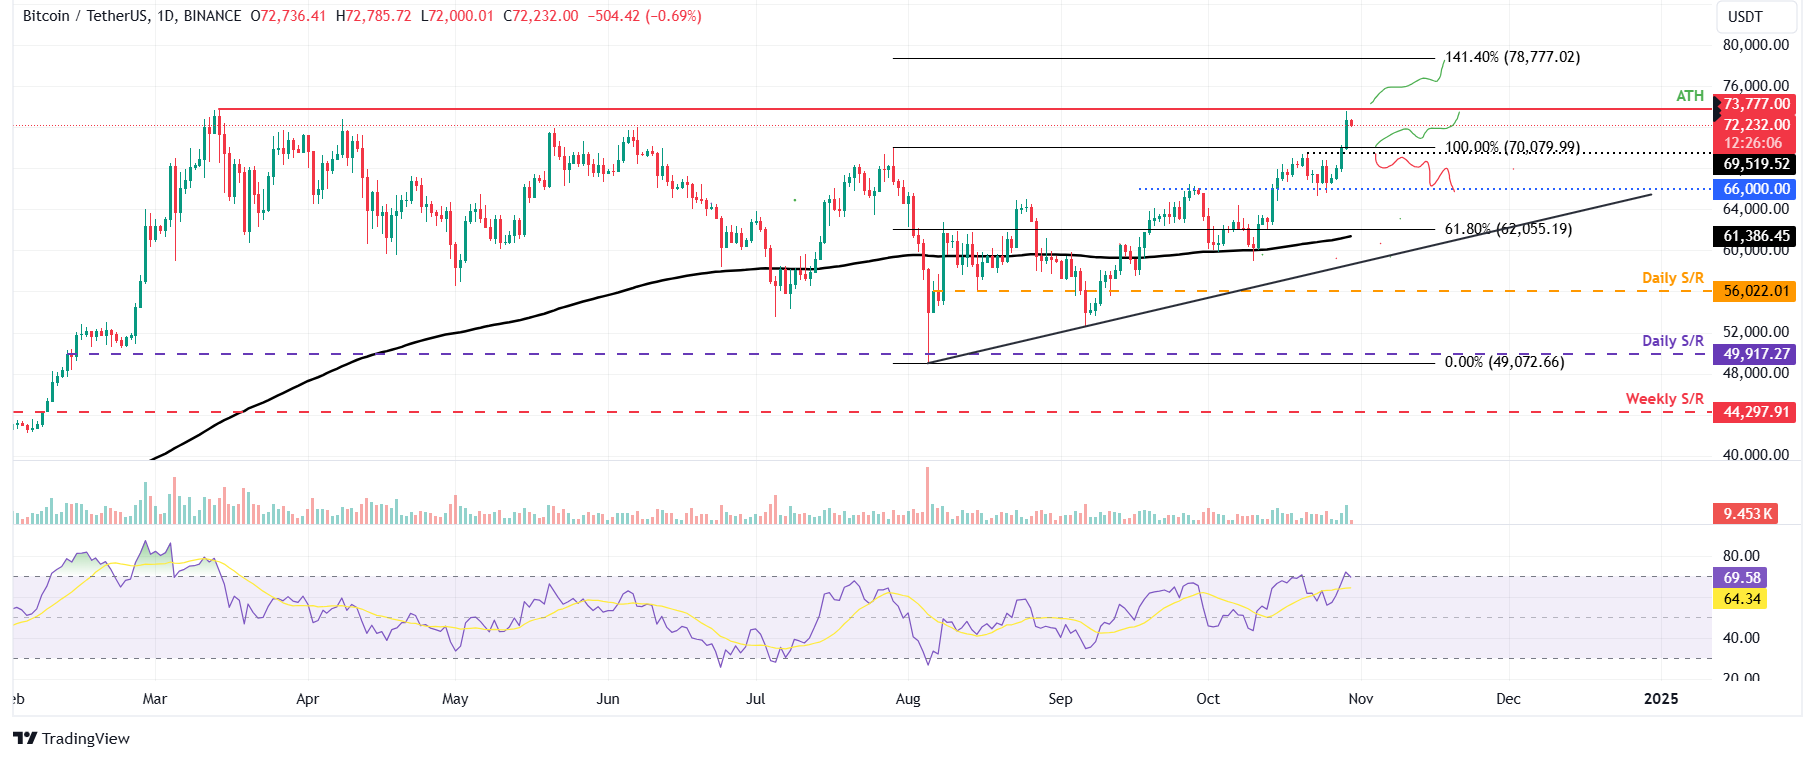
BTC/USDT daily chart
If BTC falls and closes below its psychologically important level of $70,000, it could decline a further 5.7% to retest its next support at $66,000.
Bitcoin, altcoins, stablecoins FAQs
Bitcoin is the largest cryptocurrency by market capitalization, a virtual currency designed to serve as money. This form of payment cannot be controlled by any one person, group, or entity, which eliminates the need for third-party participation during financial transactions.
Altcoins are any cryptocurrency apart from Bitcoin, but some also regard Ethereum as a non-altcoin because it is from these two cryptocurrencies that forking happens. If this is true, then Litecoin is the first altcoin, forked from the Bitcoin protocol and, therefore, an “improved” version of it.
Stablecoins are cryptocurrencies designed to have a stable price, with their value backed by a reserve of the asset it represents. To achieve this, the value of any one stablecoin is pegged to a commodity or financial instrument, such as the US Dollar (USD), with its supply regulated by an algorithm or demand. The main goal of stablecoins is to provide an on/off-ramp for investors willing to trade and invest in cryptocurrencies. Stablecoins also allow investors to store value since cryptocurrencies, in general, are subject to volatility.
Bitcoin dominance is the ratio of Bitcoin's market capitalization to the total market capitalization of all cryptocurrencies combined. It provides a clear picture of Bitcoin’s interest among investors. A high BTC dominance typically happens before and during a bull run, in which investors resort to investing in relatively stable and high market capitalization cryptocurrency like Bitcoin. A drop in BTC dominance usually means that investors are moving their capital and/or profits to altcoins in a quest for higher returns, which usually triggers an explosion of altcoin rallies.
Recommended Articles


