

Bitcoin set sight on new all-time high after briefly breaking past $73,000
- Bitcoin flipped its seven-month resistance of $73,700 on Tuesday following increased buying pressure.
- Bitcoin has again confirmed its positive October sentiment as it aims to set a new all-time high for the second time in 2024.
- Bitcoin's ploy for a new all-time high follows Donald Trump's Polymarket odds on the 2024 election reaching new highs.
Bitcoin (BTC) is trading around $72,200 on Tuesday as it attempts to close October by setting a new all-time high. Such a move will strengthen the ongoing trend of October being the month with the best returns for the top cryptocurrency in recent years. Bitcoin's price also shows a rising correlation with Republican candidate Donald Trump's Polymarket odds in the upcoming US elections.
Bitcoin could reach new all-time high in coming days
Bitcoin surpassed its seven-month resistance of $73,700 and crossed the $1.45 trillion market capitalization mark on Tuesday as bulls stepped up the buying pressure across exchanges.
This is visible in CryptoQuant's data, which reveals that BTC exchange reserves plunged to all-time lows when measured against current supply, indicating high investor buying.
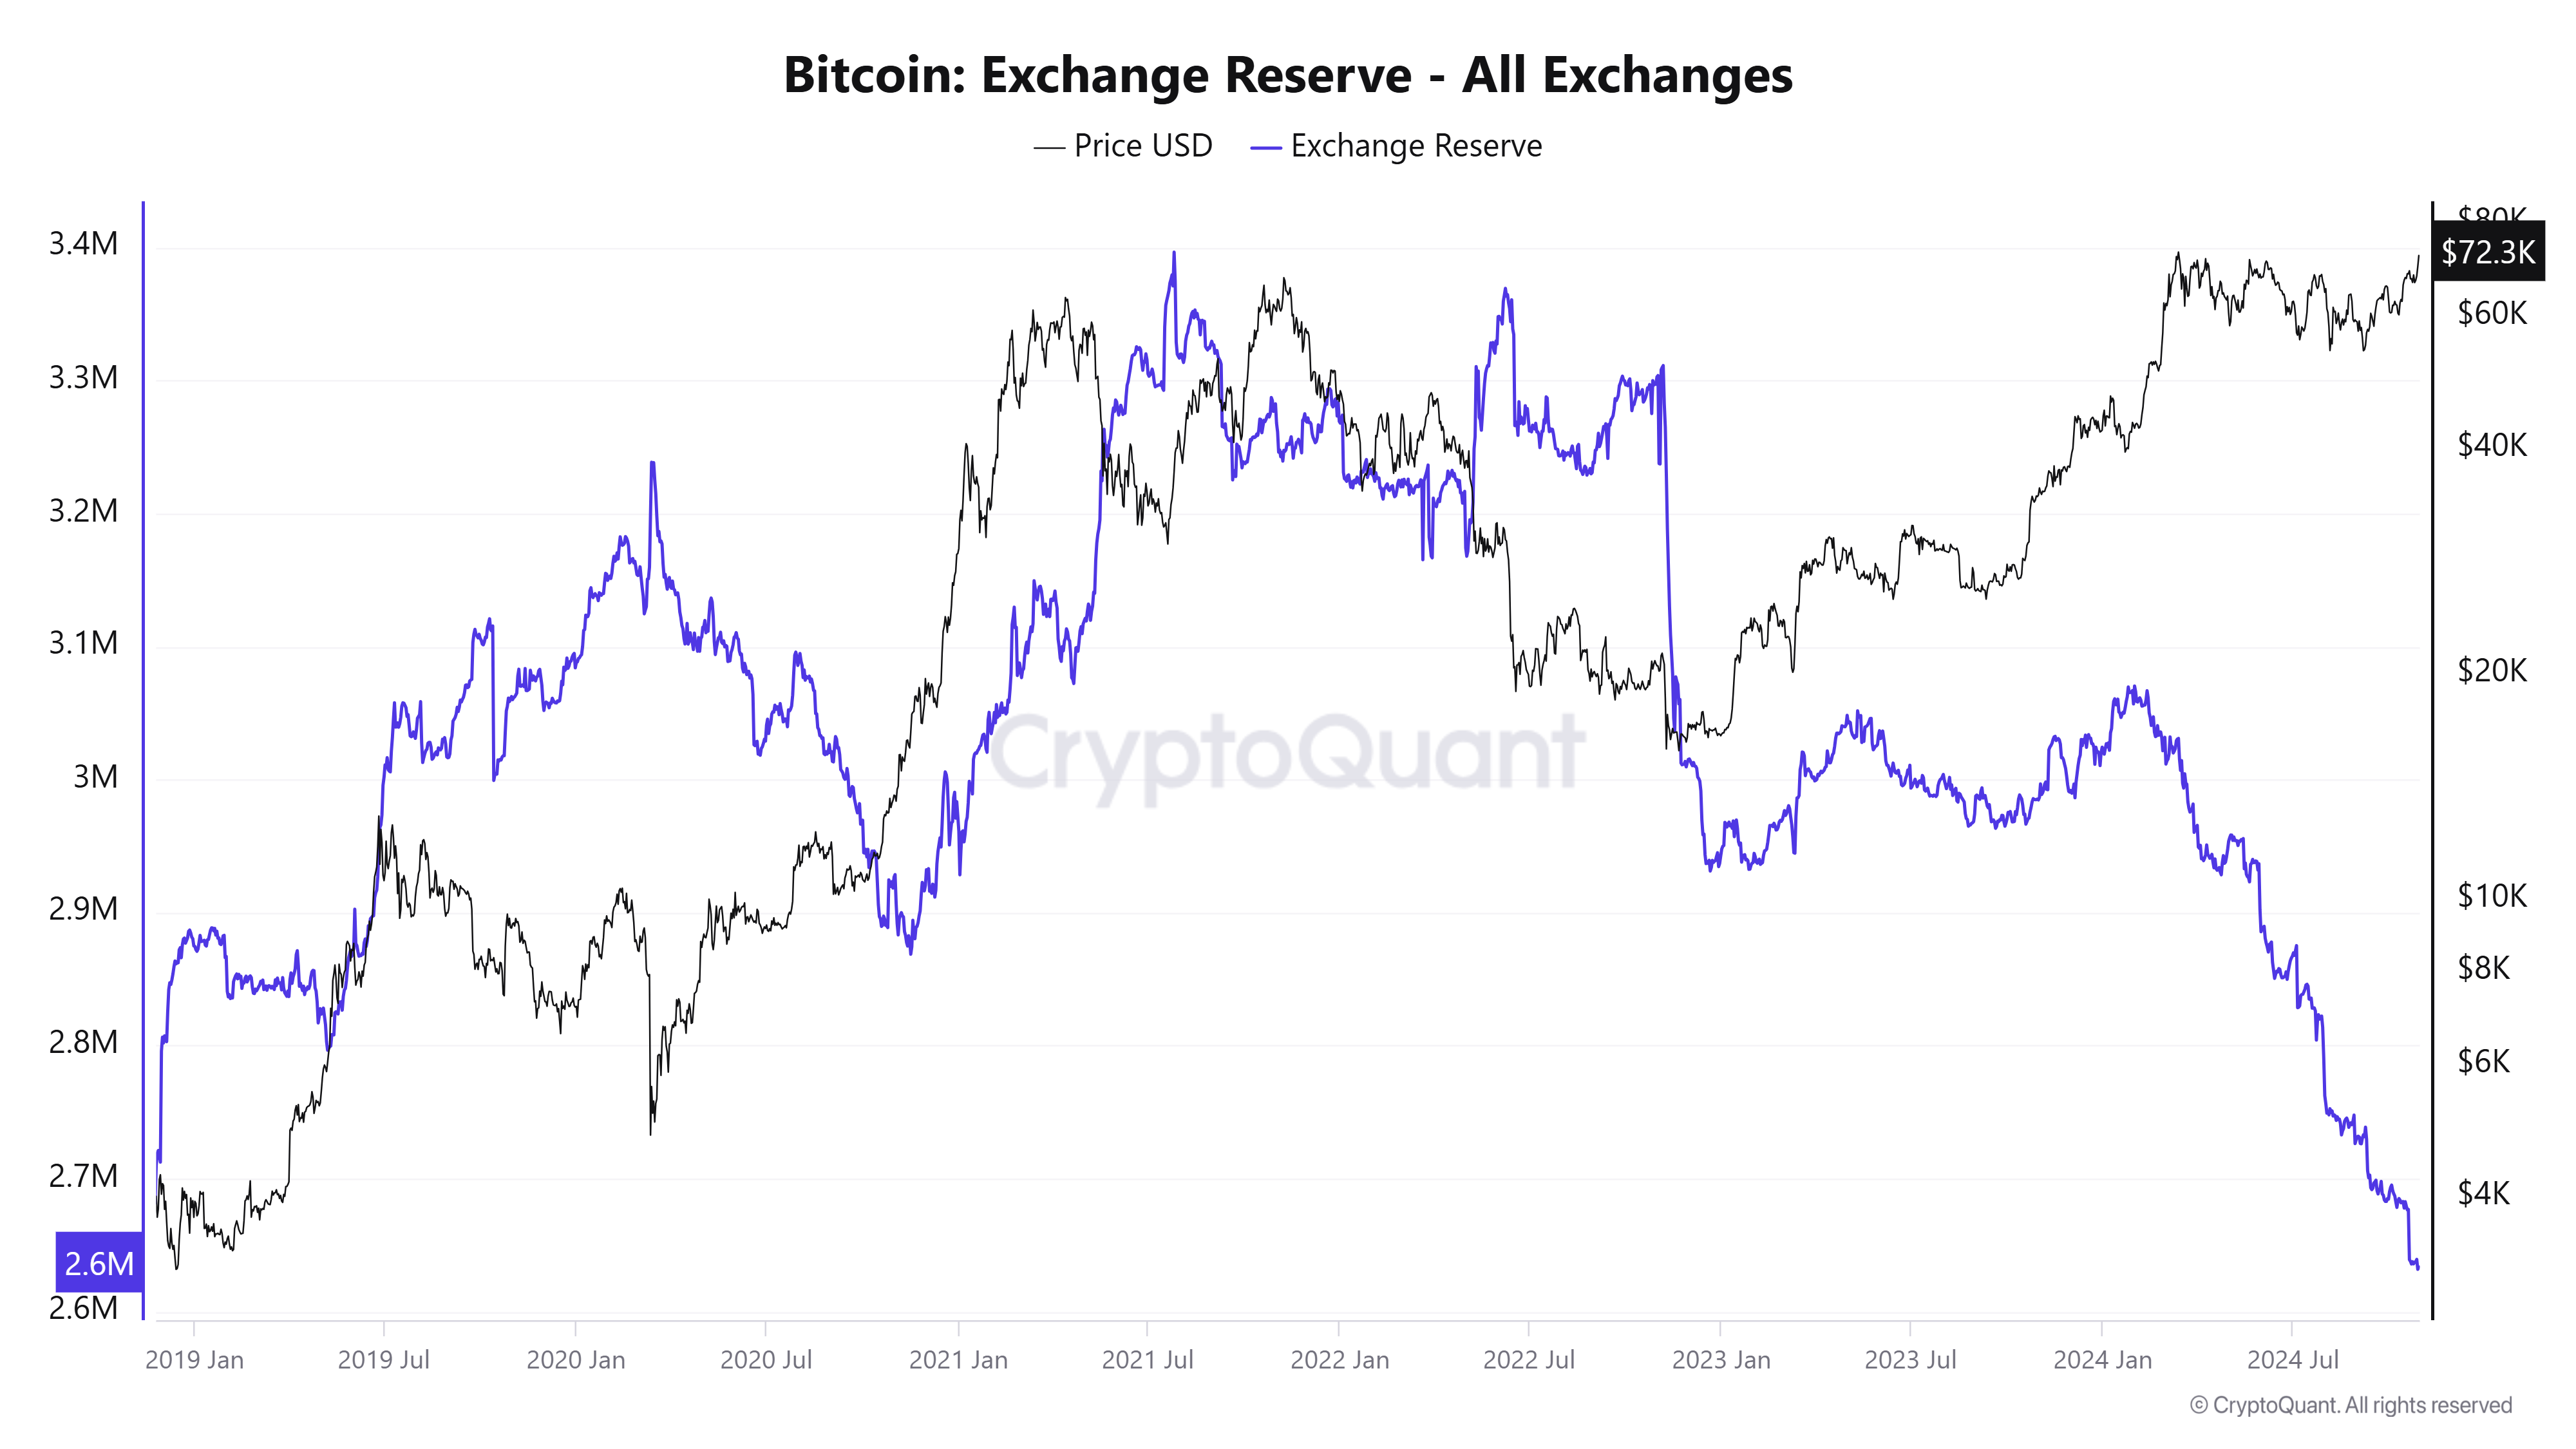
BTC Exchange Reserve (Source: CryptoQuant)
A similar trend is also evident in the Bitcoin exchange-traded funds (ETFs) landscape. Since October 11, they have seen net inflows of nearly $3.9 billion, recording only one day of outflows within the period, per Coinglass data.
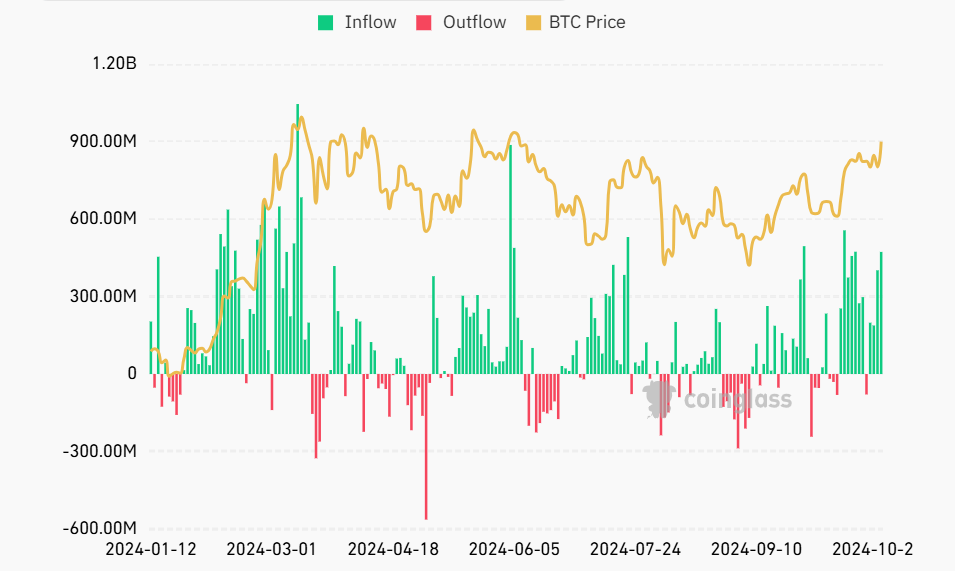
Total Bitcoin Spot ETF Net Inflow (Source: Coinglass)
If BTC reaches a new all-time high in the next few days, it will further strengthen investors' sentiment about October being Bitcoin's best month in recent times. According to Coinglass data, October has been the only month with consistently positive Bitcoin returns since 2019.
Meanwhile, Bitcoin's ploy for a new all-time high closely mimics Republican presidential candidate Donald Trump's Polymarket odds against Kamala Harris, which are 66.9% to 33.1% at the time of writing. With Trump campaigning as a crypto president, more investors are anticipating a blowup in Bitcoin's price and, by extension, the crypto market if he emerges as the winner of the November 5 US presidential elections.
While Bitcoin saw a rejection near its all-time high resistance of $73,777, a retest of this level in the next few hours could see buyers outweighing sellers and BTC recording a new all-time high.
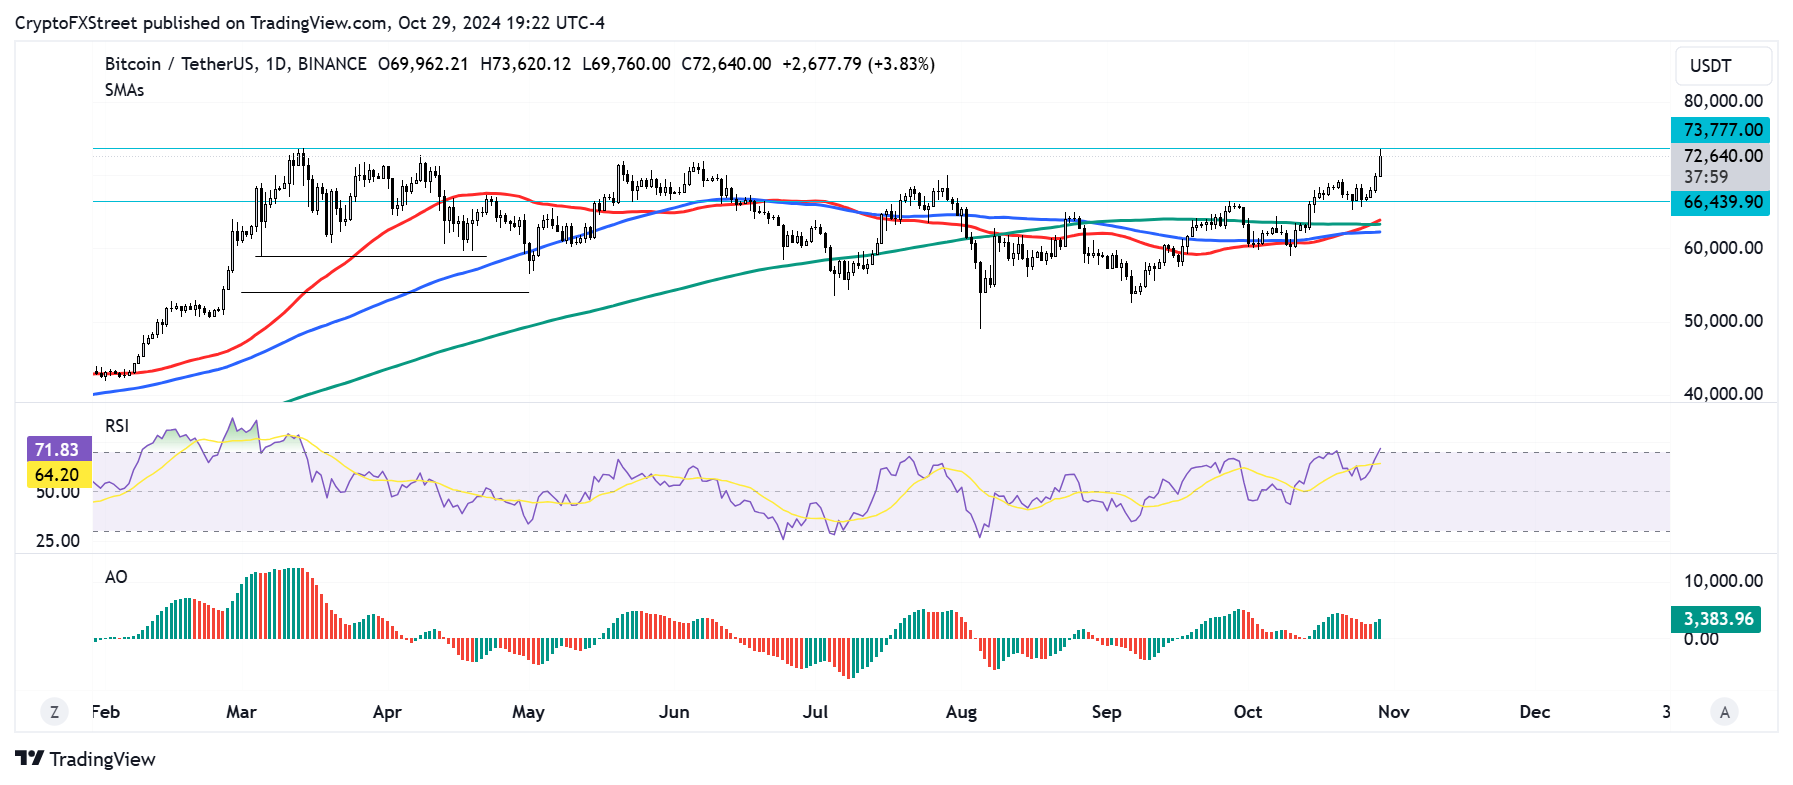
BTC/USDT daily chart
However, a further decline could see Bitcoin finding support near the $66,400 price level.
Recommended Articles


