


Bitcoin Price Forecast: Pointing to new all-time high at $78,900
Bitcoin price today: $71,000
- Bitcoin trades above $71,000 on Tuesday after bouncing from a key technical level on the weekly chart, signaling chances of hitting a new all-time high in the short term.
- US spot Bitcoin ETFs posted $472.6 million in inflows on Monday, extending the gains seen last week.
- The long-to-short ratio jumps to the highest level in October, while Open Interest for BTC reaches a new high of $42.23 billion.
Bitcoin (BTC) extends its gains on Tuesday and trades around $71,000 after bouncing from a key technical level last week. The technical outlook suggests a bullish bias for BTC, projecting a new all-time high at $78,900 in the short term.
This bullish outlook is reinforced by increasing institutional demand through ETFs, which saw over $472 million in inflows on Monday, building on last week’s gains. Additionally, the long-to-short ratio has reached its highest level in October, and Bitcoin’s Open Interest hit a new high of $42.23 billion.
Institutional interest in Bitcoin remains robust
Institutional demand for Bitcoin remains strong, with Coinglass ETF data showing that US spot Exchange Traded Funds (ETFs) saw an inflow of $427.60 million on Monday, marking four consecutive days of inflows. If this trend continues or intensifies, it could further fuel the ongoing Bitcoin price rally.
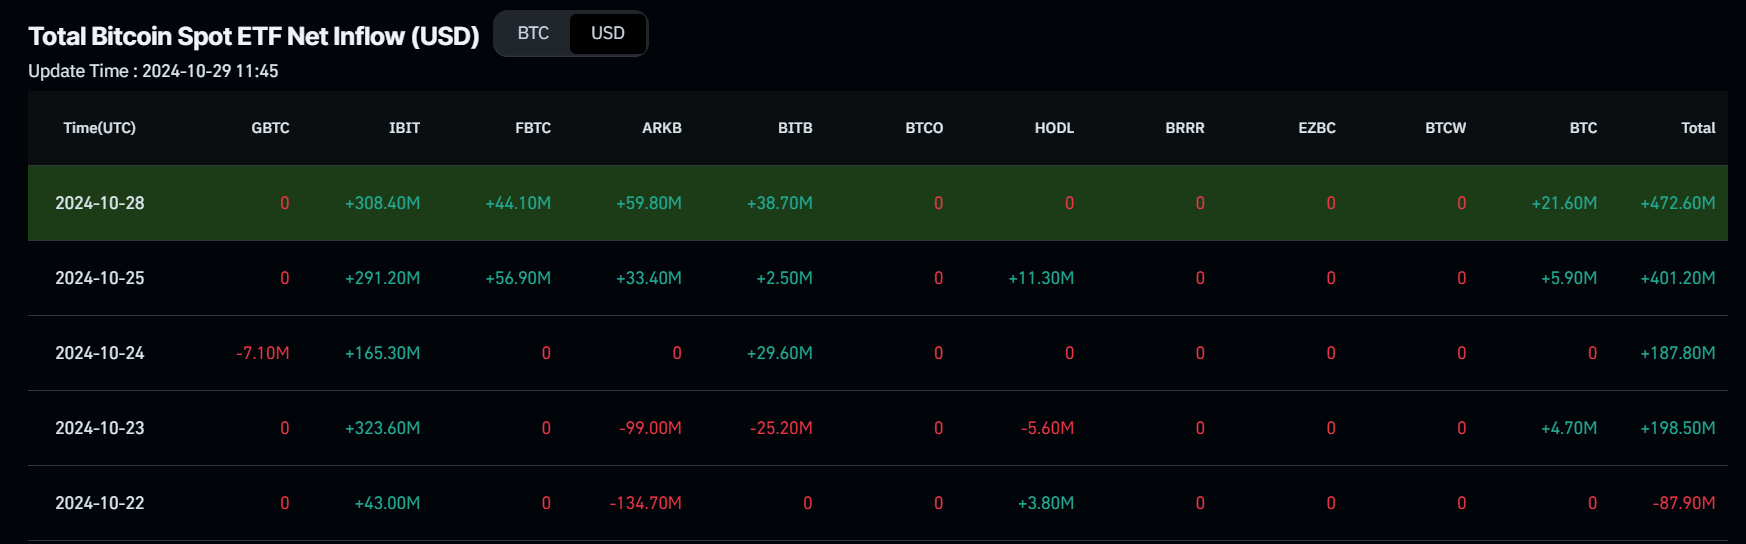
Total Bitcoin Spot ETF Net Inflow chart. Source: Coinglass
CryptoQuant data indicates that BTC may be poised for another bull run, as the percentage of Bitcoin held by US entities – such as exchanges, banks, and funds – has increased again. Historically, this uptick preceded the strong bull run in late 2023, suggesting that BTC could experience a rally in the coming days if history repeats.
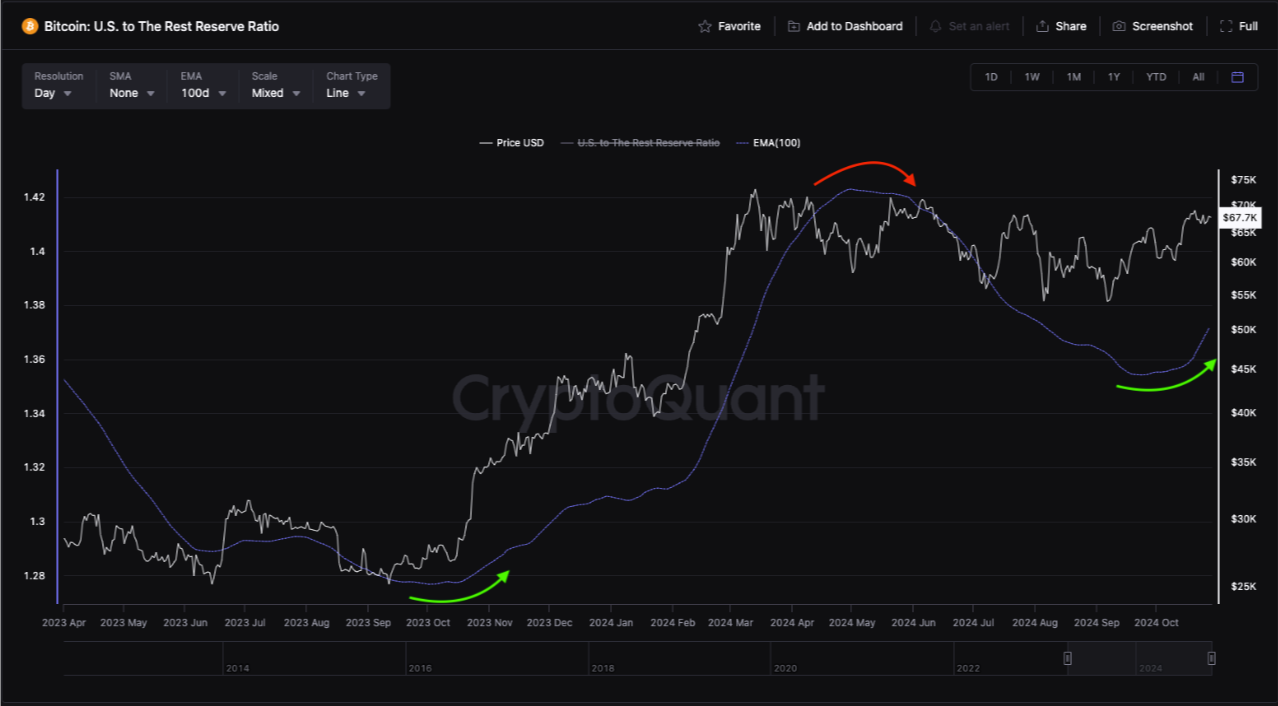
Bitcoin US to the rest reserve ration chart. Source: CryptoQuant
On-chain metrics support Bitcoin rally
Looking down at Bitcoin’s on-chain metrics reveals signs of optimism. Coinglass data shows that futures Open Interest (OI) at exchanges hit a new all-time high of $42.23 billion on Tuesday, indicating that new capital is entering the market and driving fresh buying activity.
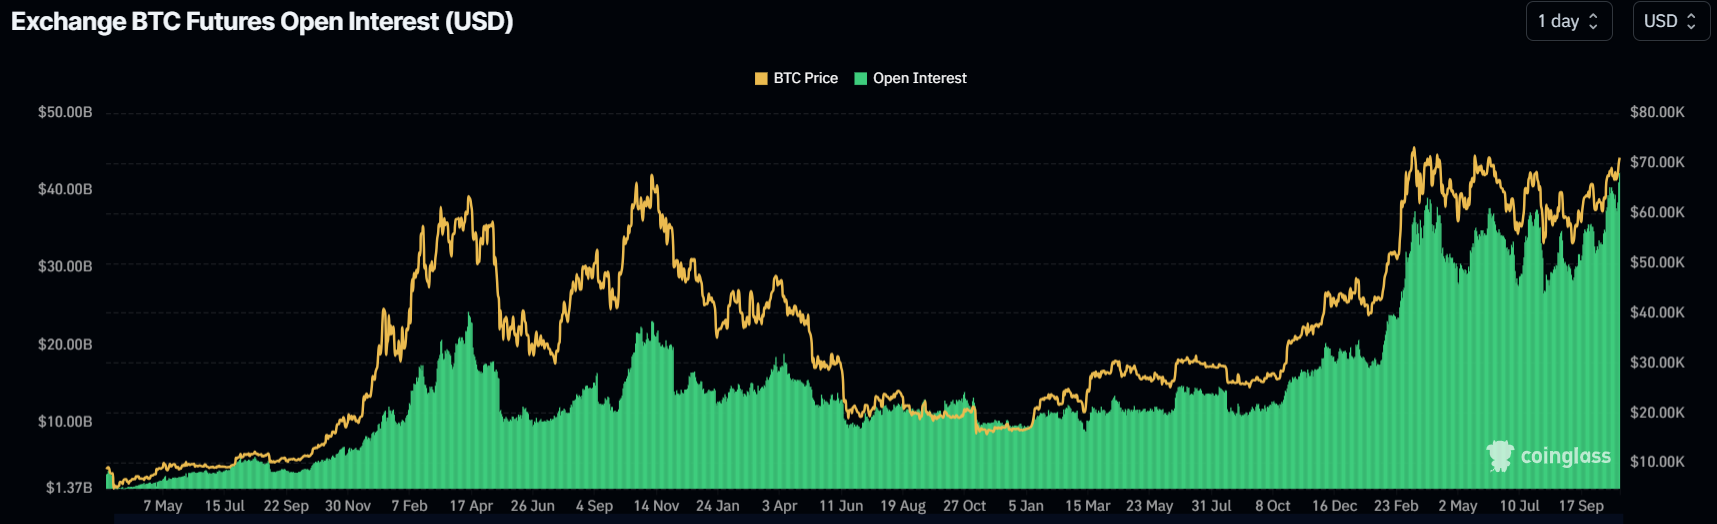
BTC Futures Open Interest Chart. Source: Coinglass
Moreover, BTC’s long-to-short ratio also stands at 1.18, the highest level in one month. This ratio reflects bullish sentiment in the market, as the figure above one suggests that more traders anticipate the price of Bitcoin to rise.
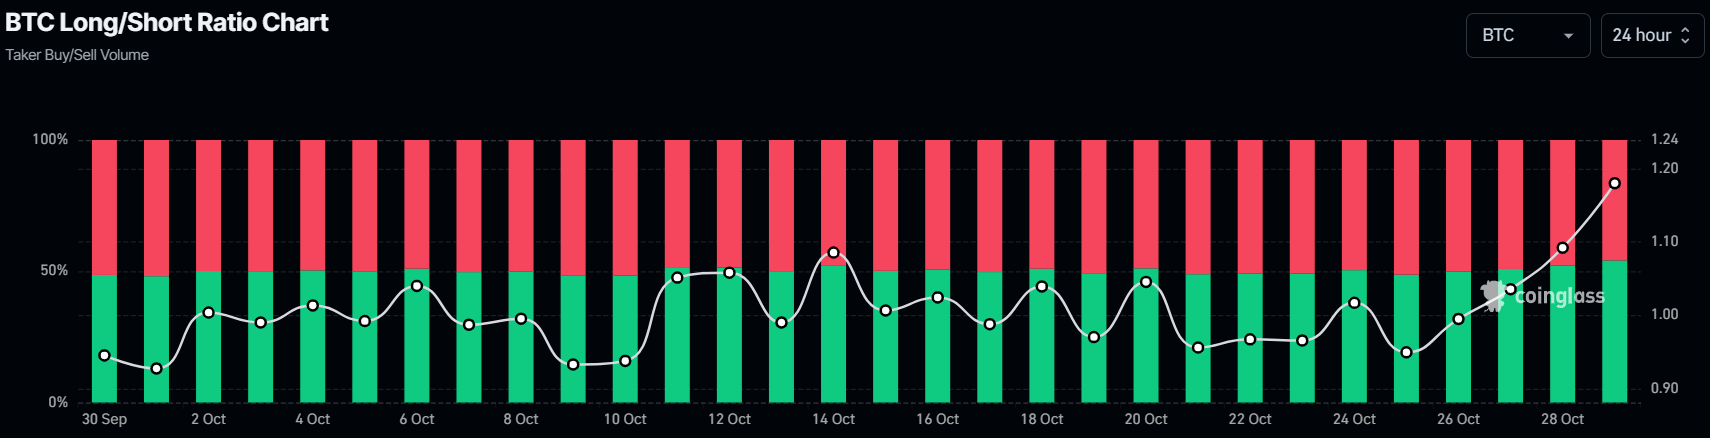
BTC long-to-short ratio chart. Source: Coinglass
Bitcoin Price Forecast: Eyes for new all-time high
Bitcoin’s weekly chart shows that the biggest crypto asset by market capitalization broke and successfully retested the breakout level of the downward-sloping parallel channel pattern around $67,500 last week. At the start of this week, it gained over 4.5% and trades around $71,000.
The pattern’s technical target (obtained by measuring the distance between the two trendlines and extrapolating it higher) projects a new ATH of $78,955.
The Relative Strength Index (RSI) momentum indicator on the weekly chart trades at 60, above its neutral level of 50 and still far below overbought conditions, suggesting bullish momentum is gaining traction.
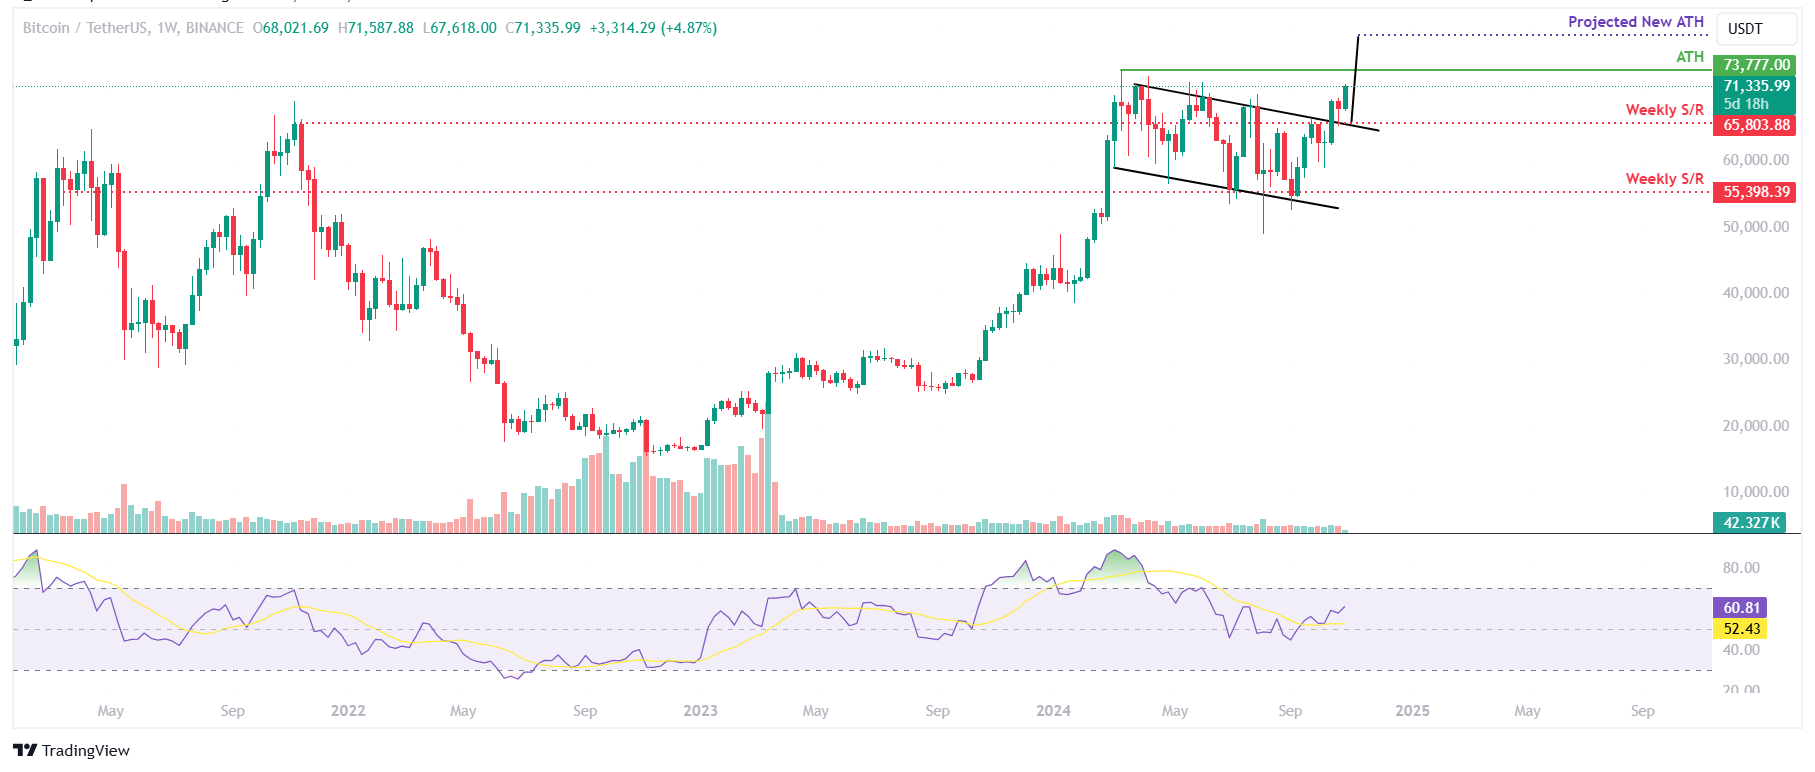
BTC/USDT weekly chart
The daily chart also indicates signs of bullish price action. On Friday, Bitcoin price retested and found support around $66,000, rising 4.89% until Monday. As of Tuesday, it continues to extend its gains.
If BTC maintains its upward momentum, it may soon rally to retest its next key barrier of $73,777, the all-time high reached in mid-March. A successful close above this level could pave the way for BTC to target the 141.40% Fibonacci extension level (drawn from July’s high of $70,079 to August’s low of $49,072) at $78,777, roughly aligning with the weekly chart target previously discussed.
The daily charts' RSI reads 69, nearing its overbought level of 70, showing strong bullish momentum. However, if it enters the zone on a closing basis, traders will be advised not to add to their long positions as the chances of a price pullback would increase. Another option is that the rally continues, and the RSI climbs further up into overbought and remains there.
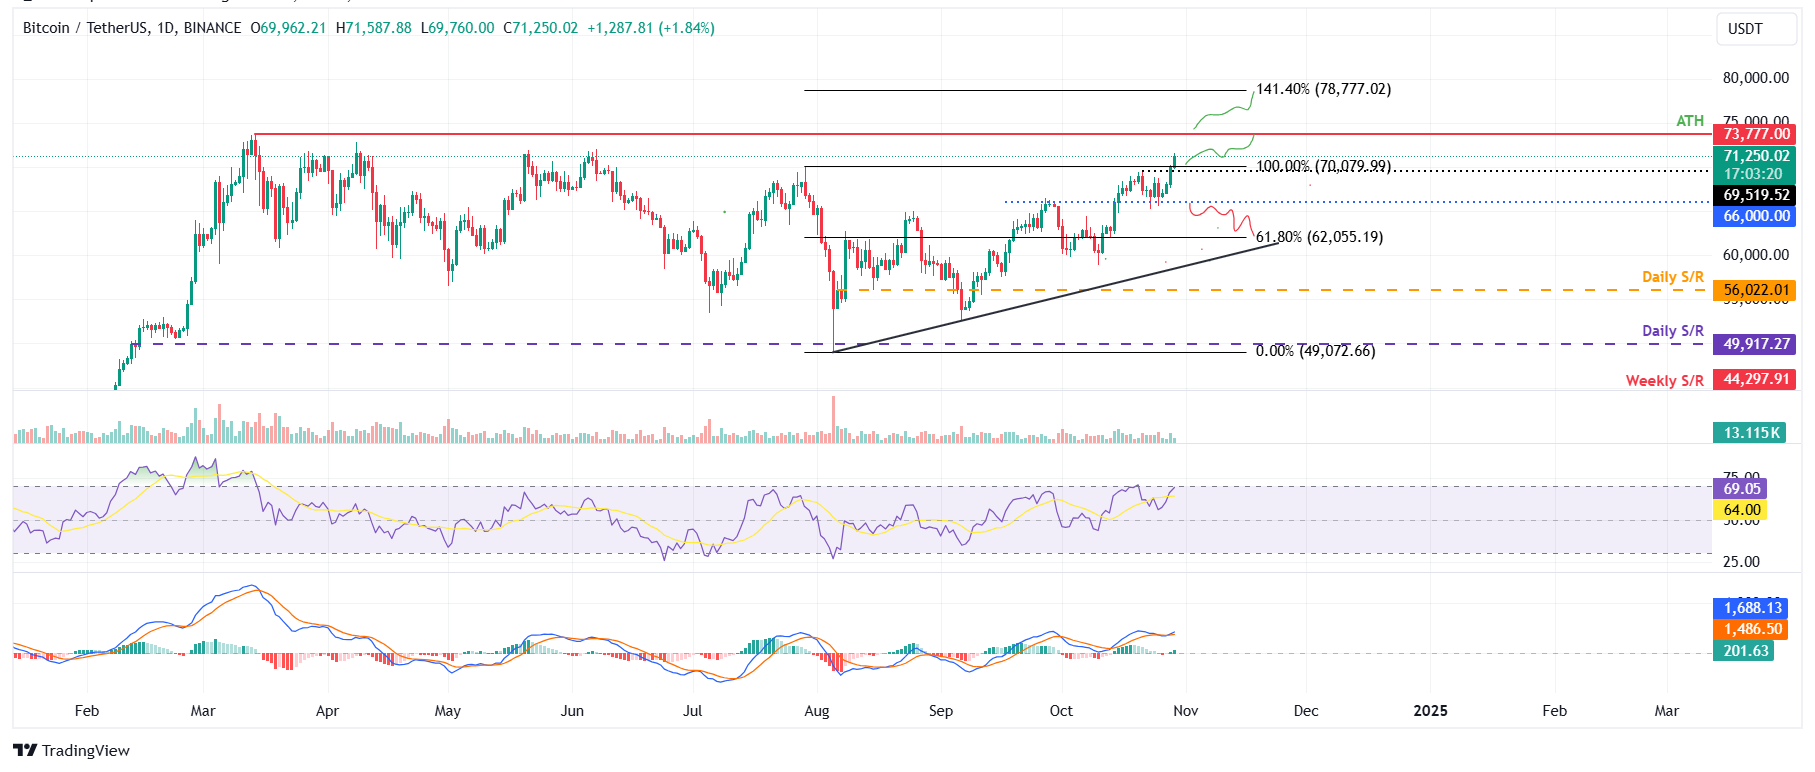
BTC/USDT daily chart
If BTC falls closes below $66,000, it could decline a further 5.8% to retest its next support at $62,055, the 61.8% Fibonacci retracement level (drawn from July’s high of $70,079 to August’s low of $49,072).
Bitcoin, altcoins, stablecoins FAQs
Bitcoin is the largest cryptocurrency by market capitalization, a virtual currency designed to serve as money. This form of payment cannot be controlled by any one person, group, or entity, which eliminates the need for third-party participation during financial transactions.
Altcoins are any cryptocurrency apart from Bitcoin, but some also regard Ethereum as a non-altcoin because it is from these two cryptocurrencies that forking happens. If this is true, then Litecoin is the first altcoin, forked from the Bitcoin protocol and, therefore, an “improved” version of it.
Stablecoins are cryptocurrencies designed to have a stable price, with their value backed by a reserve of the asset it represents. To achieve this, the value of any one stablecoin is pegged to a commodity or financial instrument, such as the US Dollar (USD), with its supply regulated by an algorithm or demand. The main goal of stablecoins is to provide an on/off-ramp for investors willing to trade and invest in cryptocurrencies. Stablecoins also allow investors to store value since cryptocurrencies, in general, are subject to volatility.
Bitcoin dominance is the ratio of Bitcoin's market capitalization to the total market capitalization of all cryptocurrencies combined. It provides a clear picture of Bitcoin’s interest among investors. A high BTC dominance typically happens before and during a bull run, in which investors resort to investing in relatively stable and high market capitalization cryptocurrency like Bitcoin. A drop in BTC dominance usually means that investors are moving their capital and/or profits to altcoins in a quest for higher returns, which usually triggers an explosion of altcoin rallies.
Recommended Articles


