

Solana Price Forecast: SOL risks 12% drop as bankrupt FTX exchange offloads holdings

Source Fxstreet

Solana price today: $151.69

  • Solana’s price erases nearly 4% value on Tuesday, back close to $151.
  • Bankrupt FTX exchange’s staking address redeemed nearly $28 million in SOL on Tuesday. 
  • The unstaked tokens could flow to exchange wallets, increasing selling pressure and pushing SOL price lower. 

Solana (SOL) sees a volatile trade on Tuesday, with a whipsaw move in the early American session. After recovering initial daily losses and extending its recent upward move aiming to recapture the $160 level, SOL’s price sharply declined in the last hour. At the time of writing, SOL trades at $151.69, erasing nearly 4% value in the day.

The native token of the Ethereum-alternative smart contract platform could suffer a decline if the selling pressure on SOL increases. 

On-chain data shows that the bankrupt FTX exchange unstaked a large volume of SOL tokens on Tuesday. As seen in previous instances, the tokens will likely be transferred to Coinbase or a centralized exchange platform, increasing the volume of SOL available on exchanges and contributing to selling pressure on the token. 

Solana price could dip lower if FTX exchange offloads its SOL tokens

FTX exchange went bankrupt in November 2022. Since then, the platform has consistently offloaded its crypto token holdings, transferring unstaked Ethereum (ETH) and other tokens to centralized crypto exchange platforms. 

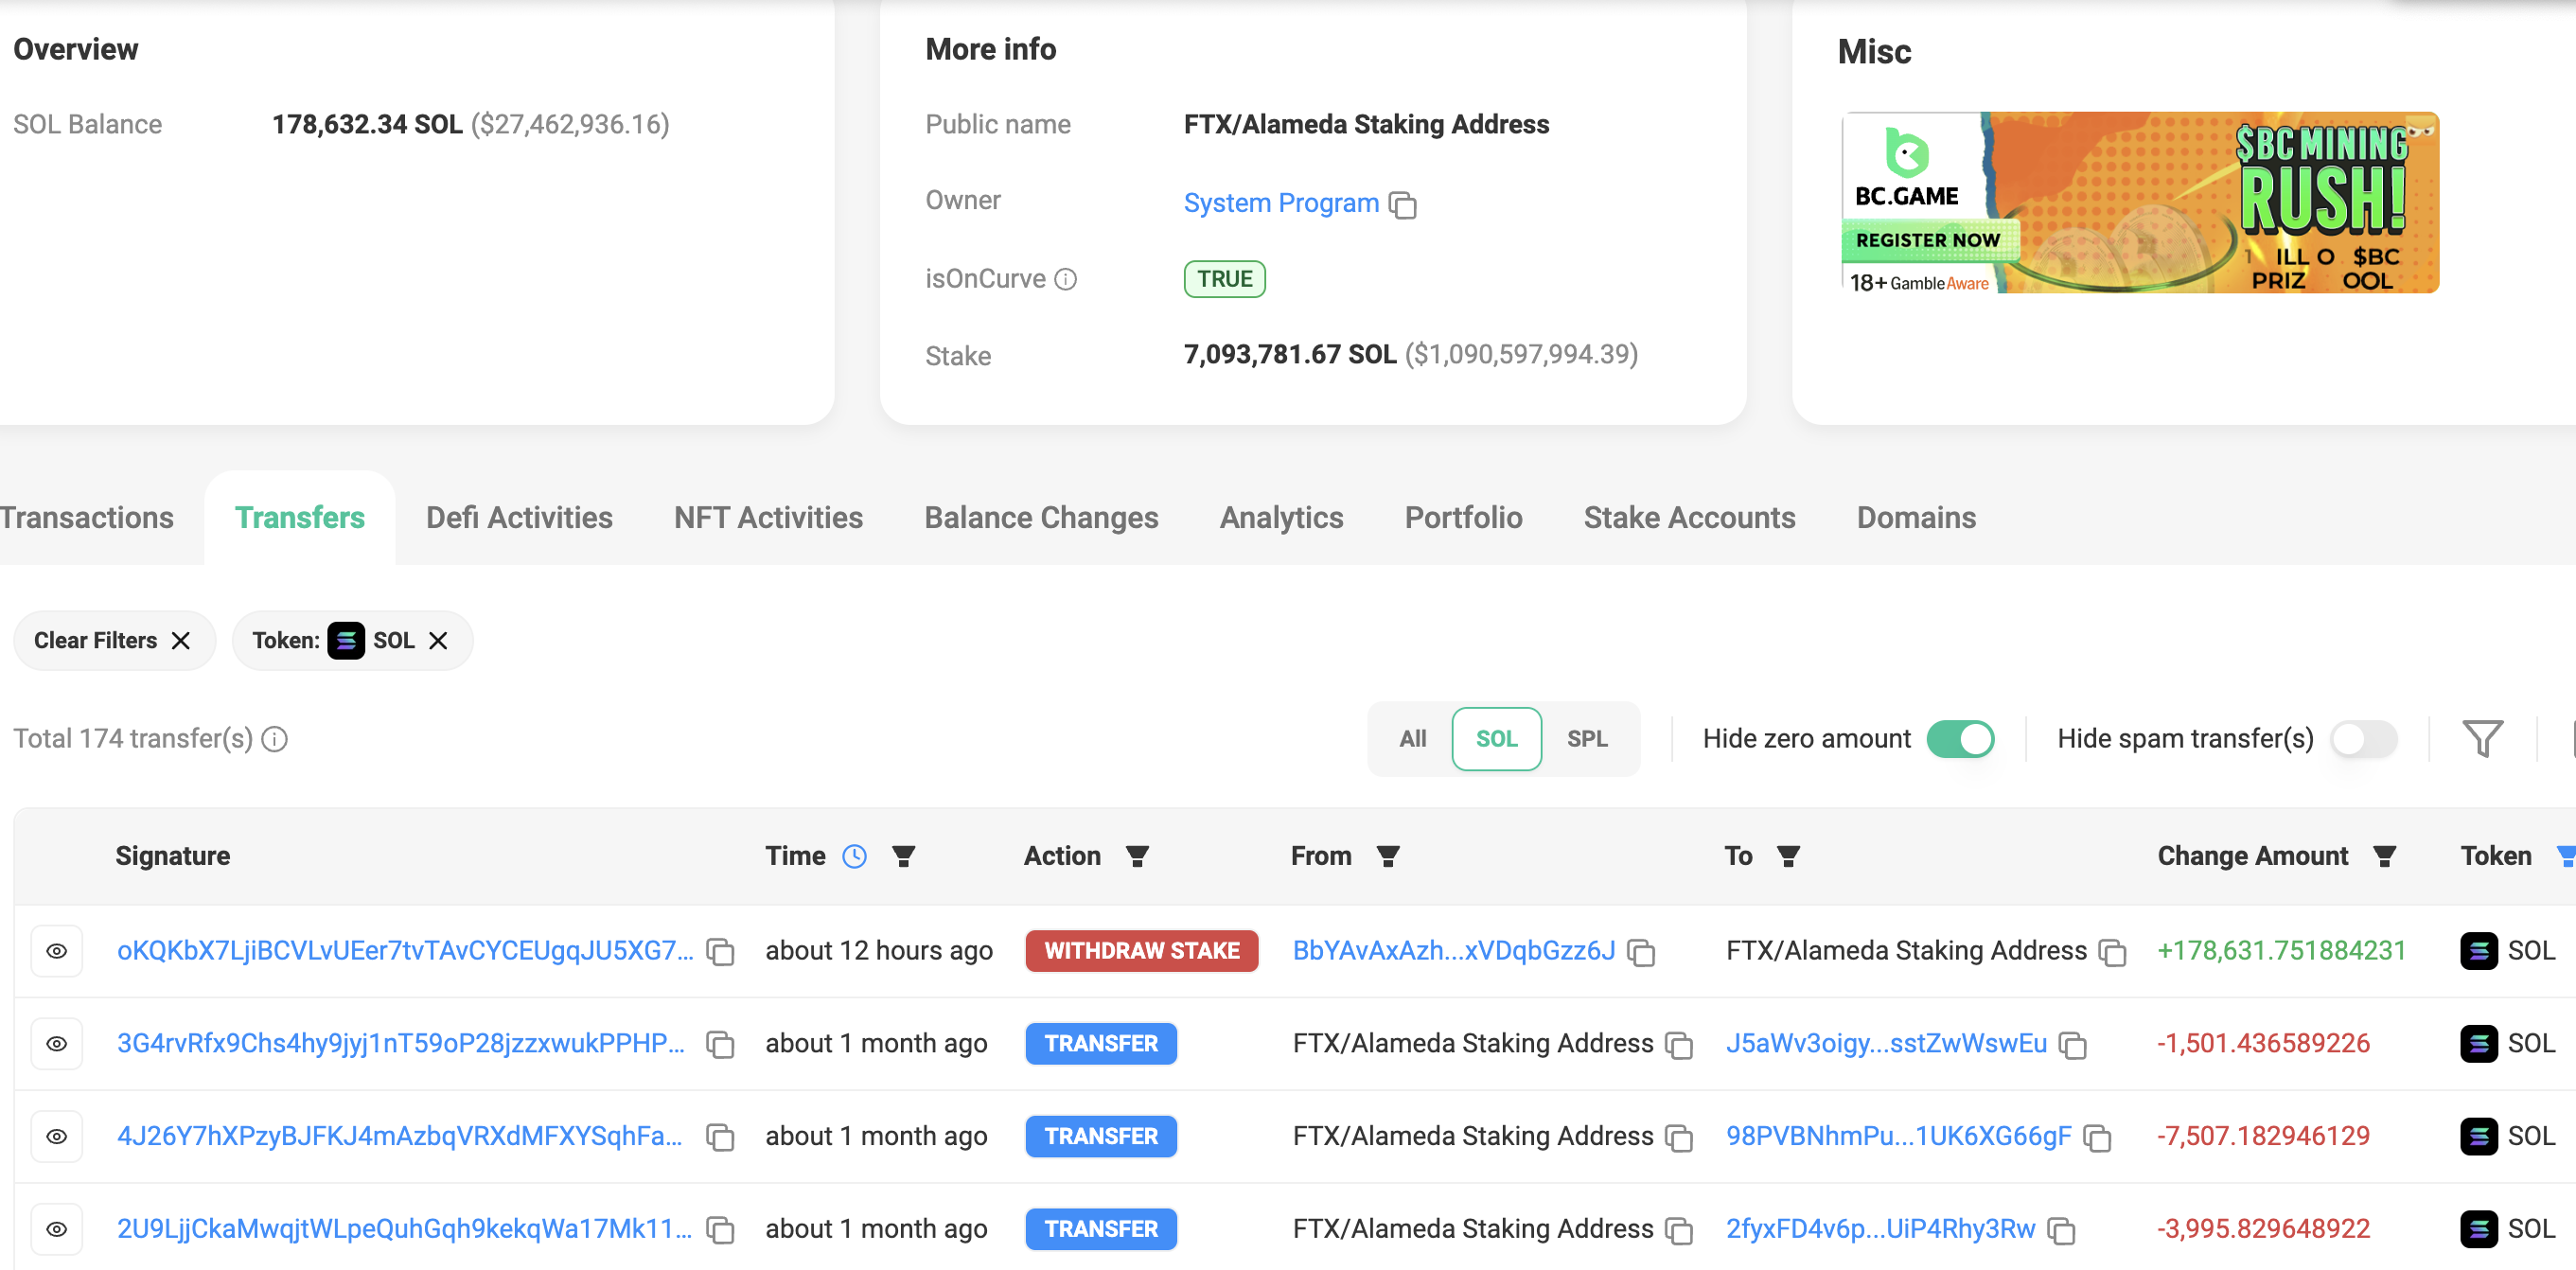
The SOL staking addresses of the exchange redeemed 178,631 SOL tokens worth $28 million early on Tuesday, according to on-chain data from Solscan. Most of the unstaked tokens are expected to flow back to one of the top centralized exchanges. Previous transactions from the address show that 170,000 SOL is unstaked typically between the 12th and 15th of the month. 

FTX exchange currently holds another 7.09 million SOL worth $1.107 billion, staked at the time of writing. 
SOL

Solana unstaked by FTX exchange 

Solana Price Forecast: SOL risks a 12% drop 

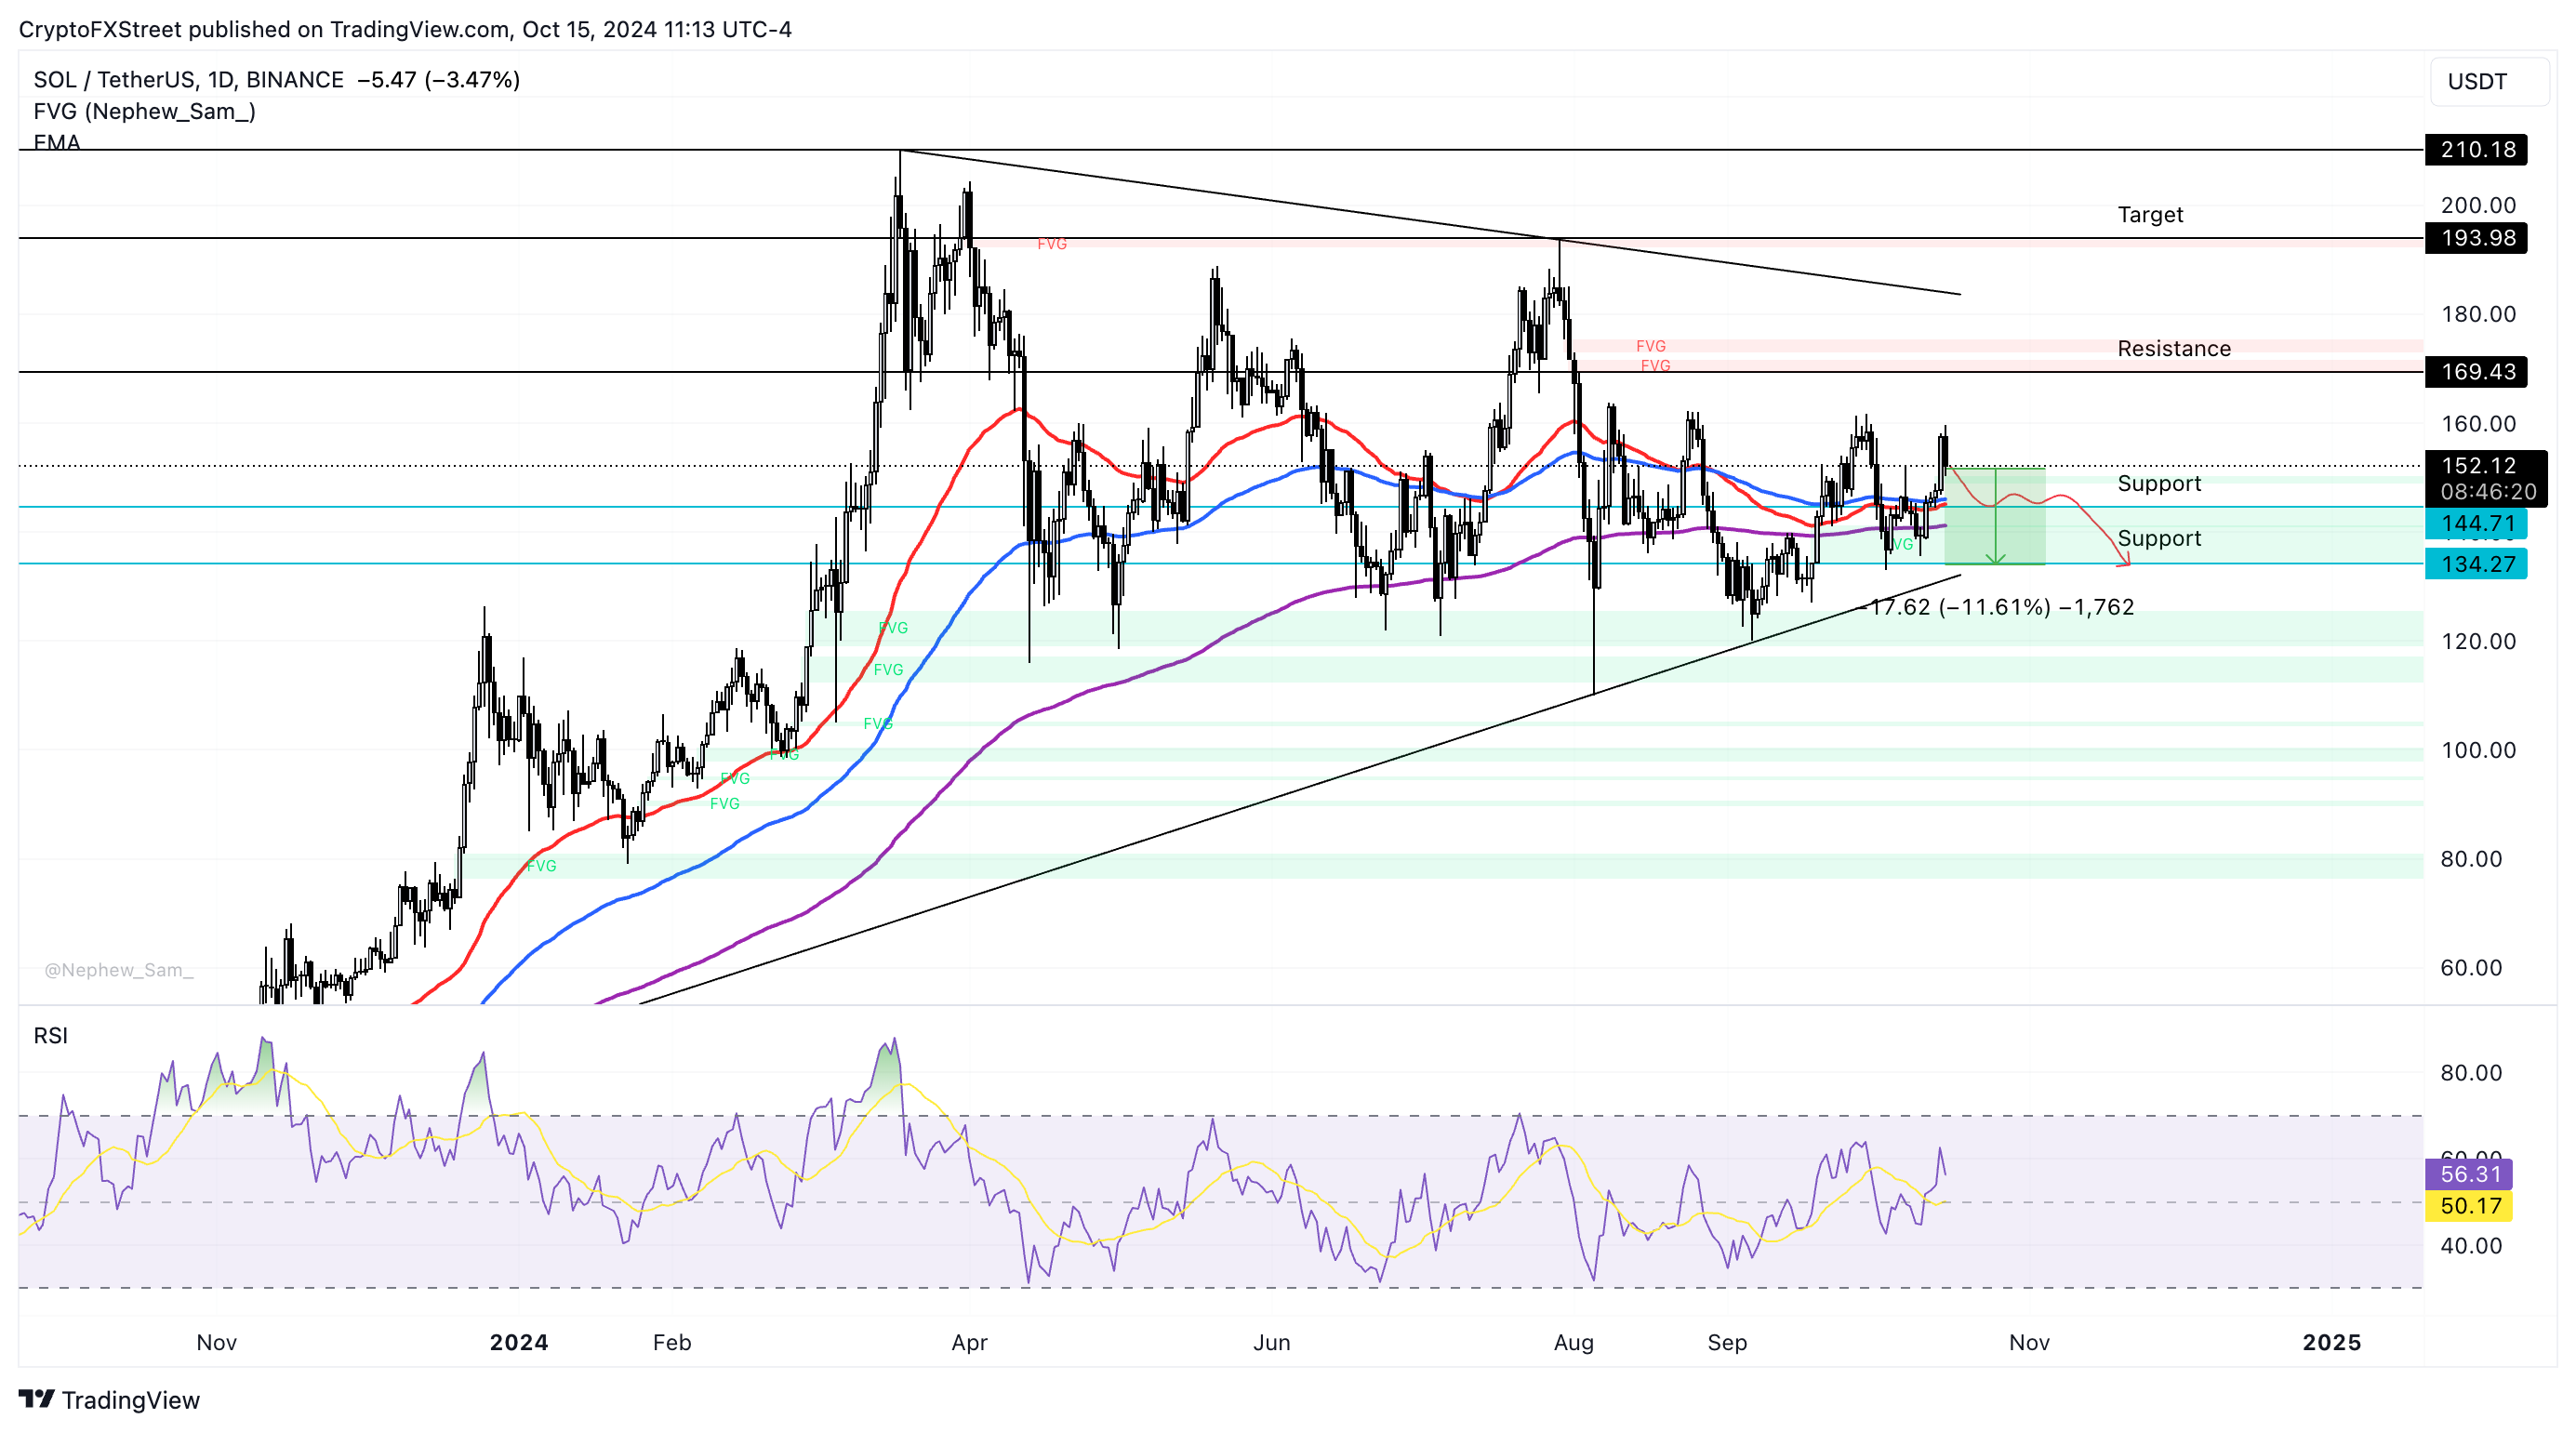
Solana (SOL) is stuck within a range between $210.18 (March 18 high) and $110 (August 5 low) for over six months now. Solana erases part of its Monday’s gains and is likely to dip lower on Tuesday after increasing selling pressure. The altcoin could drop by nearly 12% and sweep liquidity at the $134.27 support level, the September 19 low. 

On the way down, SOL’s price can find interim support at the $144.71 level, the October 13 low.

The Relative Strength Index (RSI) reads 56.16, pointing downwards on the SOL/USDT daily chart, and signaling the easing of bullish momentum. A downward sloping RSI typically represents a downward trend in a token’s price.
SOL

SOL/USDT daily chart

A daily candlestick close above the September 29 high of $161 could invalidate the bearish thesis, and SOL could test resistance at $169.43. Further up, SOL’s target is $193.98, the July 29 peak. 

Disclaimer: For information purposes only. Past performance is not indicative of future results.
placeholder
Bitcoin lost its 200-day average — but the exit started three sessions before the CPIBitcoin fell 2.5% to about $73,400 on 11 November, an 11-week low, breaking its 200-day moving average near $73,100. The 24-hour liquidation tally reached $632 to $705 million, roughly 82% of it longs. But spot ETF outflows began three sessions earlier and USDT's market cap has shrunk $6.6 billion in 60 days — the leveraged length left before the inflation print did. A double top at 81,890 and 81,080 leaves a measured target of 69,366.
Author  Suzie
15 hours ago
Bitcoin fell 2.5% to about $73,400 on 11 November, an 11-week low, breaking its 200-day moving average near $73,100. The 24-hour liquidation tally reached $632 to $705 million, roughly 82% of it longs. But spot ETF outflows began three sessions earlier and USDT's market cap has shrunk $6.6 billion in 60 days — the leveraged length left before the inflation print did. A double top at 81,890 and 81,080 leaves a measured target of 69,366.
placeholder
Core CPI stuck at 0.3% for a third straight month — and BLS couldn't publish the number that would explain itOctober headline CPI rose 0.4% m/m against a 0.3% consensus, and core rose 0.3% for a third consecutive month against 0.2% expected. BLS published no year-on-year figures because October 2025 collection was lost to the government shutdown. Energy cooled to 0.7% from 5.2% — shelter, food and transport services did the rest. The 2-year yield jumped 18 to 21 basis points, the 10-year added 12, and the dollar closed at 102.25.
Author  Irene Q.
15 hours ago
October headline CPI rose 0.4% m/m against a 0.3% consensus, and core rose 0.3% for a third consecutive month against 0.2% expected. BLS published no year-on-year figures because October 2025 collection was lost to the government shutdown. Energy cooled to 0.7% from 5.2% — shelter, food and transport services did the rest. The 2-year yield jumped 18 to 21 basis points, the 10-year added 12, and the dollar closed at 102.25.
placeholder
Gold Tumbles Toward $4,000 as Hotter-Than-Expected CPI Boosts Fed Rate-Hike Bets, Bulls Eye $3,975 SupportAs of the Asian session on Wednesday (November 11), gold prices (XAUUSD) rebounded slightly after a sharp decline in the previous session, last trading near $4,040, up about 0.3% on the d
Author  TradingKey
15 hours ago
As of the Asian session on Wednesday (November 11), gold prices (XAUUSD) rebounded slightly after a sharp decline in the previous session, last trading near $4,040, up about 0.3% on the d
placeholder
Gold Price Analysis Today | Forex Gold Analysis | XAU/USD Analysis - November 11, 2026Get the latest gold price analysis, forex gold insights, and XAU/USD analysis for November 11, 2026. Read on for the details.
Author  Mitrade
15 hours ago
Get the latest gold price analysis, forex gold insights, and XAU/USD analysis for November 11, 2026. Read on for the details.
placeholder
TradingKey Daily Market Briefing: US Stocks Retreat as CPI Tops Estimates; Nvidia Falls Over 5%, AMD and Broadcom Buck the Trend On November 10, the three major U.S. stock indices edged lower. U.S. October inflation data exceeded market expectations, driving Treasury yields rapidly higher and
Author  TradingKey
16 hours ago
On November 10, the three major U.S. stock indices edged lower. U.S. October inflation data exceeded market expectations, driving Treasury yields rapidly higher and
Related Instrument
goTop
quote