

Bitcoin Price Forecast: BTC breaks above $67,000
Bitcoin price today: $67,000
- US Bitcoin Spot ETFs recorded $555.90 million in inflows on Monday, the highest single-day figure since June 4.
- Ki Young Ju, founder and CEO of CryptoQuant, explains that Bitcoin’s apparent demand is increasing, suggesting a bullish outlook.
- QCP’s report on Tuesday highlights some signs of optimism for Bitcoin.
Bitcoin (BTC) extends its gains on Tuesday, trading above $67,000 after a 5% rally on Monday, driven by robust demand reflected in over $555 million in inflows into US Bitcoin Spot Exchange Traded Funds (ETFs), as well as a Tuesday report from crypto asset trading firm QCP that underscores growing optimism for BTC. This all suggests a potential rally in the coming days.
Bitcoin institutional demand on the rise
Institutional demand shows signs of strength. According to Coinglass data, US Bitcoin Spot ETFs recorded an inflow of $555.90 million on Monday, the highest single-day inflow since June 4. Studying the ETF flow data can be useful for observing institutional investors’ sentiment for Bitcoin. If the magnitude of inflows like this continues or increases, this trend would signal a rise in demand for Bitcoin, leading to its price rally.
-638646004965537842.png)
-638646005264141471.png)
Bitcoin Spot ETF Net Inflow chart. Source: Coinglass
Additionally, Ki Young Ju, founder and CEO of CryptoQuant, an on-chain data and analytics company, posted on X that Bitcoin’s apparent demand is back, suggesting a bullish outlook for the largest cryptocurrency by market capitalization.
Apparent demand is the difference between production and changes in inventory. For Bitcoin, production refers to mining issuance, while inventory refers to the supply that has been inactive for over a year. If the decrease in inventory exceeds production, demand is increasing and vice versa. This metric is widely used across industries, including consumer goods and raw materials.
#Bitcoin apparent demand is back.
— Ki Young Ju (@ki_young_ju) October 15, 2024
h/t @jjcmoreno pic.twitter.com/82WV1s3x2r
QCP Capital’s (crypto asset trading) report on Tuesday highlights signs of optimism for Bitcoin.
It states, “The rally may be election-driven, initially sparked by Trump’s lead in prediction markets and polls, and further boosted by Kamala Harris’s pledge for a crypto regulatory framework signals a friendlier stance toward the crypto industry, a notable shift from the Biden administration.”
The report further explains that China’s recent stimulus may have led some investors to shift capital from Chinese equities to Bitcoin. Additionally, the residual boost from defaulted exchange Mt. Gox’s repayment delay by another year eased concerns of a supply overhang. Lastly, it reports that Israel may refrain from targeting Iran’s crude Oil and nuclear infrastructure, reducing geopolitical risks.
Bitcoin Price Forecast: BTC breaks above $66,000
Bitcoin price found support around its 200-day Exponential Moving Average (EMA) at $60,217 on Thursday and rallied 9.7% to retest its $66,000 psychological level in the next four days. As of Tuesday, it is extending its gains to trade above $67,000.
If BTC successfully closes above the $66,000 level, it could continue its ongoing rally to retest its July 29 high of $70,079.
The Moving Average Convergence Divergence (MACD) indicator further supports Bitcoin’s rise, signaling a bullish crossover on the daily chart. The MACD line (blue line) moved above the signal line (yellow line), giving a buy signal on Monday. It shows rising green histogram bars above the neutral line of zero, also suggesting that Bitcoin’s price could experience upward momentum.
Furthermore, the Relative Strength Index (RSI) on the daily chart shows that Bitcoin is not yet overbought. It trades at 67 but is close to the overbought level of 70. If it enters the zone on a closing basis, traders will be advised not to add to their long positions, although the rally may continue. If it enters overbought and then exits back into the neutral level of 50, it will be a sign of a deeper correction.
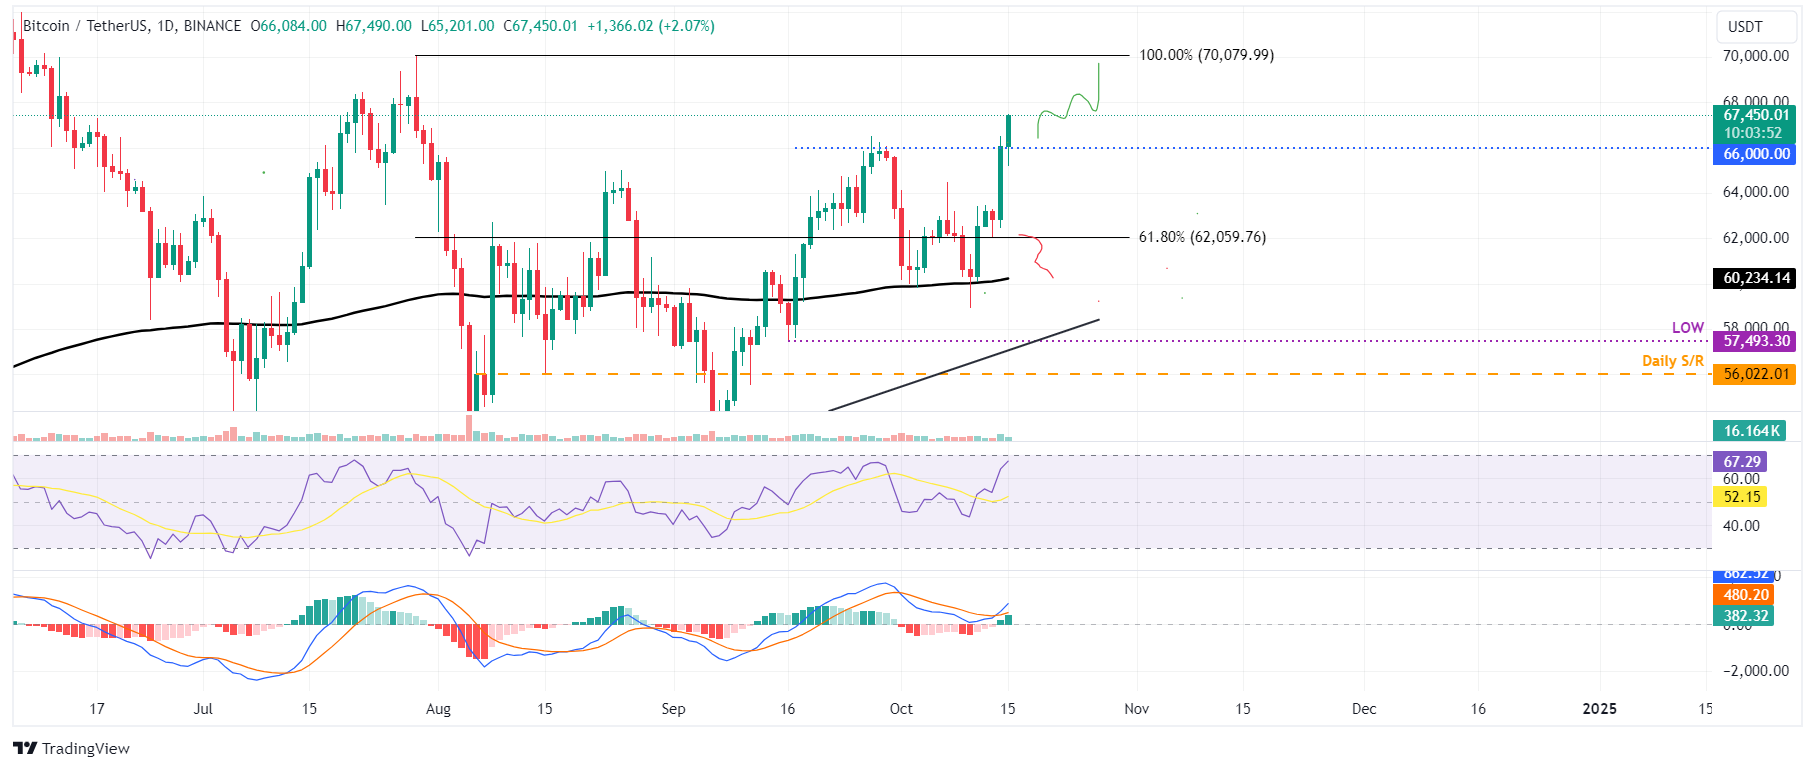
BTC/USDT daily chart
However, if Bitcoin fails to close above the $66,000 level and declines to close below $62,000, it could extend the decline by 3% and retest its 200-day EMA at around $60,000.
Bitcoin, altcoins, stablecoins FAQs
Bitcoin is the largest cryptocurrency by market capitalization, a virtual currency designed to serve as money. This form of payment cannot be controlled by any one person, group, or entity, which eliminates the need for third-party participation during financial transactions.
Altcoins are any cryptocurrency apart from Bitcoin, but some also regard Ethereum as a non-altcoin because it is from these two cryptocurrencies that forking happens. If this is true, then Litecoin is the first altcoin, forked from the Bitcoin protocol and, therefore, an “improved” version of it.
Stablecoins are cryptocurrencies designed to have a stable price, with their value backed by a reserve of the asset it represents. To achieve this, the value of any one stablecoin is pegged to a commodity or financial instrument, such as the US Dollar (USD), with its supply regulated by an algorithm or demand. The main goal of stablecoins is to provide an on/off-ramp for investors willing to trade and invest in cryptocurrencies. Stablecoins also allow investors to store value since cryptocurrencies, in general, are subject to volatility.
Bitcoin dominance is the ratio of Bitcoin's market capitalization to the total market capitalization of all cryptocurrencies combined. It provides a clear picture of Bitcoin’s interest among investors. A high BTC dominance typically happens before and during a bull run, in which investors resort to investing in relatively stable and high market capitalization cryptocurrency like Bitcoin. A drop in BTC dominance usually means that investors are moving their capital and/or profits to altcoins in a quest for higher returns, which usually triggers an explosion of altcoin rallies.
Recommended Articles


