

BNB Price Faces 12% Potential Decline Amid Strong Downtrend
BNB’s price has dropped by 8.72% over the past week, signaling a significant downturn for the coin. The recent price action suggests that bearish momentum is building, with technical indicators pointing to further potential downside.
Key levels of support and resistance are now crucial, as BNB hovers near important price points that could either stabilize the decline or lead to more losses.
BNB Current Trend Is Strong
BNB’s price has declined by 8.72% over the past seven days, reflecting significant downward pressure on the token. This is interesting because there was hype surrounding the release of Changpeng Zhao, Binance’s founder. However, it doesn’t seem to have moved the needle on BNB’s price.
This decline is further supported by its ADX (Average Directional Index), which currently reads 40.88.
The ADX measures the strength of a trend, regardless of its direction, and a value above 25 signals the presence of a trend, while values over 40 indicate a very strong trend. In BNB’s case, an ADX of 40.88 points to a solid and growing downtrend, suggesting that the bearish momentum is gaining strength.
Read more: How To Buy BNB and Everything You Need To Know
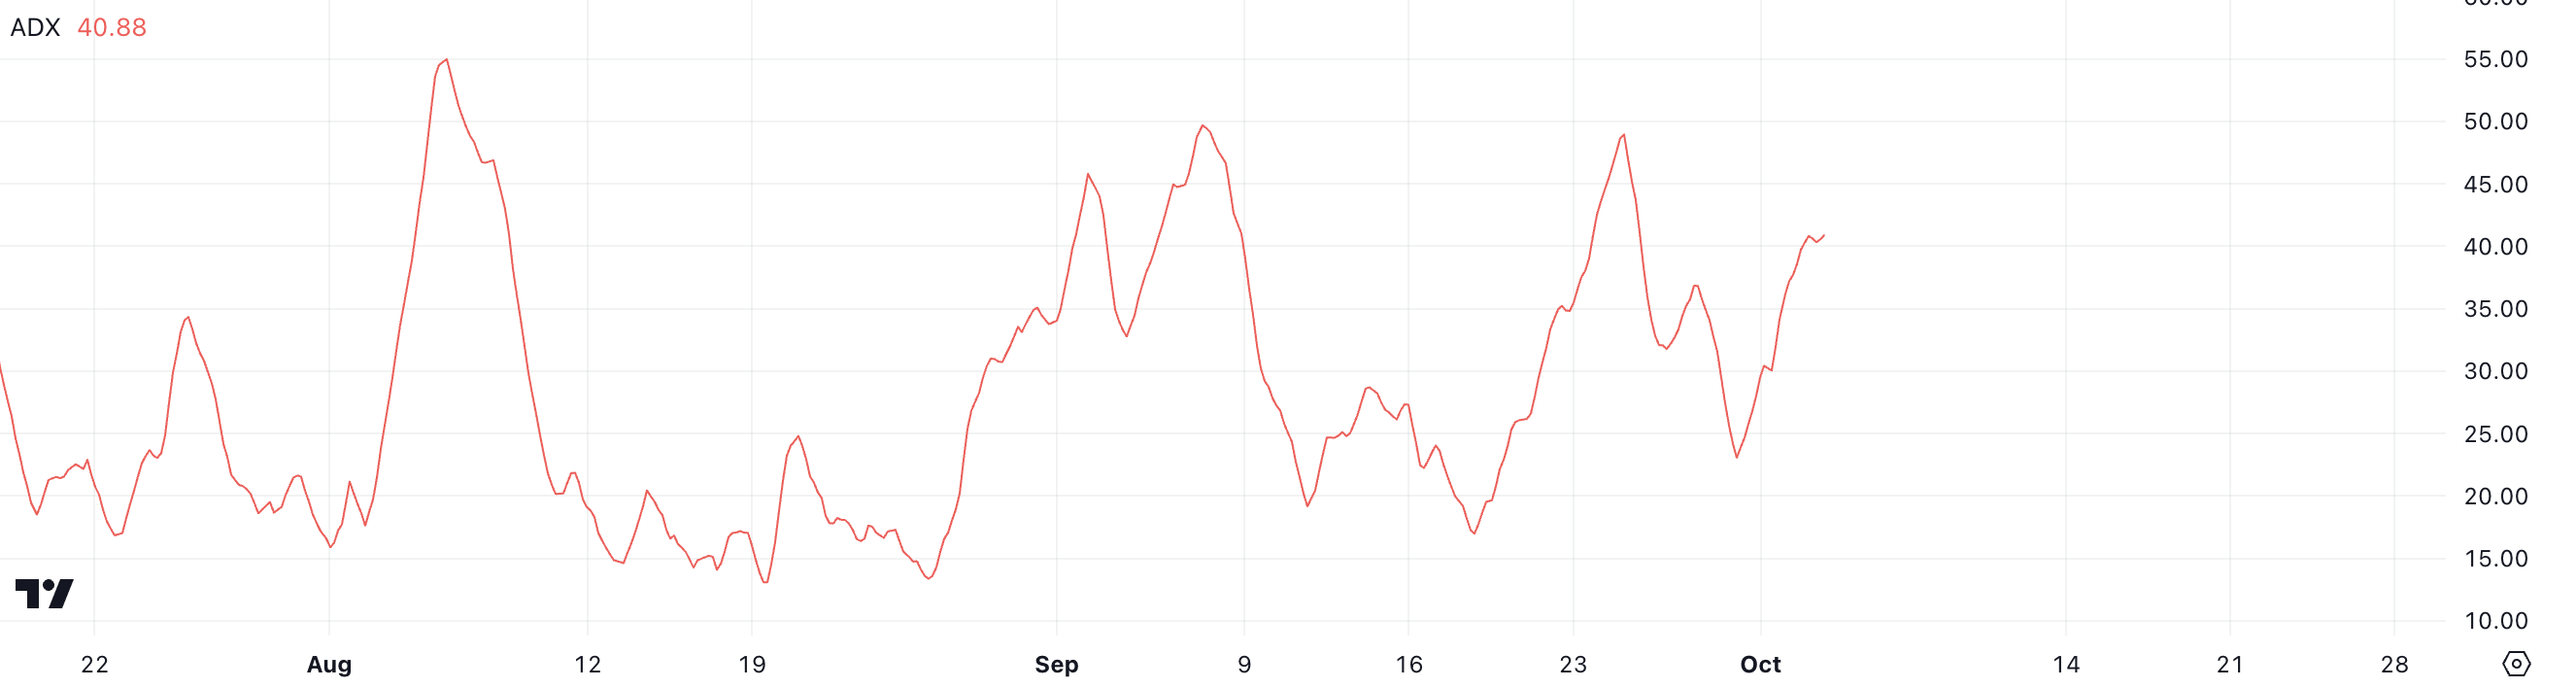 BNB ADX. Source: TradingView
The ADX helps traders assess whether the market is trending strongly or not — values between 20 and 25 typically indicate a weak or uncertain trend, while anything over 25 confirms a clear trend direction. On September 30, BNB’s ADX was at 22, indicating a fairly mild trend at that time.
However, the sharp increase to 40.88 in just a few days demonstrates that the bearish momentum has significantly strengthened, signaling that the selling pressure has accelerated and the market sentiment has become decidedly negative.
BNB Ichimoku Cloud Shows The Downtrend Is Here
Looking at the Ichimoku Cloud for BNB, the price action shows signs of weakness and continuation of the downtrend. BNB has broken below the Kumo (cloud), which is a strong bearish signal, indicating that sellers are in control. The Ichimoku Cloud serves as both a support and resistance area, and with the price trading below it, this reinforces bearish sentiment.
Additionally, the leading span (Senkou Span A and B) forms the cloud ahead, which appears to be widening slightly with a downward slope. This widening cloud suggests that future resistance is strengthening, making it harder for BNB to break back above the cloud.
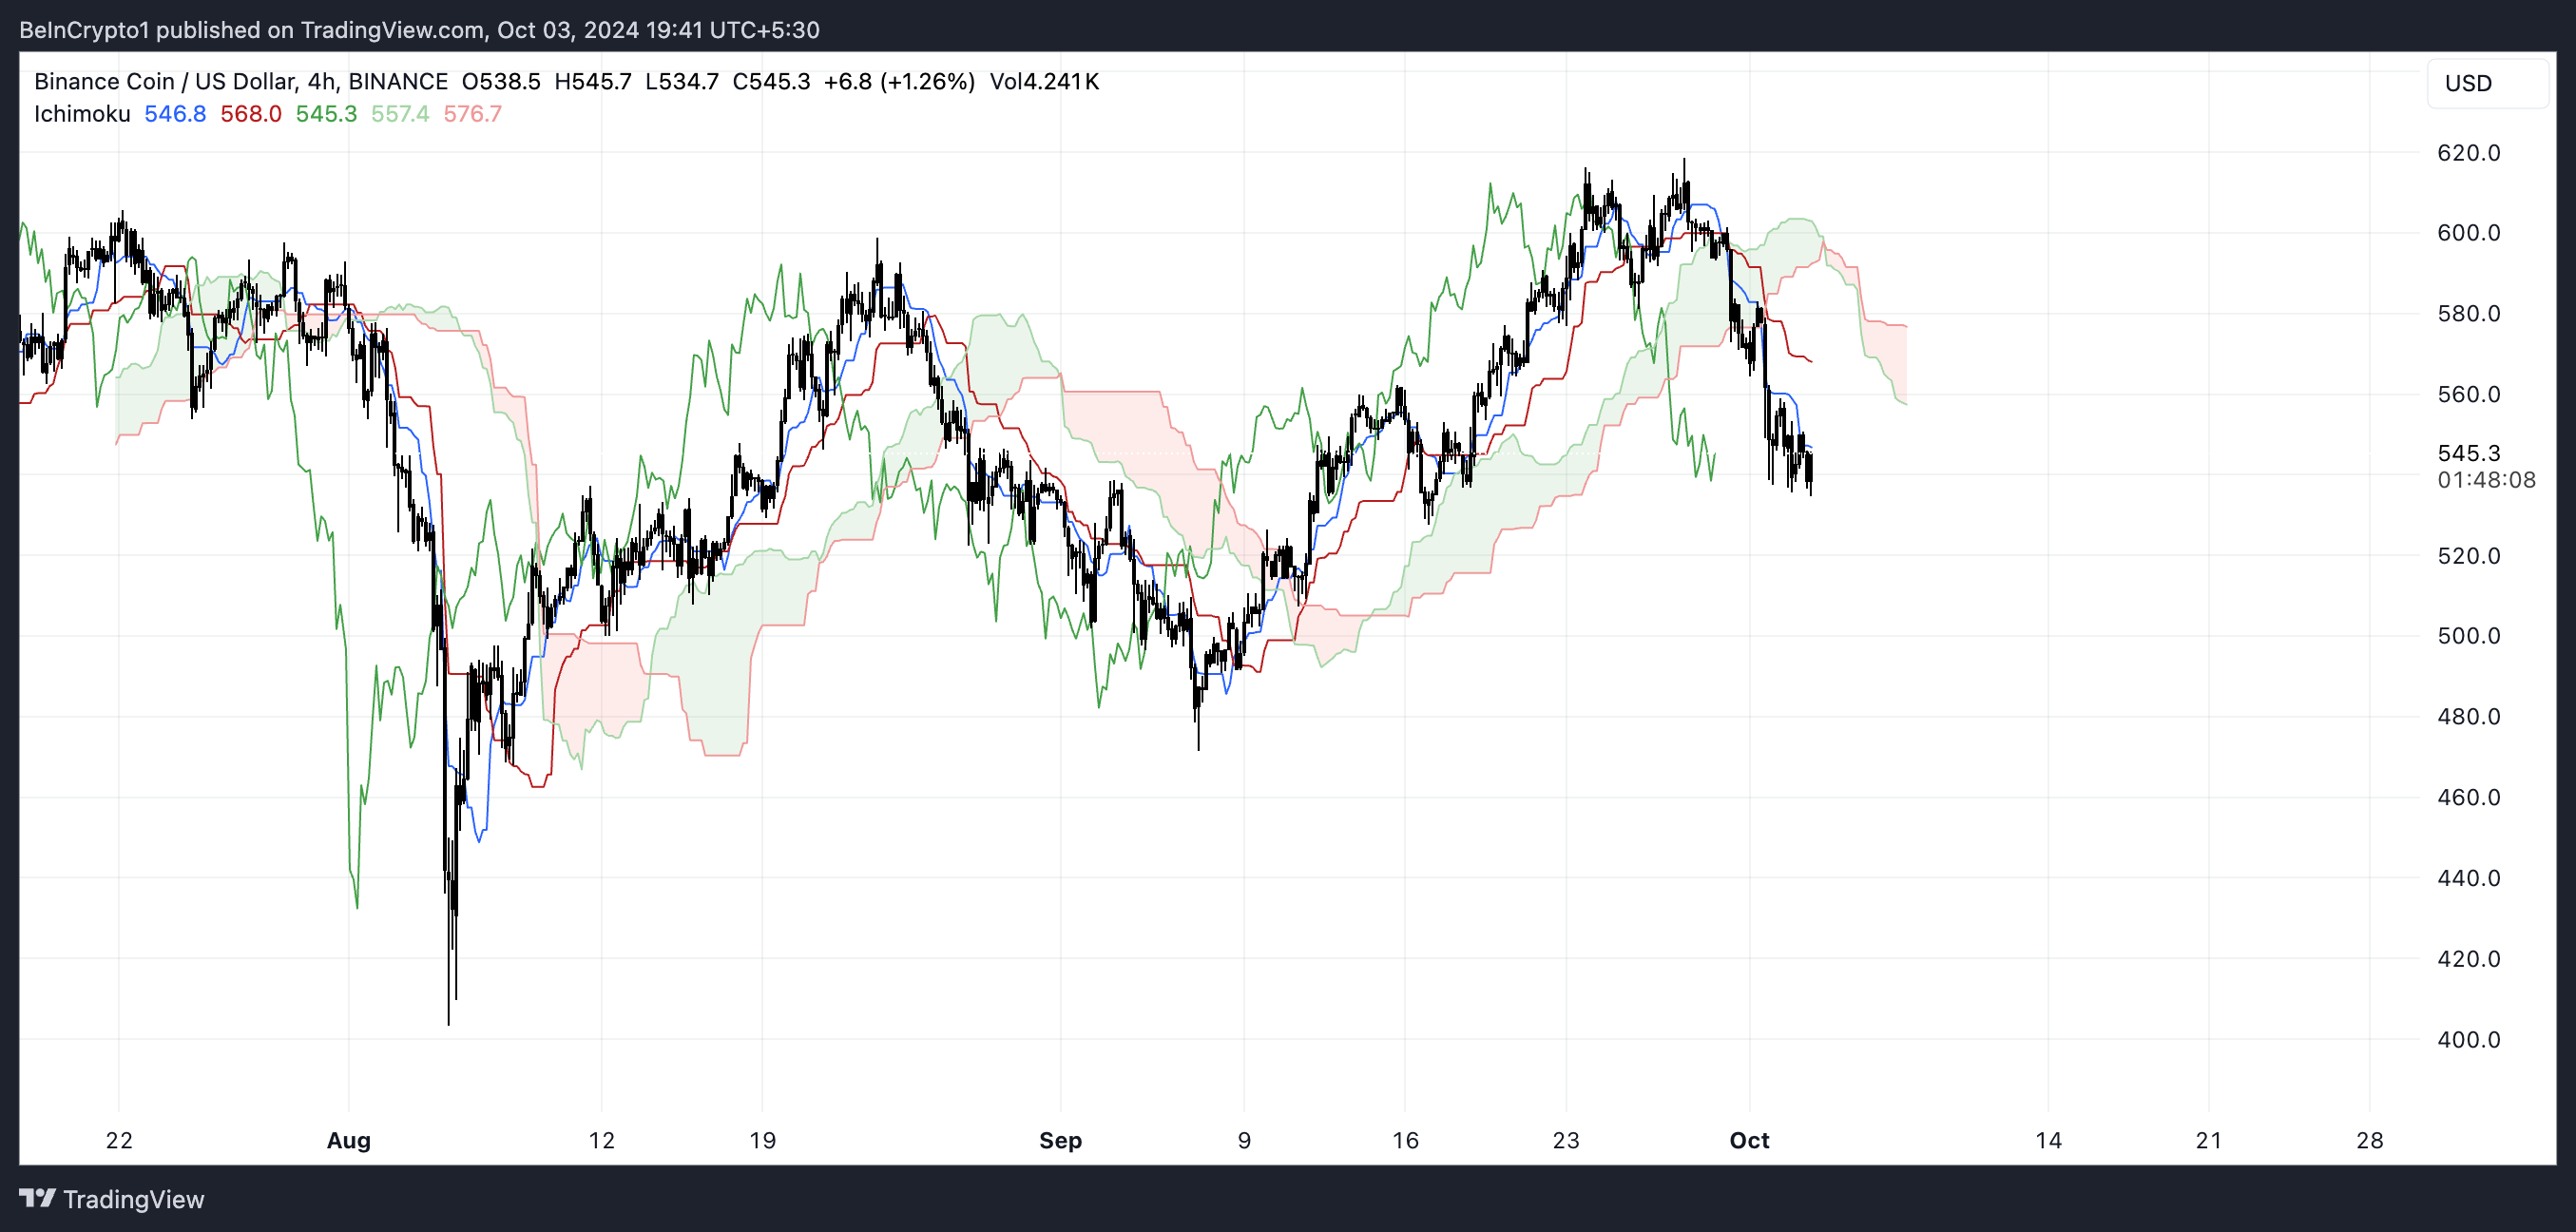 BNB Ichimoku Cloud. Source: TradingView
The Tenkan-sen (blue line) has crossed below the Kijun-sen (red line), another bearish signal known as a “bearish crossover,” which further confirms the downward trend. These two lines can act as dynamic support and resistance levels, and as long as the price stays below them, the downtrend remains intact.
The Chikou Span (green line) is also below the price from 26 periods ago, reinforcing that the current market sentiment is bearish. Overall, with BNB breaking below key Ichimoku levels and the cloud acting as overhead resistance, the chart suggests that BNB is likely to continue its downtrend unless a significant reversal occurs.
BNB Price Prediction: Potential 12% Correction Coming
BNB’s short-term EMA lines have just crossed below its long-term EMA lines, forming a “death cross”. That is a strong bearish indicator often associated with a potential market downturn. The death cross typically signals a transition from bullish momentum to bearish momentum as the shorter-term price trend weakens and dips below the long-term trend.
EMA, or Exponential Moving Average, lines are technical indicators that smooth out price fluctuations by giving more importance to recent price data. This allows traders to assess the current market direction better. In the case of BNB, this crossover suggests that selling pressure is intensifying, and the token could see further downside in the near term.
At present, BNB is testing a strong support level at $527, which is crucial for holding off further declines. If this support fails, there is a possibility of a deeper correction, with the price potentially falling to $471, representing a further 12% drop from current levels.
Read more: BNB: A Comprehensive Guide to What It Is and How It Works
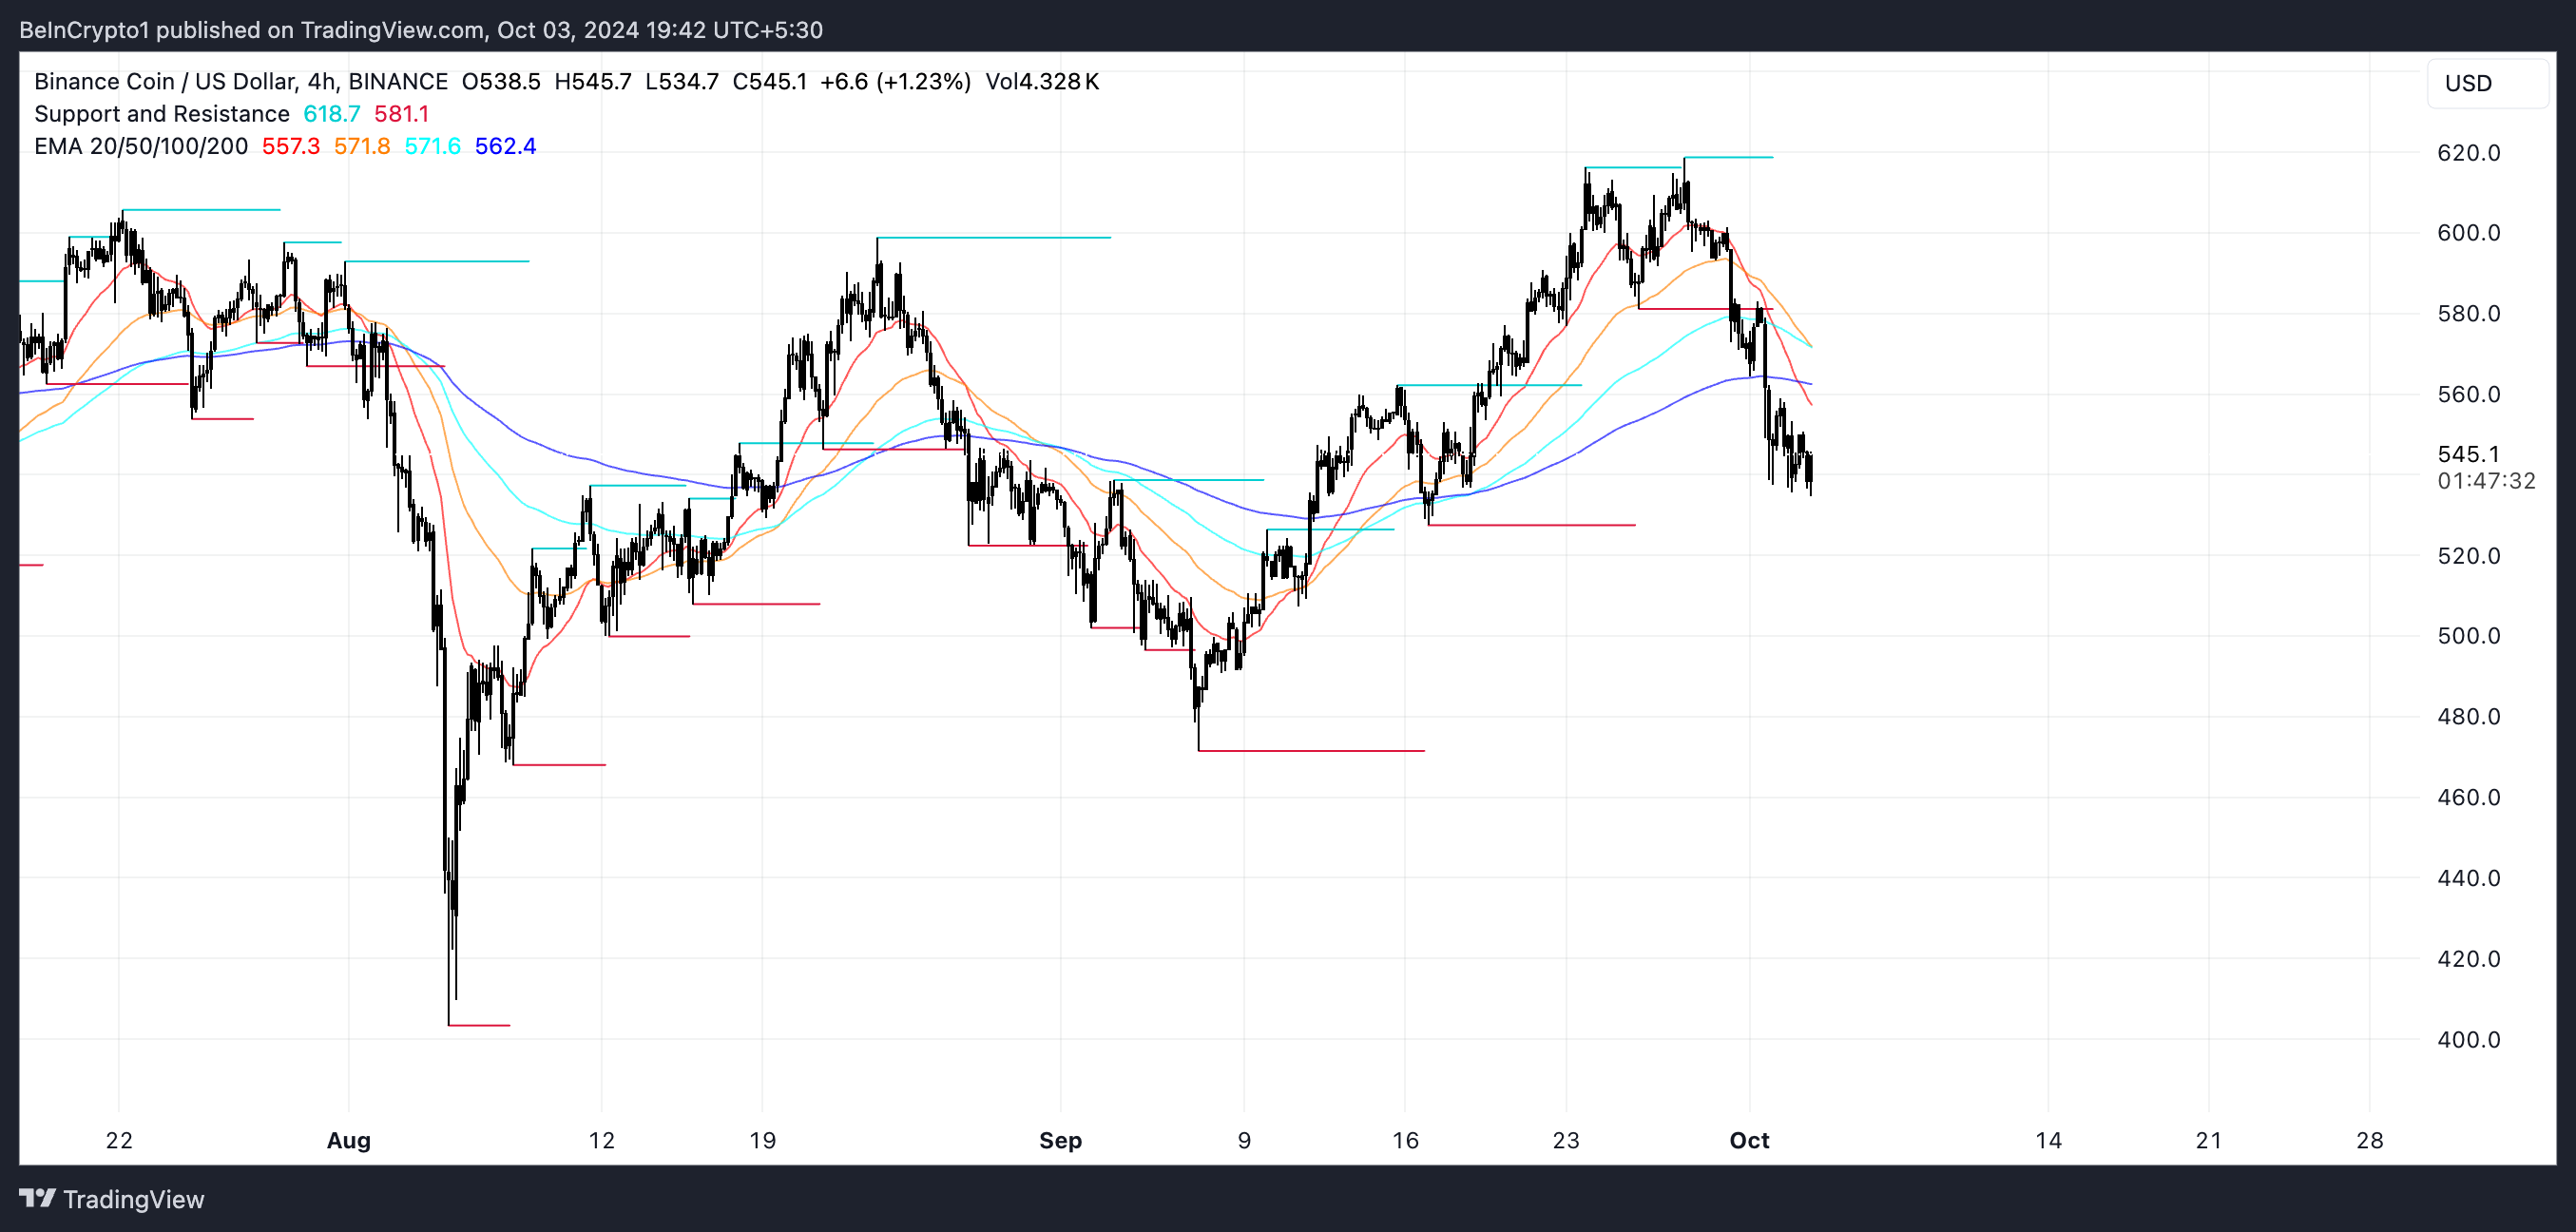 BNB EMA Lines and Support and Resistance. Source: TradingView
Such a move would reflect sustained bearish momentum and could attract more selling activity. However, if buyers step in and the market sentiment shifts, BNB has the potential to reverse its current downtrend.
In that case, the first major resistance would be at $562, and a break above this level could propel the price to test the next significant resistance at $598, offering a potential gain of 11.7%. This pivot point will be key for traders watching for either a bearish continuation or a possible bullish recovery.
Recommended Articles


