

XRP corrects even as Ripple CEO Brad Garlinghouse raises crypto market cap prediction to $5 trillion
- XRP fails to close above $0.6500, a key psychological barrier for the altcoin’s holders.
- Ripple CEO Brad Garlinghouse offers his $5 trillion prediction for the market capitalization of crypto in 2024.
- XRP trips down to $0.6274, corrects 2% on Monday.
Ripple (XRP) made an unsuccessful attempt to close above $0.6500 on Monday, a key level for the altcoin. XRP held steady above $0.6500 early on Monday and corrected to $0.6274 later. The top Ripple executive made headlines for comments on the market capitalization of crypto expanding.
Daily Digest Market Movers: Ripple CEO raises prediction for end of year growth in crypto market cap
- Ripple CEO Brad Garlinghouse made headlines for his optimism on the growth in crypto market capitalization. During the Consensus 2024 event, Garlinghouse said that a gain in crypto market cap is inevitable and set a target of $5 trillion.
- In a recent interview with Fox Business, Garlinghouse said that he may have understated the end-of-year market cap for cryptos.
Breaking News: Brad Garlinghouse raises his 5 Trillion into crypto by the end of the year!
— Ripple Van Winkle | Crypto Researcher (@RipBullWinkle) September 30, 2024
Regulations and policy are coming
Listen to this! #xrp
pic.twitter.com/IGNJRdAaIQ
- Garlinghouse and Ripple co-founder Chris Larsen are reportedly attending an annual fintech conference. The Federal Reserve Bank of Philadelphia’s event is slated to occur on October 22 and October 23 and other notable attendees include Coinbase’s Chief Legal Officer, Paul Grewal.
- The Ripple lawsuit and whether the Securities & Exchange Commission chooses to appeal the final ruling is the other key market mover for the altcoin on Monday.
Technical analysis: XRP eyes return above $0.6602
Ripple (XRP) noted a decline from its July 2023 top of $0.9380 to the July 2024 low of $0.3823, as seen in the XRP/USDT daily chart. It appears that the altcoin has ended its downward trend on September 28, closing above $0.6138.
XRP trades at $0.6232 at the time of writing, and the altcoin could rally 5.8% to hit its $0.6602 target. This target coincides with the 50% Fibonacci retracement of the decline between July 2023 and 2024.
The momentum indicator supports the bullish thesis. The Moving Average Convergence Divergence (MACD) shows green histogram bars above the neutral line.
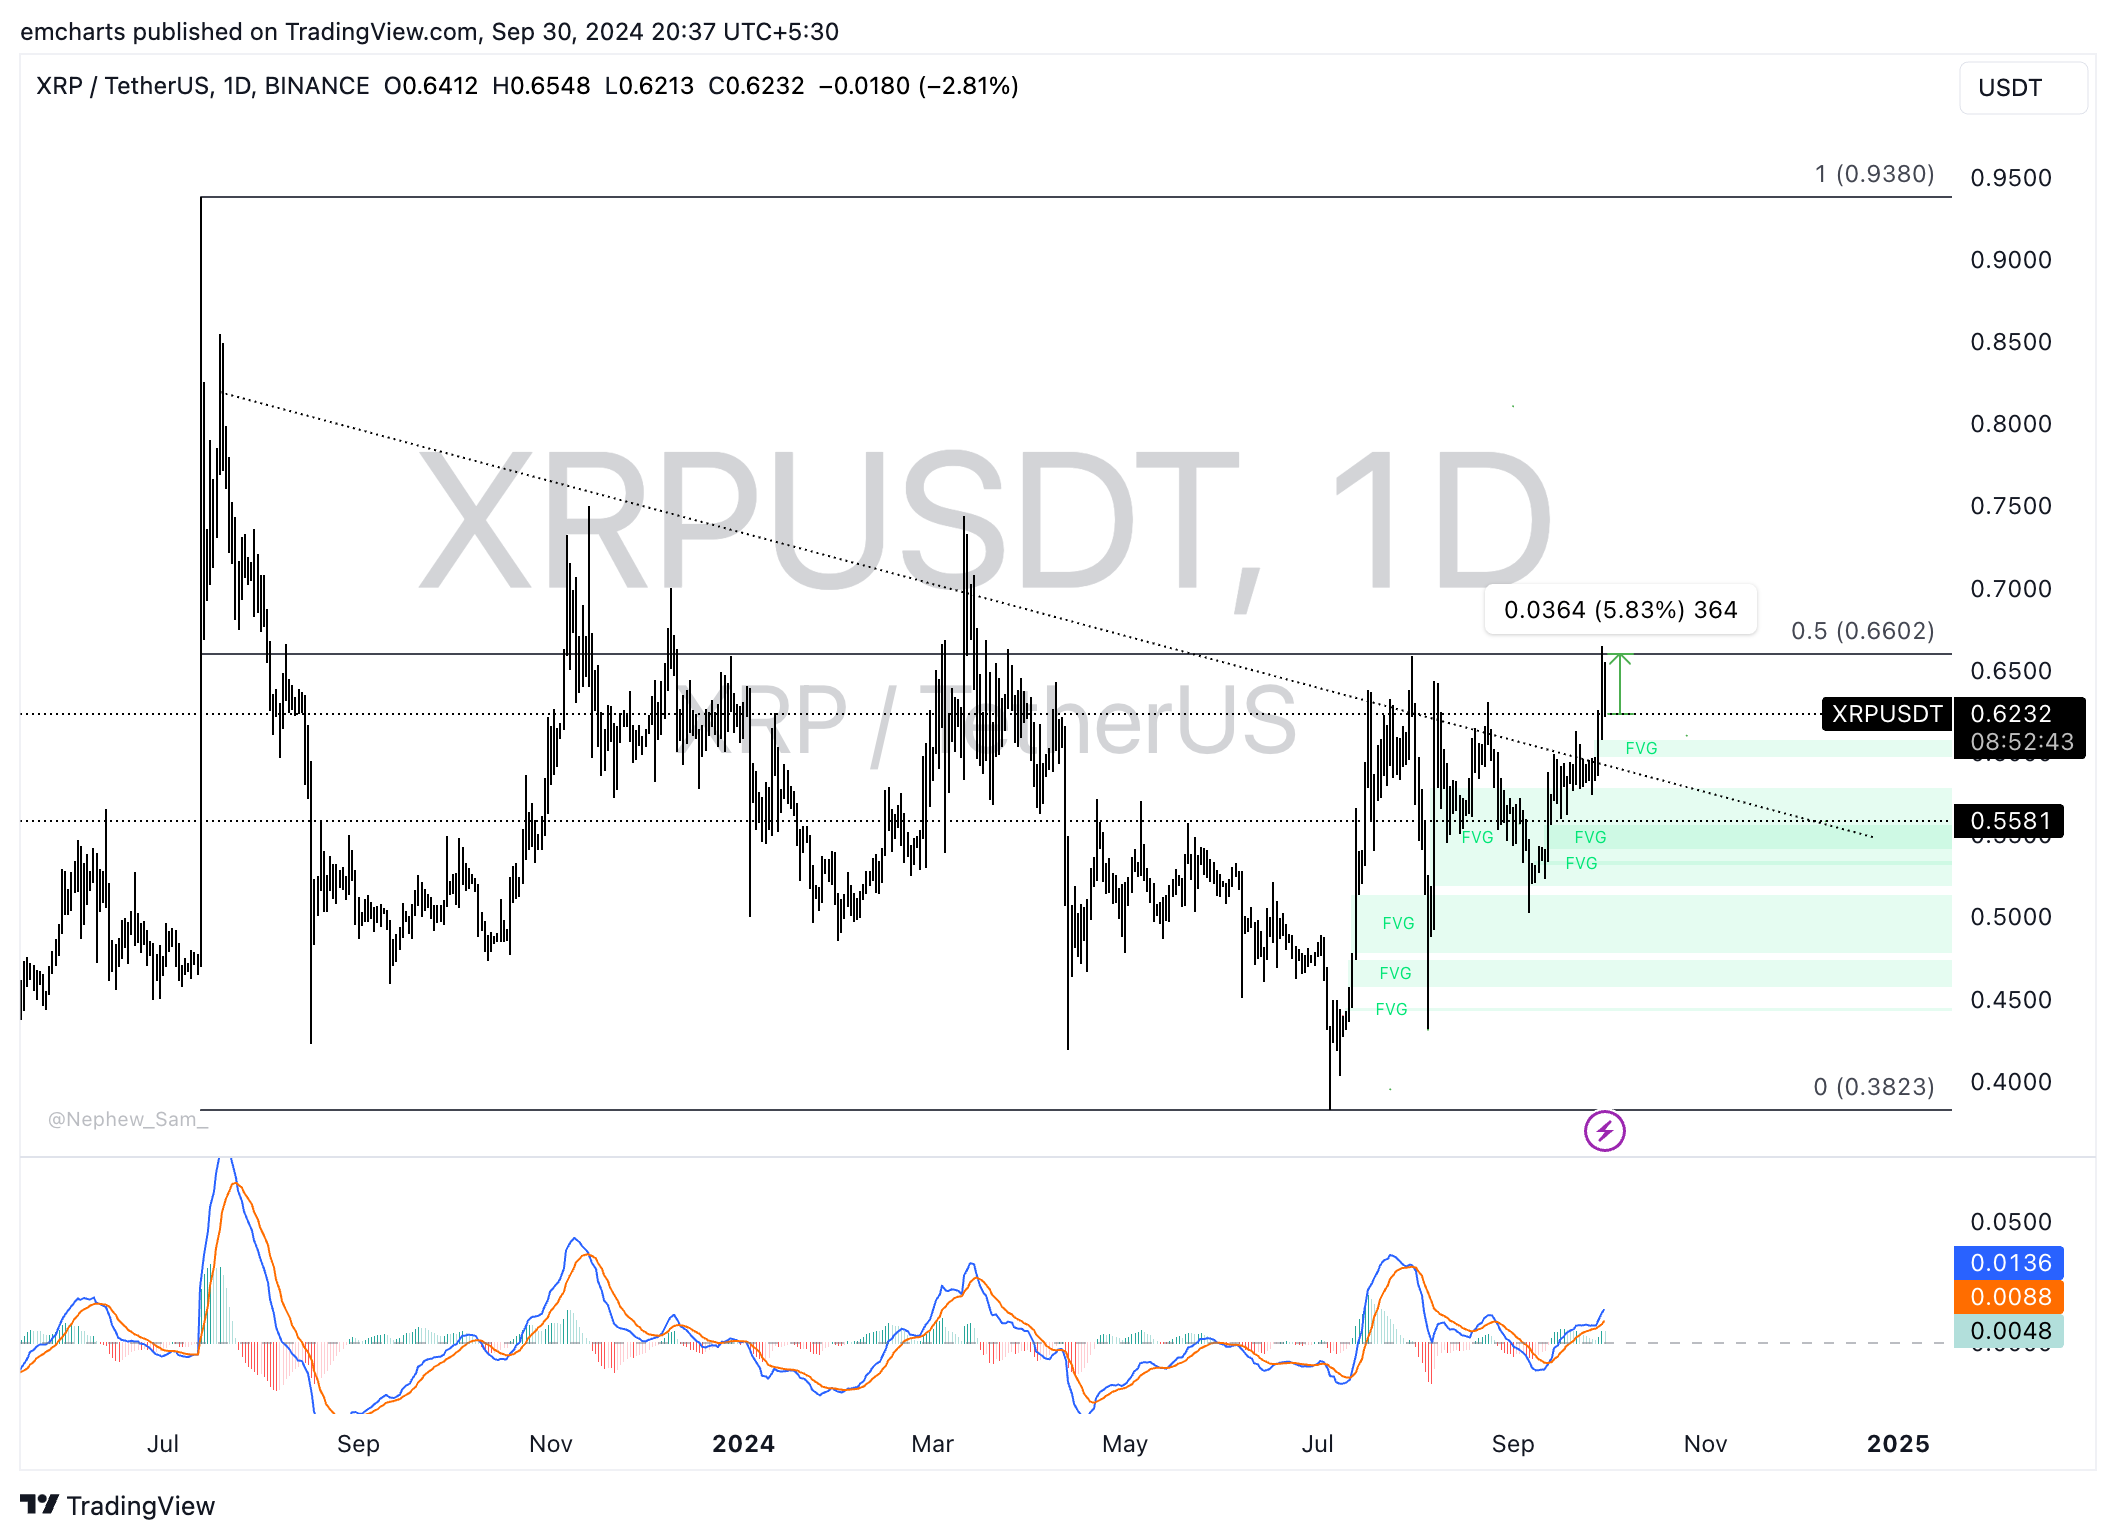
XRP/USDT daily chart
XRP could find support in the Fair Value Gap (FVG) between $0.5972 and $0.6076. The imbalance zones are important for XRP traders as the altcoin is likely to sweep these levels to collect liquidity.
Bitcoin, altcoins, stablecoins FAQs
Bitcoin is the largest cryptocurrency by market capitalization, a virtual currency designed to serve as money. This form of payment cannot be controlled by any one person, group, or entity, which eliminates the need for third-party participation during financial transactions.
Altcoins are any cryptocurrency apart from Bitcoin, but some also regard Ethereum as a non-altcoin because it is from these two cryptocurrencies that forking happens. If this is true, then Litecoin is the first altcoin, forked from the Bitcoin protocol and, therefore, an “improved” version of it.
Stablecoins are cryptocurrencies designed to have a stable price, with their value backed by a reserve of the asset it represents. To achieve this, the value of any one stablecoin is pegged to a commodity or financial instrument, such as the US Dollar (USD), with its supply regulated by an algorithm or demand. The main goal of stablecoins is to provide an on/off-ramp for investors willing to trade and invest in cryptocurrencies. Stablecoins also allow investors to store value since cryptocurrencies, in general, are subject to volatility.
Bitcoin dominance is the ratio of Bitcoin's market capitalization to the total market capitalization of all cryptocurrencies combined. It provides a clear picture of Bitcoin’s interest among investors. A high BTC dominance typically happens before and during a bull run, in which investors resort to investing in relatively stable and high market capitalization cryptocurrency like Bitcoin. A drop in BTC dominance usually means that investors are moving their capital and/or profits to altcoins in a quest for higher returns, which usually triggers an explosion of altcoin rallies.
Recommended Articles


