

Arbitrum price prediction 2024 – 2030: ARB breaks key barrier
Key takeaways:
- Our ARB predictions anticipate a high of $0.765 by the end of 2024.
- In 2025, it will range between $0.7811 and $0.9455, with an average price of $0.8037.
- In 2030, it will range between $5.87 and $6.95, with an average price of $6.08.
Layer 2s have made quite a buzz over the last few months because of their high network activity. Arbitrum led the Layer 2 pack with a total value locked (TVL) of $2.888 billion. Arbitrum is an Optimistic Rollup solution that shifts network operations away from the Ethereum mainnet while maintaining Ethereum-level security.
Arbitrum’s BOLD testnet also went live; when integrated into the mainnet, the update will enable permissionless validation on Arbitrum. This means that anyone can challenge the state of the Arbitrum network. Currently, validators are allow-listed.
Is Arbitrum a good investment? Will it go up? Where will it be in 5 years? Let’s answer these questions and more in our Arbitrum price prediction.
Overview
| Cryptocurrency | Arbitrum |
| Ticker | ARB |
| Current price | $0.6503 |
| Market cap | $2.352 billion |
| Trading volume | $317.13 million |
| Circulating supply | 3,617,088,312 |
| All-time high | $2.40 on Jan 12, 2024 |
| All-time low | $0.43 on Aug 5, 2024 |
| 24-hour high | $0.6656 |
| 24-hour low | $0.6114 |
Arbitrum price prediction: Technical analysis
| Metric | Value |
| Volatility (30-day variation) | 7.19% |
| 50-day SMA | $0.5554 |
| 200-day SMA | $1.0783 |
| Sentiment | Bullish |
| Fear and Greed Index | 61 (Greed) |
| Green days | 18/30 (60%) |
Arbitrum price analysis:
Arbitrum analysis for September 27:
In a voting proposal earlier last week, TreasureDAO revealed plans to migrate its web3 gaming ecosystem from Arbitrum to ZKsync, needing more support from the ecosystem. According to DappRadar, Treasure was the largest gaming protocol on Arbitrum, with a TVL of 6.42 M, and its migration would have a huge impact on the network.
The proposal has coincided with a significant drop in dApp activity on Arbitrum, which has since recovered, rising by 114.79% in the last 7 days. Data from Coingecko showed that Arbitrum was the largest layer-2 network by TVL.
Arbitrum’s price has consistently dropped from earlier highs in March; on the contrary, the blockchain’s total value locked (TVL) has been rising, i.e., by over 50% since January.
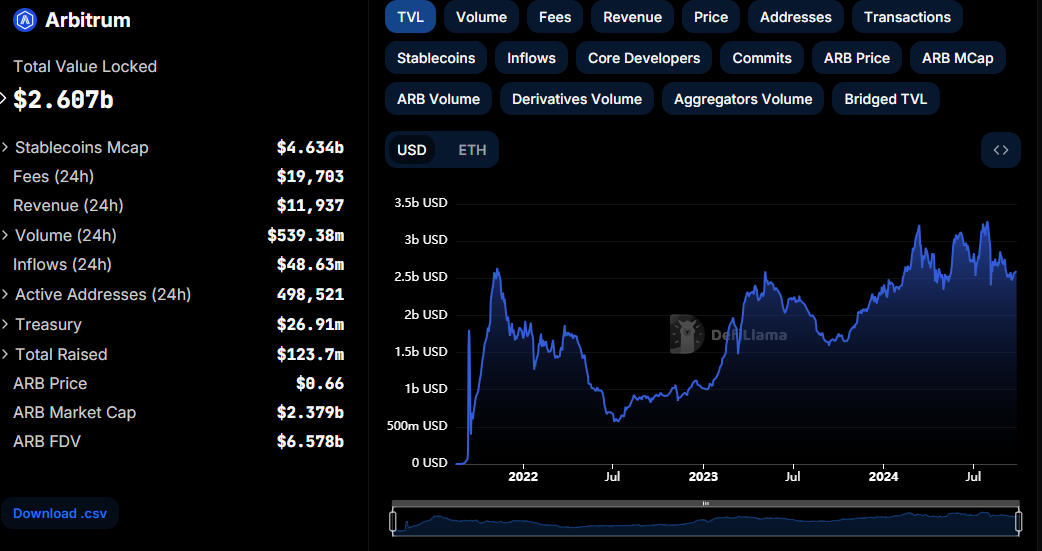
Arbitrum TVL. Source: Defillama
According to data from Coinglass, Arbitrum’s Open Interest has dropped consistently with its price. This signals a bearish market sentiment as traders pull out their investments, decreasing market activity and asset value.
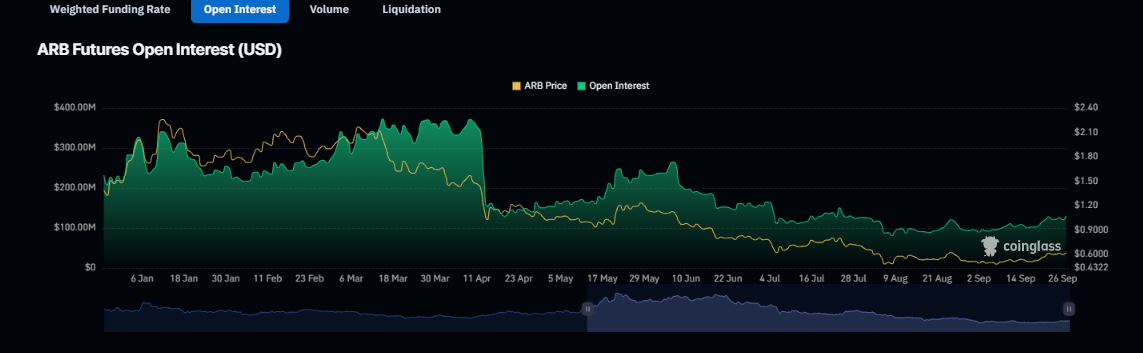
Arbitrum Open Interest. Source: Coinglass.
Arbitrum 1-day price analysis
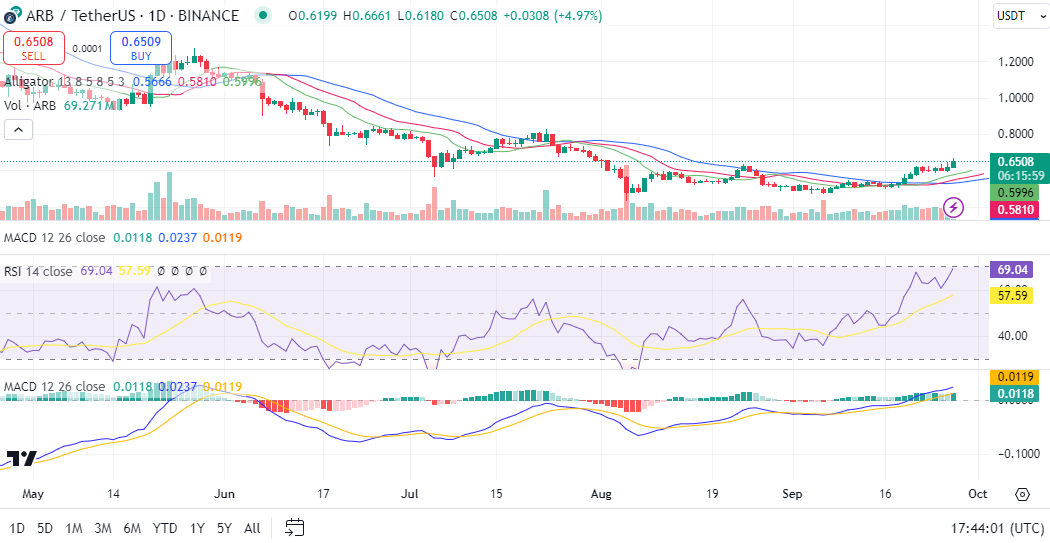
ARB/USD chart. Source: TradingView
Arbitrum has maintained a constant bear run since March. So far, it has lost over half its value from the year’s high. It made another bearish break out earlier last month as it fell below the $0.6 support. Earlier this week, it reversed the trend as it broke above the moving average, reaching as high as $.67
Arbitrum trades within a parallel channel with bullish momentum in play. The uptrend is strengthening as ARB rises above the channel’s upper boundary, with the MACD trendlines forming a bullish crossover.
The Relative Strength Index (RSI) was 69.04, indicating buyers had the upper hand, pushing the price closer to overbought territory.
For ARB to invalidate the bullish thesis, it must reclaim below $0.48 for a bearish breakout below the lower trendline.
The uptick in network activity could support a bullish scenario.
Arbitrum technical indicators: Levels and action
Daily simple moving average (SMA)
| Period | Value ($) | Action |
| SMA 3 | 0.5941 | BUY |
| SMA 5 | 0.5869 | BUY |
| SMA 21 | 0.5589 | BUY |
| SMA 50 | 0.5554 | BUY |
| SMA 100 | 0.6402 | BUY |
| SMA 200 | 1.0783 | SELL |
Daily exponential moving average (EMA)
| Period | Value ($) | Action |
| EMA 3 | 0.5540 | BUY |
| EMA 5 | 0.5478 | BUY |
| EMA 10 | 0.5482 | BUY |
| EMA 21 | 0.5688 | BUY |
| EMA 50 | 0.6484 | BUY |
| EMA 100 | 0.7970 | SELL |
| EMA 200 | 0.9951 | SELL |
Is Arbitrum a good investment?
Arbitrum is a leading Layer 2 blockchain with an impressive TVL. The network also achieves development milestones, like quadrupling transactions after integrating EIP-4844, which cuts transaction costs by 90%. Despite a gloomy month, price predictions suggest a different narrative.
Why is Arbitrum down?
Arbitrum’s current drop is inconsistent with the network’s activity. This year’s drop in coin prices is consistent with the drop in crypto market valuation.
Will Arbitrum recover?
Arbitrum has formed a new ATL and indicates the potential to drop lower; despite this, network participation has remained consistently high, and as a result, Daily active addresses (DAA) have remained relatively high. This suggests AR will eventually recover. These indicators point to an eventual recovery.
Will Arbitrum reach $1?
According to Cryptopolitan price predictions, ARB will trade at $1 in 2026.
Will Arbitrum reach $10?
According to Cryptopolitan price predictions, it is unlikely that ARB will trade at $10 in the period ending in 2030.
Will Arbitrum reach $100?
According to Cryptopolitan price predictions, it is unlikely that ARB will trade at $100 in the period ending in 2030.
Does Arbitrum have a good long-term future?
A high adoption rate is crucial for any blockchain’s long-term success and sustainability. Arbitrum’s performance in this regard is a positive sign of its future performance despite the price declines.
Recent news: First Pancake IFO launches on Arbitrum network
PancakeSwap has launched its first-ever Initial Farm Offering (IFO) on the Arbitrum network. This offering spotlights Eigenpie, a Liquid Restaking Protocol on EigenLayer with over $1B TVL, marking an important step in PancakeSwap’s ongoing expansion.
ARB price prediction September 2024
The Arbitrum price forecast in September is a maximum price of $0.614 and a minimum price of $0.482. The average price for the month will be $0.512.
| Month | Potential low ($) | Potential average ($) | Potential high ($) |
| September | 0.482 | 0.512 | 0.614 |
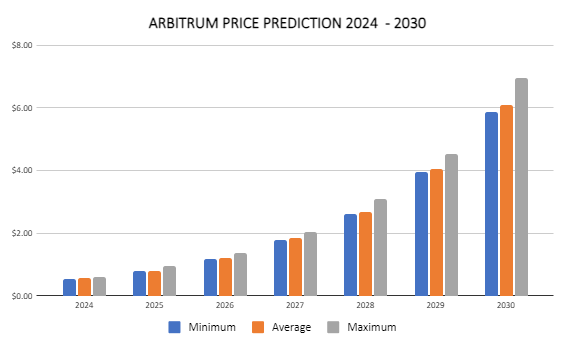
ARB price prediction 2024
For the last quarter of 2024, ARB’s price will range between $0.584 and $0.749. The average price for the period will be $0.718.
| Year | Potential low ($) | Potential average ($) | Potential high ($) |
| 2024 | 0.482 | 0.718 | 0.765 |
Arbitrum price predictions 2025-2030
| Year | Potential low ($) | Potential average ($) | Potential high ($) |
| 2025 | 0.7811 | 0.8037 | 0.9455 |
| 2026 | 1.18 | 1.21 | 1.38 |
| 2027 | 1.77 | 1.83 | 2.05 |
| 2028 | 2.60 | 2.69 | 3.09 |
| 2029 | 3.95 | 4.06 | 4.53 |
| 2030 | 5.87 | 6.08 | 6.95 |
Arbitrum price prediction 2025
The Arbitrum price forecast for 2025 is a high of $0.9455. It will reach a minimum price of $0.7811 and an average price of $0.8037.
Arbitrum ARB price prediction 2026
The year 2026 will also be bullish. Our analysis estimates that it will range between $1.18 and $1.38, with an average price of $1.21.
Arbitrum price prediction 2027
Arbitrum’s price prediction climbs even higher into 2027. According to the prediction, ARB’s price will range between $1.77 and $2.05, with an average price of $1.83.
Arbitrum coin price prediction 2028
Our analysis indicates a further acceleration in ARB’s price. It will trade between $2.60 and $3.09 and an average price of $2.69.
Arbitrum price prediction 2029
According to the 2029 ARB price prediction, the price of ARB will range between $3.95 and $4.53, with an average price of $4.06.
ARB price prediction 2030
The ARB price prediction for 2030 indicates that the price will range between $5.87 and $6.95, with an average of $6.08.
ARB market price prediction: Analyst’s ARB price forecast
| Platform | 2024 | 2025 | 2026 |
| Digitalcoinprice | $0.99 | $1.21 | $1.66 |
| Changelly | $0.949 | $1.97 | $1.30 |
| Gate.io | $0.5132 | $0.6235 | $0.6703 |
Cryptopolitan’s ARB price prediction
Our predictions show that ARB will achieve a high of $0.765 in the remaining part of 2024. In 2025, it will range between $0.7811 and $0.9455, with an average of $0.8037. In 2030, it will range between $5.87 and $6.95, with an average of $6.08. Note the predictions are not investment advice. Seek independent professional consultation or do your research.
Arbitrum historic price sentiment
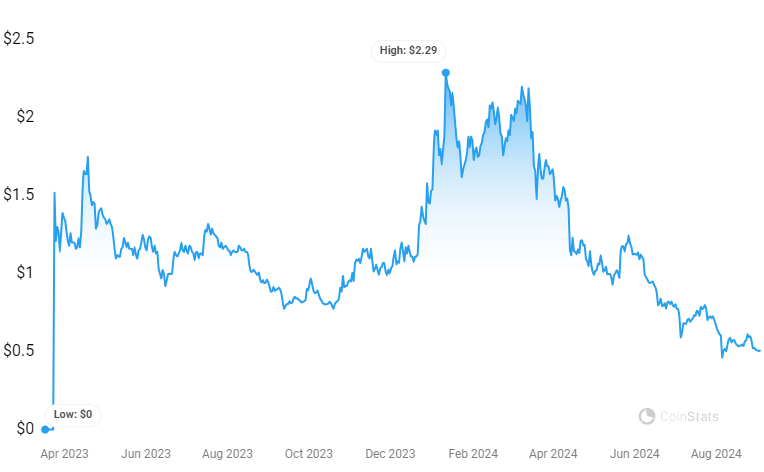
- The Arbitrum airdrop snapshot occurred on Feb 6, 2023, and eligible participants started claiming on Mar 23, 2023. The claiming period ended on Sep 24, 2023.
- The airdrop granted 11.5% of the total supply to eligible users, 1.1% to DAOs operating in the Arbitrum ecosystems, and 44% to employees and Offchain Labs investors. The 44% is subject to lock-up periods and a vesting schedule. The rest was sent to the Arbitrum DAO treasury.
- On Sep 11, 2023, it fell to its all-time low at $0.7453.
- Bitcoin halving and crypto ETF hype helped the coin recover from October. By the end of the year, it had risen to $1.4.
- The run continued into 2024. On Jan 12, it reached its all-time high at $2.40.
- Per Coinmarketcap data, ARB broke below its listing price in June 2024.
- On August 5, 2024, it registered a new all-time low of $0.4317
- It has since slowly recovered and trades at $0.5 mark.
Recommended Articles


