Chainlink Price Prediction: LINK poised for a move up as network powers tokenized RWAs at scale

Source Fxstreet
  • Chainlink price has recorded massive volatility since November, trading within a fixed range for all this time.
  • LINK could rise 5% to test the 78.6% Fibonacci level at $15.14, last tested on January 2.
  • The bullish thesis will be invalidated upon a daily candlestick close below the 61.8% Fibonacci level of $13.09.

Chainlink (LINK) price volatility remains visible on the daily timeframe, as the price moved horizontally within a wide but fixed range between the 50% and 100% Fibonacci levels of $11.66 and $17.74 respectively.

Also Read: Chainlink price gains could extend riding on bullish on-chain metrics

Chainlink powering RWA tokenization

Chainlink (LINK) price looks ready for a move north even as the network advertises as “The only platform that can power tokenized RWAs at scale. RWA abbreviates for Real World Assets, defining established commodities from traditional finance, tokenized and brought over into the DeFi space using blockchain technology.

Meanwhile, the Chainlink price may be poised for a 5% move north to test the 78.6% Fibonacci level at $15.14, with the Relative Strength Index (RSI) recording higher highs to show growing momentum. The histogram bars of the Awesome Oscillator (AO) are also gaining strength, evidence of the bulls gaining ground.

Enhance activity among LINK bulls could see Chainlink price overcome the aforementioned blockade, going as far as to clear the range high of $17.67, or in a highly bullish case, fill the market range at $17.74. This would constitute nearly 23% in gains above current levels.

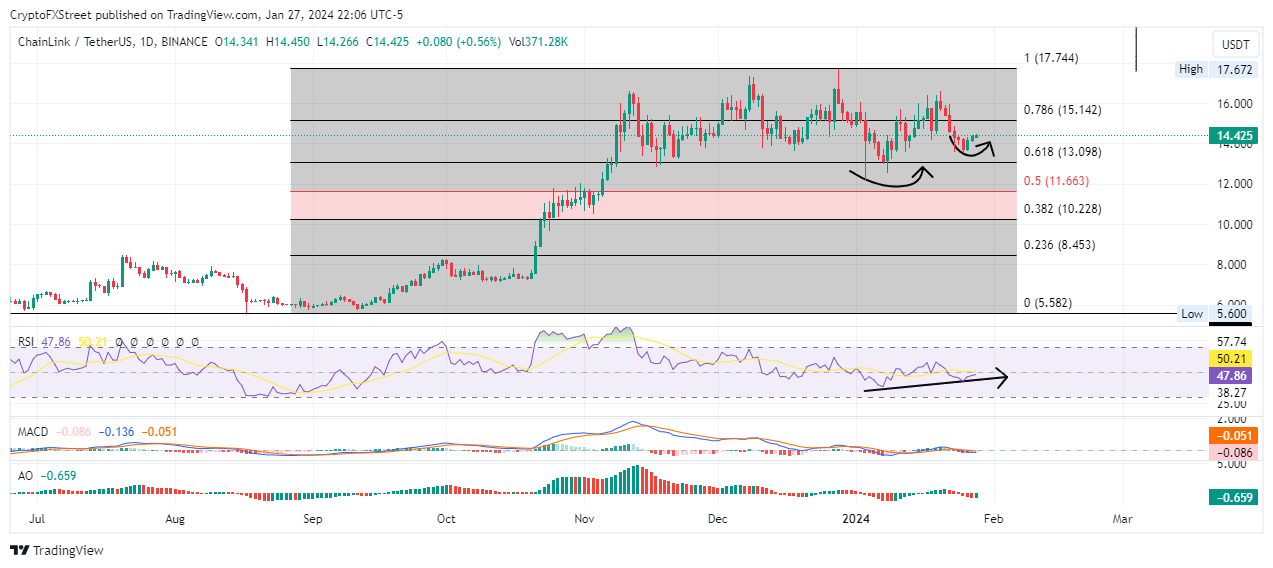
LINK/USDT 1-day chart

On the flipside, if LINK holders book profits for the 7% gains made over the last three days, the Chainlink price could descend, losing the support offered by the most critical Fibonacci level, 61.8% at $113.09.

In the dire case, it could extend the fall to the 50% Fibonacci level at $11.66, potentially breaking below the market range as it retraces the 38.2% Fibonacci at $10.22. This would denote a nearly 30% fall below current levels. 

Disclaimer: For information purposes only. Past performance is not indicative of future results.
placeholder
The dollar weakened, equities dipped, and gold hit record highsThe dollar weakened, equities fell, and gold set new records on Wednesday as investors waited for a Fed rate cut later in the day.
Author  Cryptopolitan
Sep 17, 2025
The dollar weakened, equities fell, and gold set new records on Wednesday as investors waited for a Fed rate cut later in the day.
placeholder
Markets in 2026: Will gold, Bitcoin, and the U.S. dollar make history again? — These are how leading institutions thinkAfter a turbulent 2025, what lies ahead for commodities, forex, and cryptocurrency markets in 2026?
Author  Insights
Dec 25, 2025
After a turbulent 2025, what lies ahead for commodities, forex, and cryptocurrency markets in 2026?
placeholder
ECB Policy Outlook for 2026: What It Could Mean for the Euro’s Next MoveWith the ECB likely holding rates steady at 2.15% and the Fed potentially extending cuts into 2026, EUR/USD may test 1.20 if Eurozone growth proves resilient, but weaker growth and an ECB pivot could pull the pair back toward 1.13 and potentially 1.10.
Author  Mitrade
Dec 26, 2025
With the ECB likely holding rates steady at 2.15% and the Fed potentially extending cuts into 2026, EUR/USD may test 1.20 if Eurozone growth proves resilient, but weaker growth and an ECB pivot could pull the pair back toward 1.13 and potentially 1.10.
placeholder
My Top 5 Stock Market Predictions for 2026Five 2026 market predictions written in a native, news-style voice: AI’s winners and losers, broader sector leadership, dividend demand, valuation cooling as the Shiller CAPE sits at 39 (Dec. 31, 2025), and quantum-computing bursts—while keeping all original facts and numbers unchanged.
Author  Mitrade
Jan 06, Tue
Five 2026 market predictions written in a native, news-style voice: AI’s winners and losers, broader sector leadership, dividend demand, valuation cooling as the Shiller CAPE sits at 39 (Dec. 31, 2025), and quantum-computing bursts—while keeping all original facts and numbers unchanged.
placeholder
Gold tumbles below $4,650 as inflation fears and liquidity squeeze weighGold price (XAU/USD) remains under selling pressure near $4,640 during the early Asian session on Friday. The precious metal extends the decline as soaring crude oil and energy prices, driven by the escalating US-Israeli war with Iran, reignite inflation fears.
Author  FXStreet
Mar 20, Fri
Gold price (XAU/USD) remains under selling pressure near $4,640 during the early Asian session on Friday. The precious metal extends the decline as soaring crude oil and energy prices, driven by the escalating US-Israeli war with Iran, reignite inflation fears.
Related Instrument
goTop
quote