

Bitcoin (BTC) Whales Cut Back on Holdings: Why It’s Not a Red Flag
Bitcoin’s (BTC) large holders have gradually reduced their coin holdings since the cryptocurrency reached a new high in March. While this may seem like a bearish signal, there’s no need for concern.
These major stakeholders are simply waiting strategically as the leading coin navigates ongoing volatility.
Bitcoin Large Holders Bide Their Time
In a September 11 post on X, blockchain analytics platform Santiment wrote that there has been a “noticeable drop-off” in crypto whale transactions since mid-August. The on-chain data provider noted a 33.6% decline in weekly BTC whale transactions valued above $100,000 since the coin surged to a new high in March.
For context, weekly transactions of $100,000 or more involving Bitcoin totaled 88,163 when the coin climbed to its new high in March. As its price dropped, the whales reduced their trading activity. By mid-August, this had declined to 58,539 Bitcoin whale transactions weekly.
Read more: 5 Best Platforms To Buy Bitcoin Mining Stocks After 2024 Halving
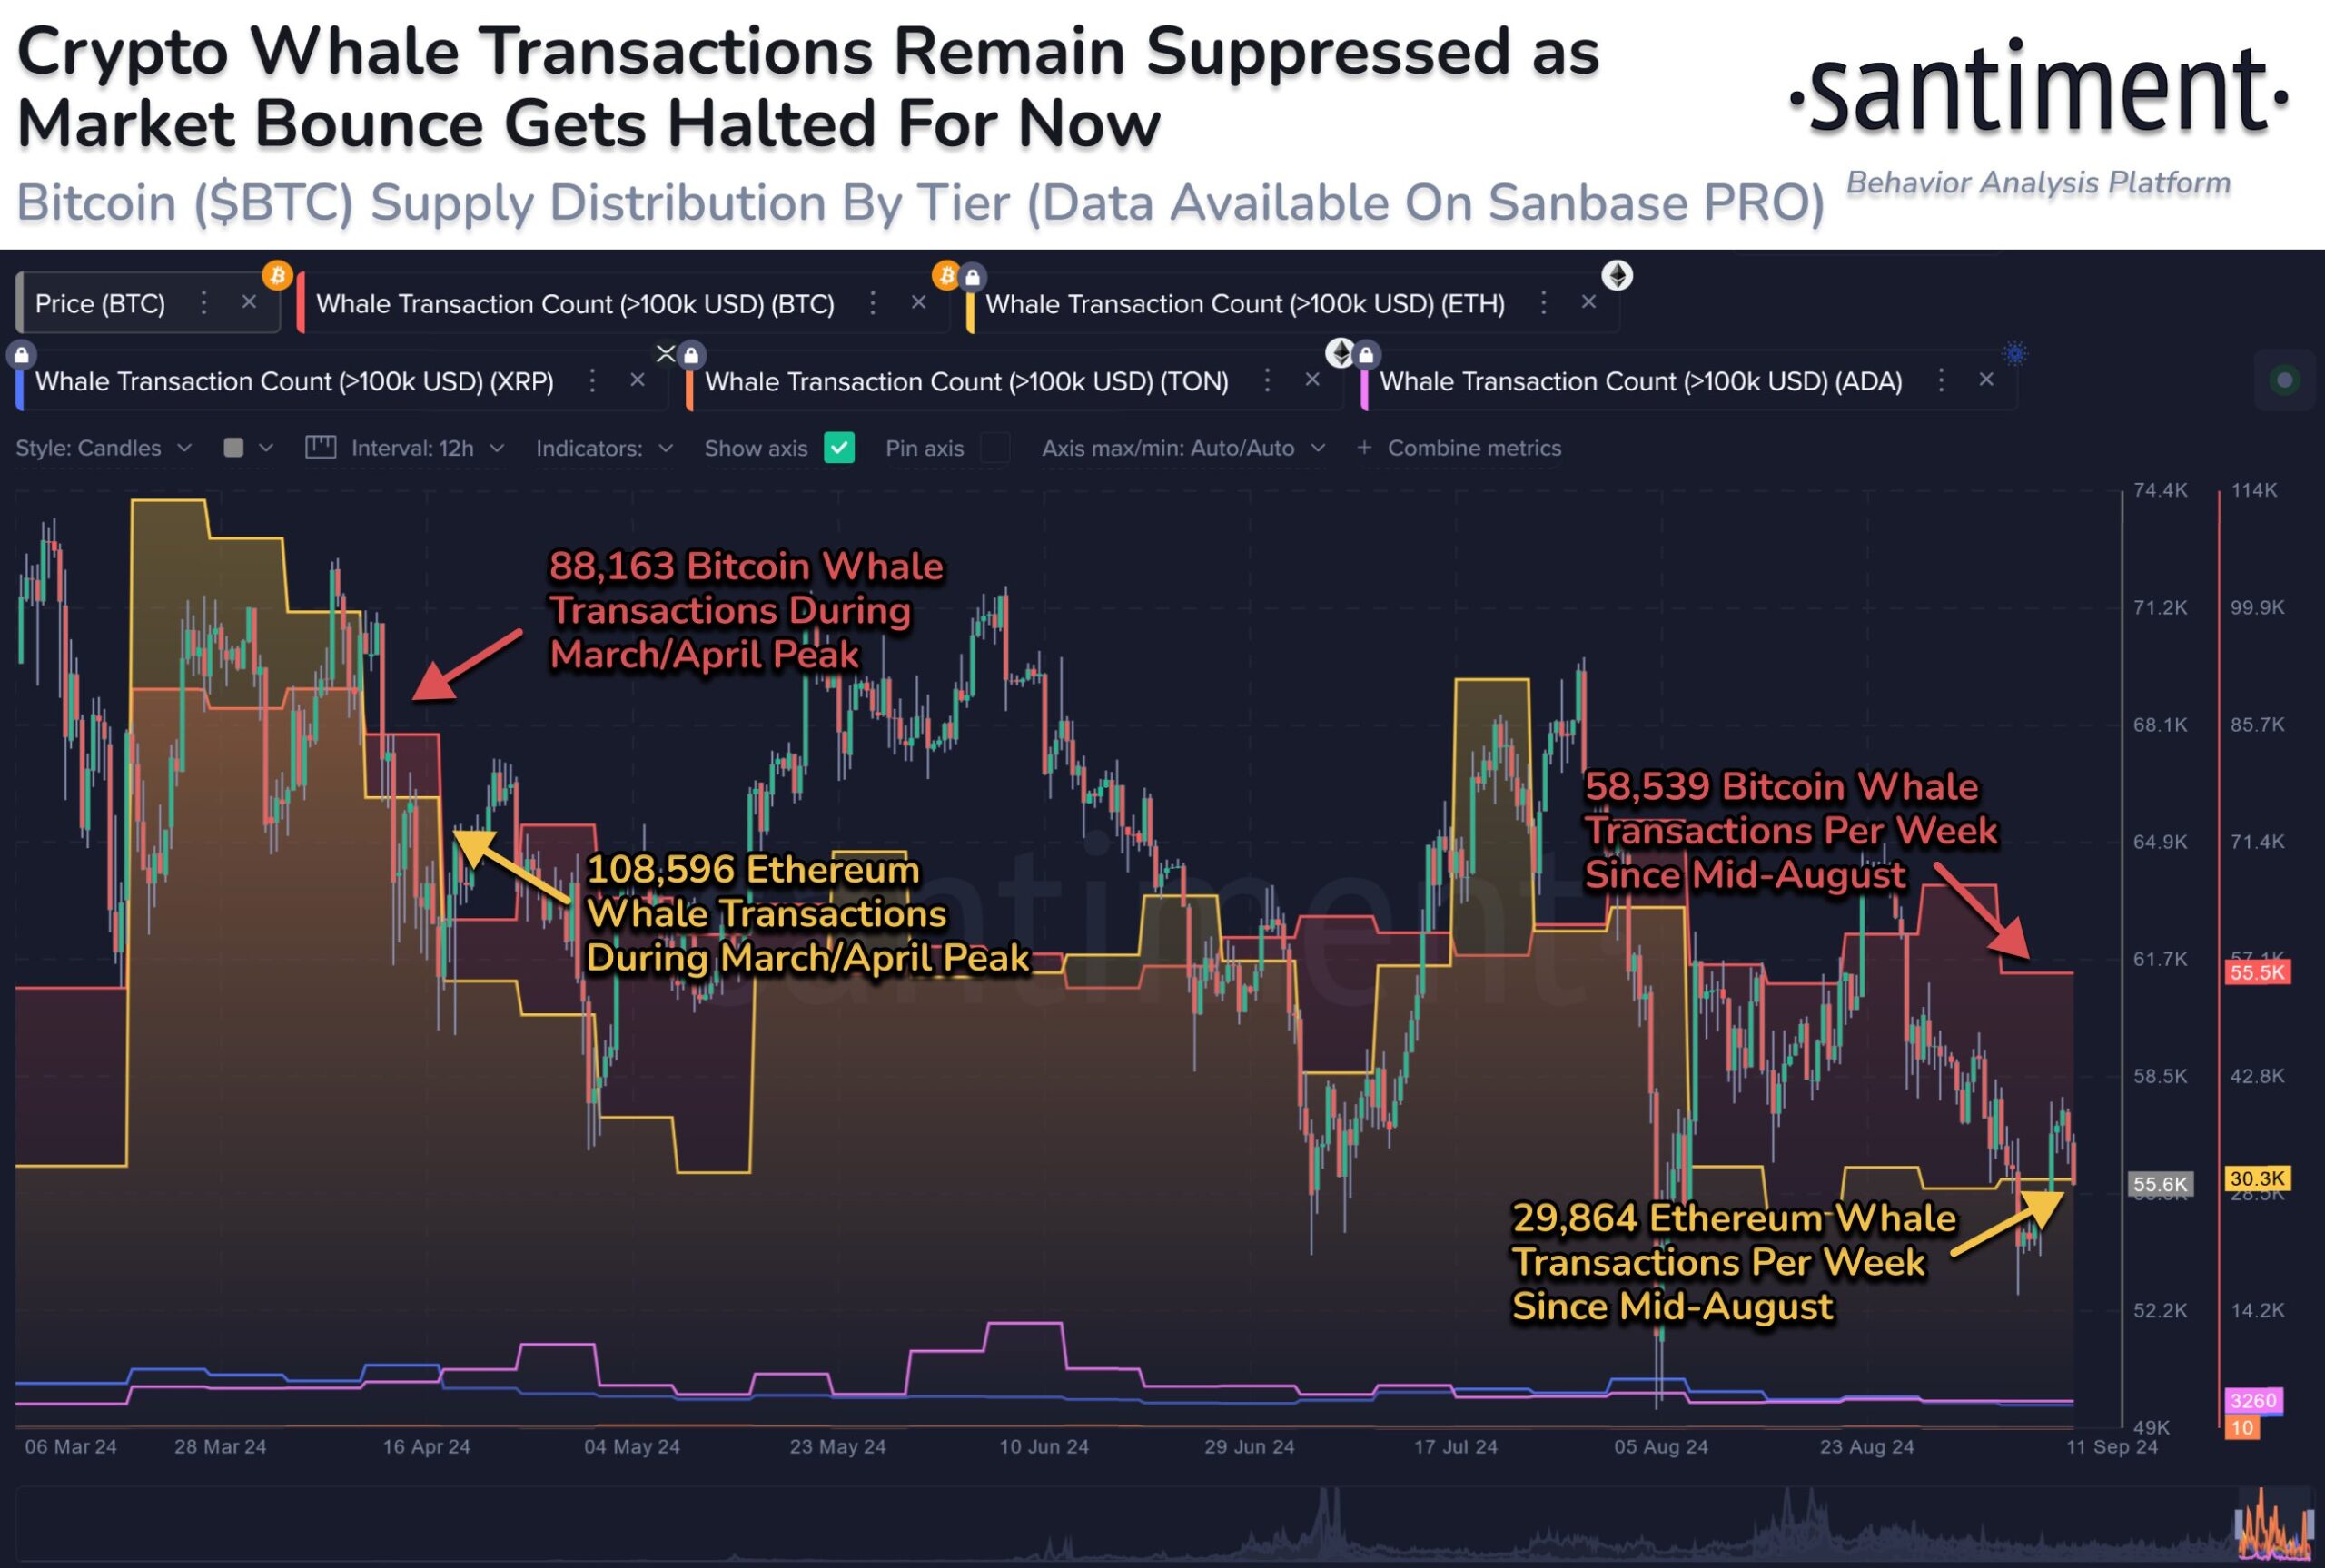 Crypto Whale Transactions. Source: X
While this may come off to many as a bearish signal, the data provider noted that it may not be the case, as Bitcoin whales can be just as active in both bull and bear markets.
“This does indicate that large key stakeholders continue to bide their time as they wait to make their next moves during times of extreme crowd greed or extreme fear,” Santiment wrote.
As of this writing, the overall sentiment in the cryptocurrency market is “fear,” as highlighted by the Crypto Fear & Greed Index. This sentiment continues to linger as BTC navigates ongoing volatility, which some analysts argue would be temporary.
“Bitcoin CPI traders having a lot of fun again today I see. Both sides stop hunted multiple times. Quite a lot of volatility but nothing we’re not used to the past few weeks,” a prominent analyst Daan Crypto wrote.
BTC Price Prediction: Price May Swing in Either Direction
BeinCrypto’s analysis of Bitcoin’s one-day chart aligns with Daan Crypto Trades’ perspective on its volatility. The gap between the upper and lower bands of Bitcoin’s Bollinger Bands, which track market volatility, has expanded gradually over the past week.
The upper band marks the higher range of price movements, while the lower band follows the lower range. A widening gap between these bands indicates rising volatility.
Additionally, Bitcoin’s Bollinger Bandwidth, which helps traders assess market volatility and spot breakout opportunities, has also increased in recent days. A higher bandwidth further confirms elevated volatility.
Read more: Where To Trade Bitcoin Futures: A Comprehensive Guide
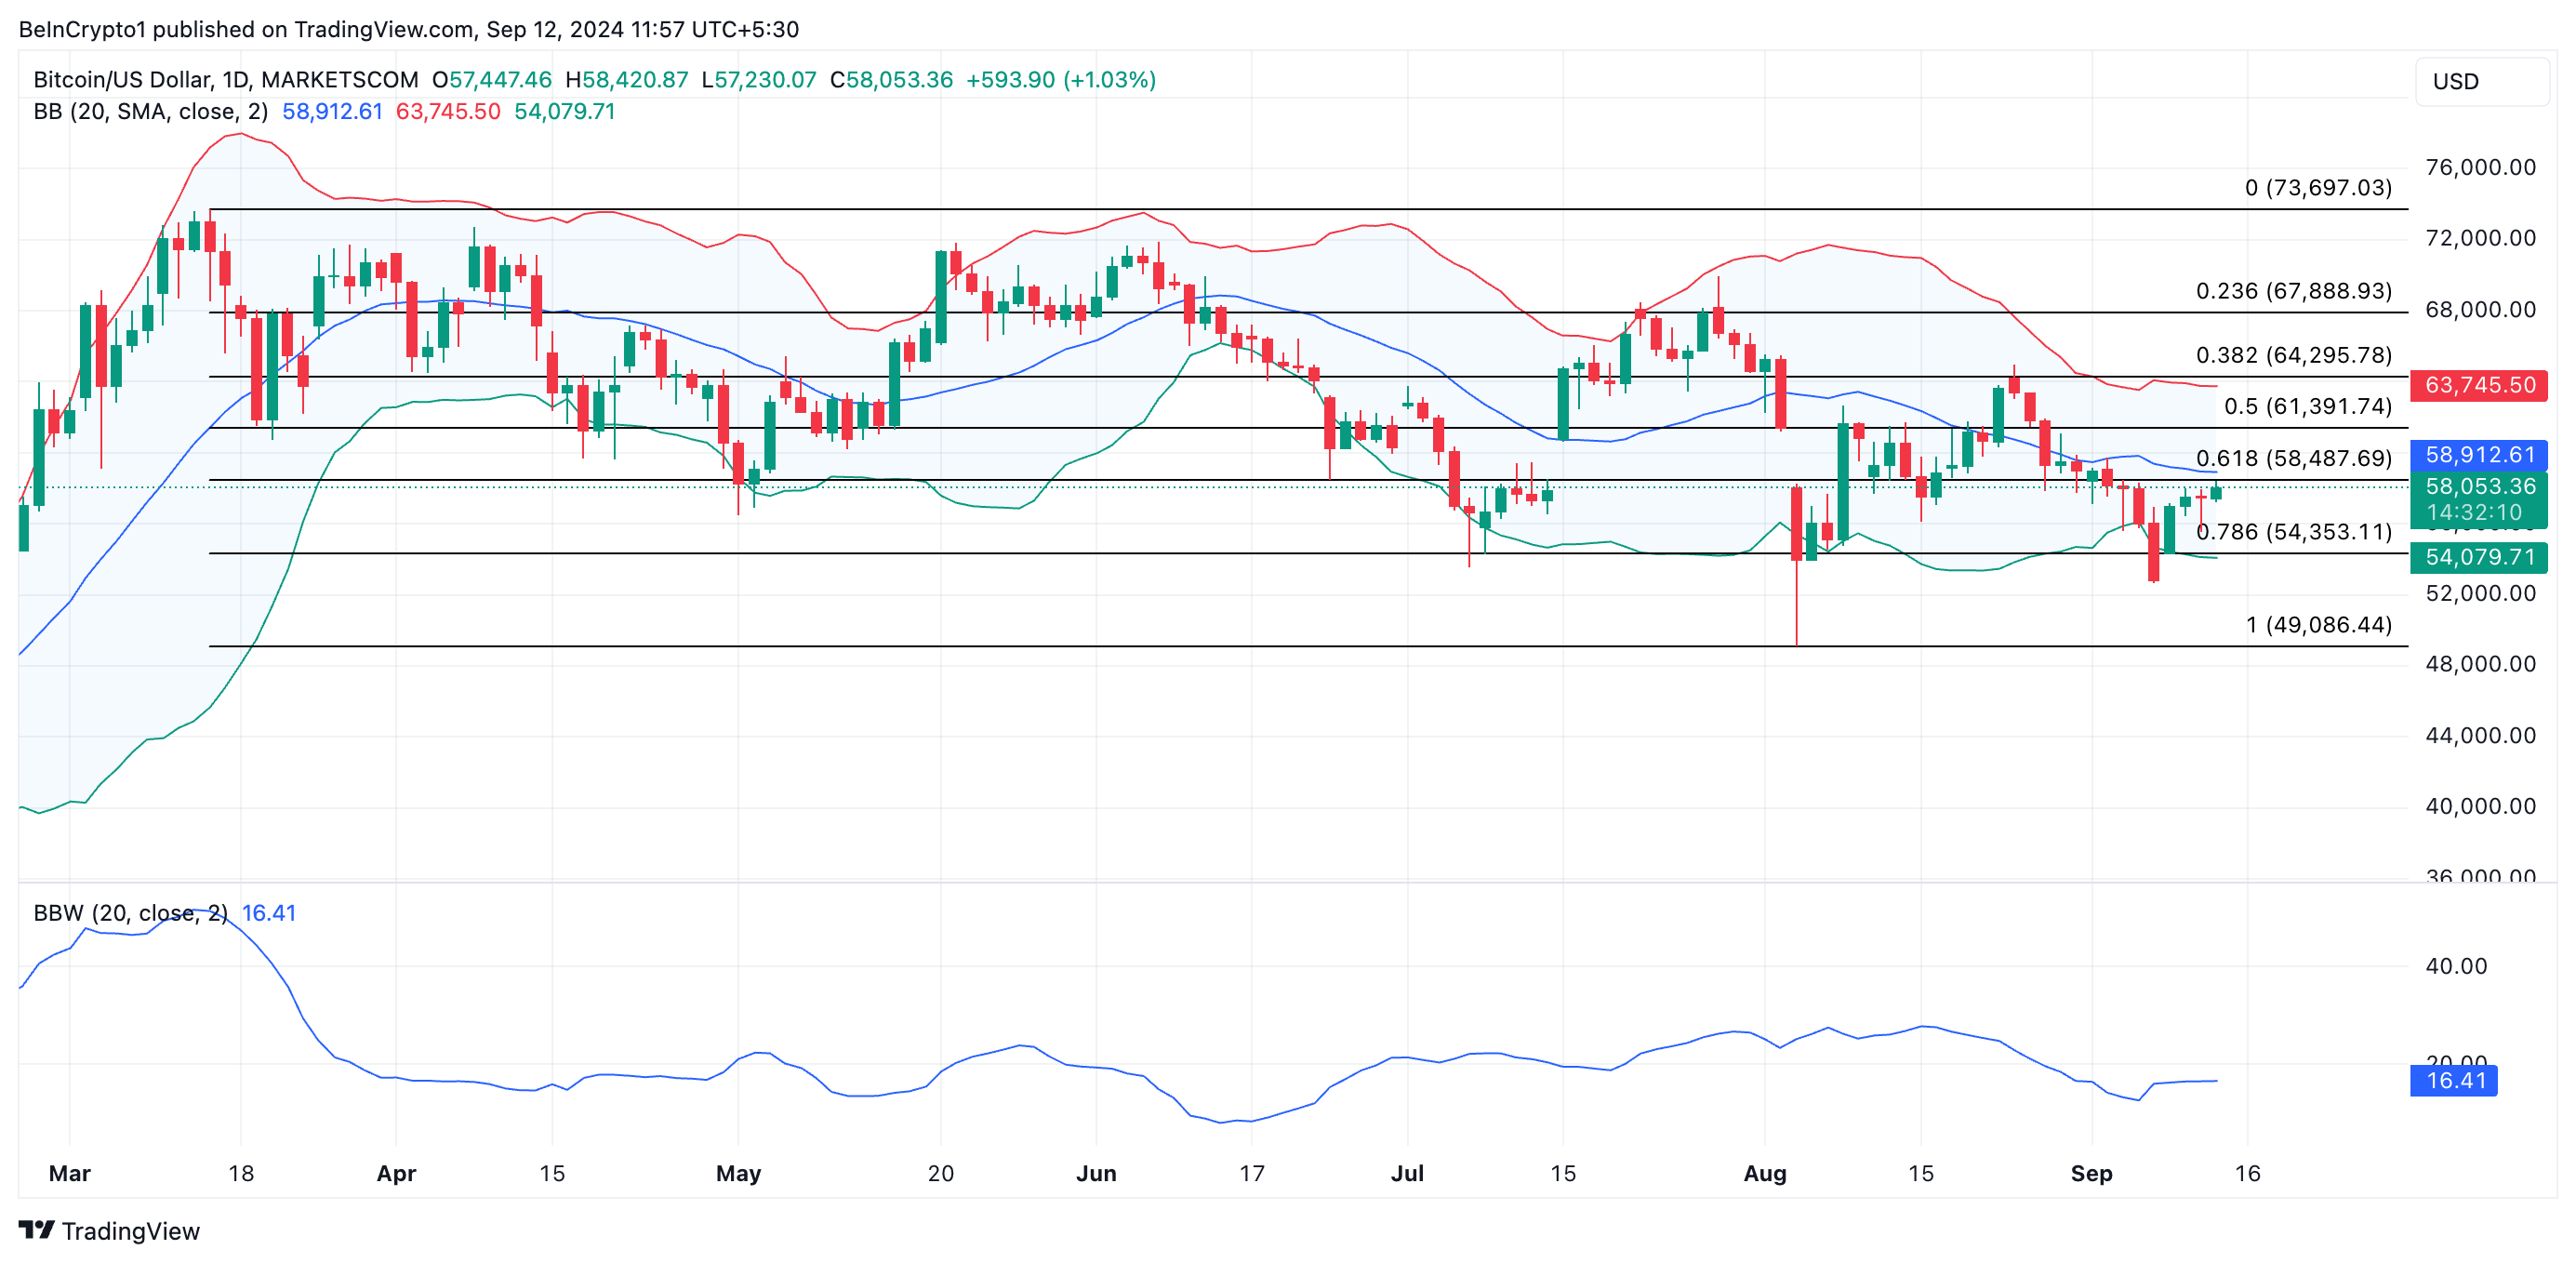 Bitcoin Daily Analysis. Source: TradingView
This suggests Bitcoin’s price could move sharply in either direction. If the price rises, it may break resistance at $61,391 and aim for $64,295.
Conversely, if the price falls, Bitcoin could drop below $54,353, possibly revisiting the August 5 low of $49,086.
Recommended Articles


