2 Lesser-Known Indicators Predict Dogecoin (DOGE) Price Fall Under $0.10

Source Beincrypto

As market sentiment swings sideways, two subtle but important metrics signal a potential drop in the price of Dogecoin (DOGE). Last month, DOGE hit $0.11. 

However, the meme coin has been trading below this level since the beginning of September. These indicators reveal how the cryptocurrency’s current trend might impact the price.

Dogecoin Sees Low Traction, High Sell-Offs

Dogecoin’s Mean Dollar Invested Age (MDIA) is the first key metric to watch. MDIA measures the average age of every dollar invested in the coin. A rising MDIA suggests long-term holding, meaning holders are not selling. Conversely, a declining MDIA indicates that more participants are trading their coins, often signaling significant sell-offs.

As shown in the chart, MDIA has dropped sharply since September 8, implying that less capital is being invested in Dogecoin. This could make Dogecoin’s price vulnerable to a drop below its current level of $0.10.

Dogecoin Mean Dollar Invested Age. 
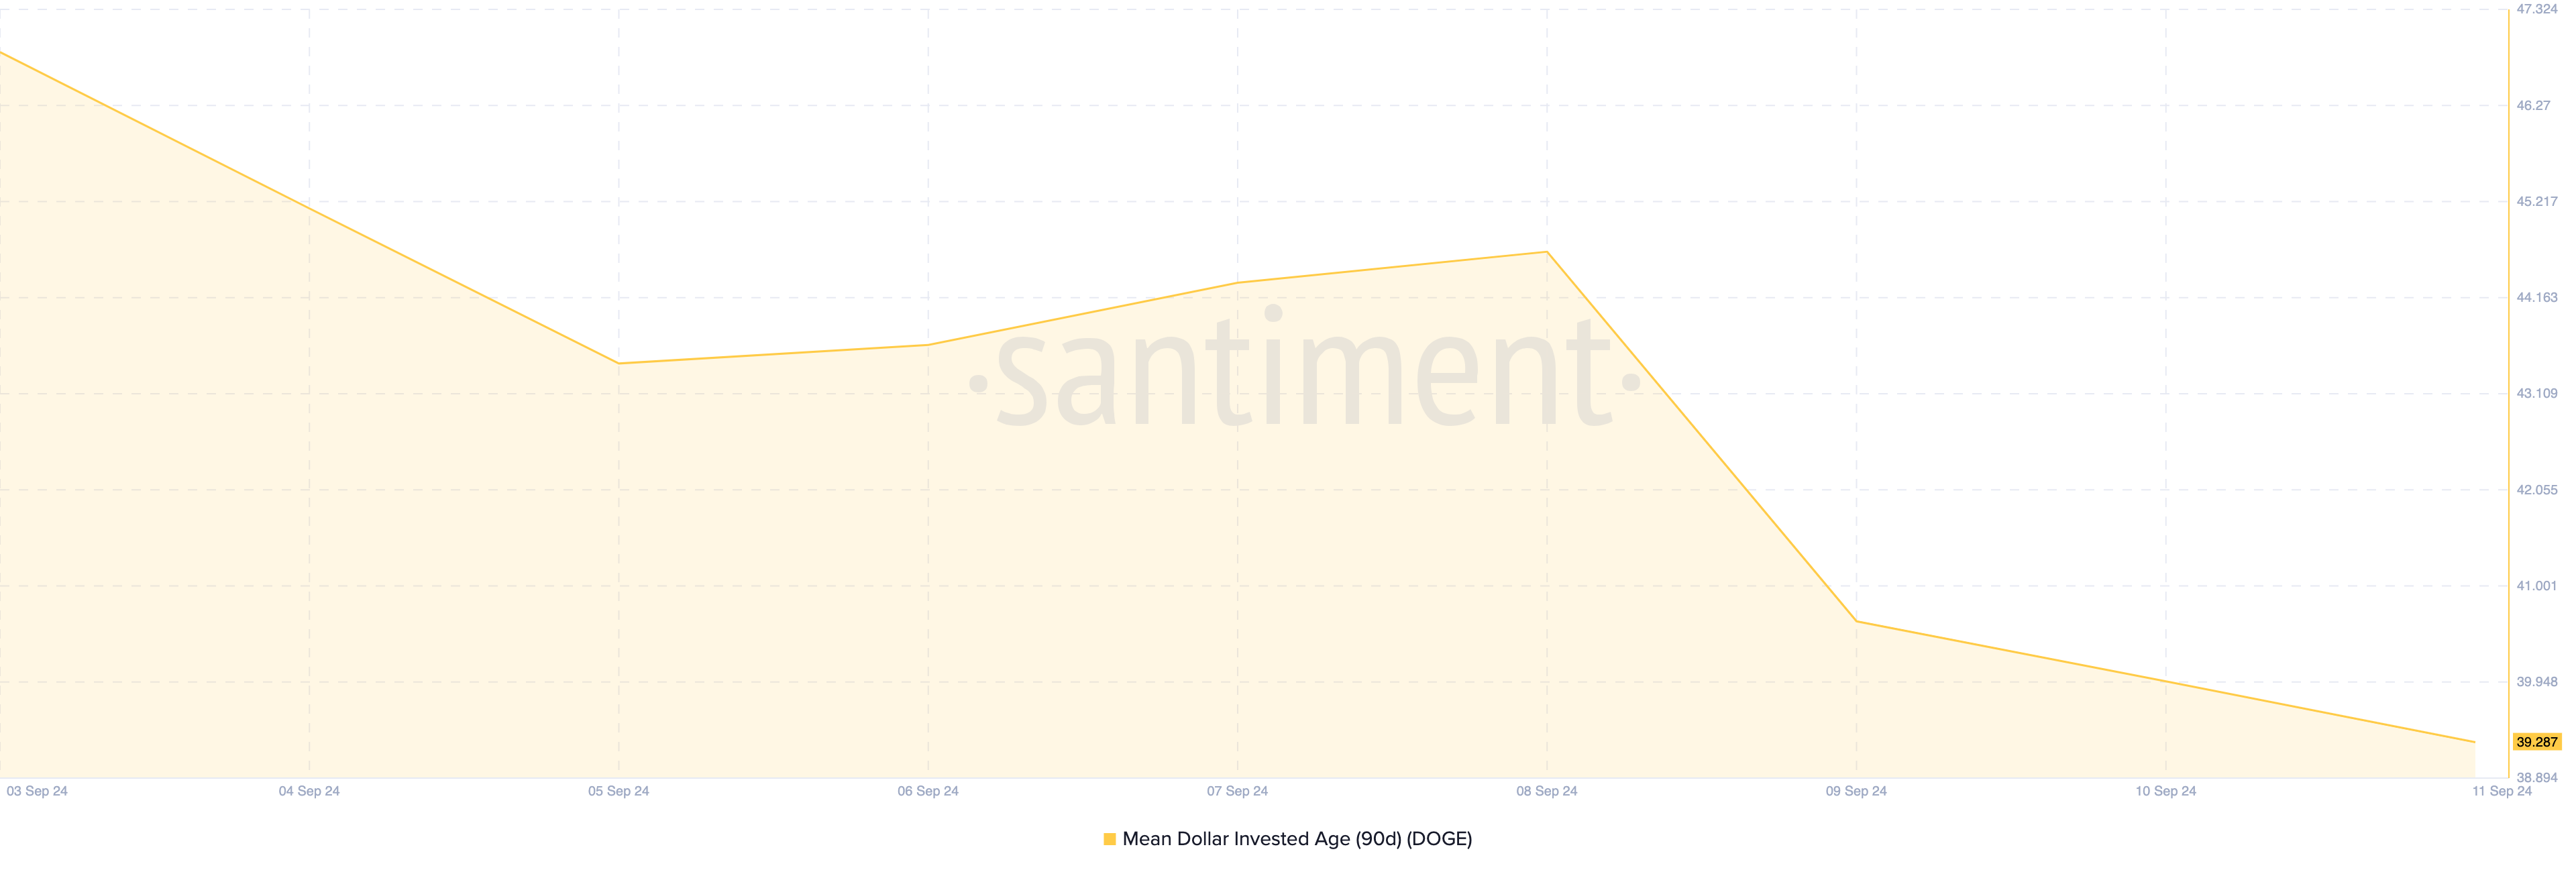
Dogecoin Mean Dollar Invested Age. Source: Santiment

The second vital but rarely used indicator is the Address Birth-Death ratio. As the name implies, the ratio measures the rate at which new addresses are adopting a cryptocurrency compared to the rate at which other addresses are selling all of their coins.

A high Birth-Death ratio indicates that a cryptocurrency is seeing more adoption than exits. However, as of this writing, the ratio is down to 0.11%,  suggesting that a higher proportion of retired DOGE wallets compared to the newly created ones.

Read more: How To Buy Dogecoin (DOGE) and Everything You Need To Know

Dogecoin Address Birth-Death Ratio.
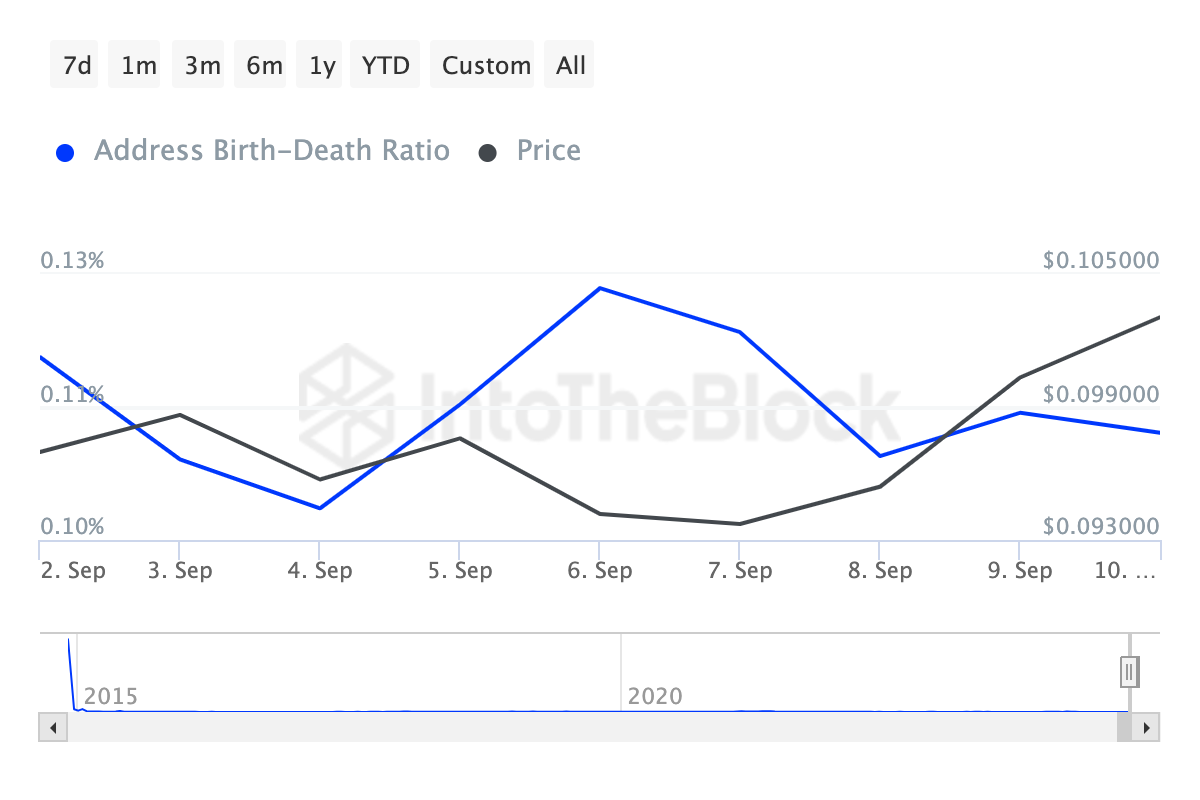
Dogecoin Address Birth-Death Ratio. Source: IntoTheBlock

DOGE Price Prediction:Breakout Invalidated

According to the daily chart, Dogecoin broke above the descending triangle three days ago. Typically, a break above this technical pattern is a bullish sign — evident as DOGE’s price attempted to appreciate further.

However, the coin encountered rejection, as it aimed at $0.11. Based on the image below, DOGE’s price is on the brink of falling below the 61.8% Fibonacci retracement level.

Read more: Dogecoin (DOGE) vs Shiba Inu (SHIB): What’s the Difference?

Dogecoin Daily Analysis. 
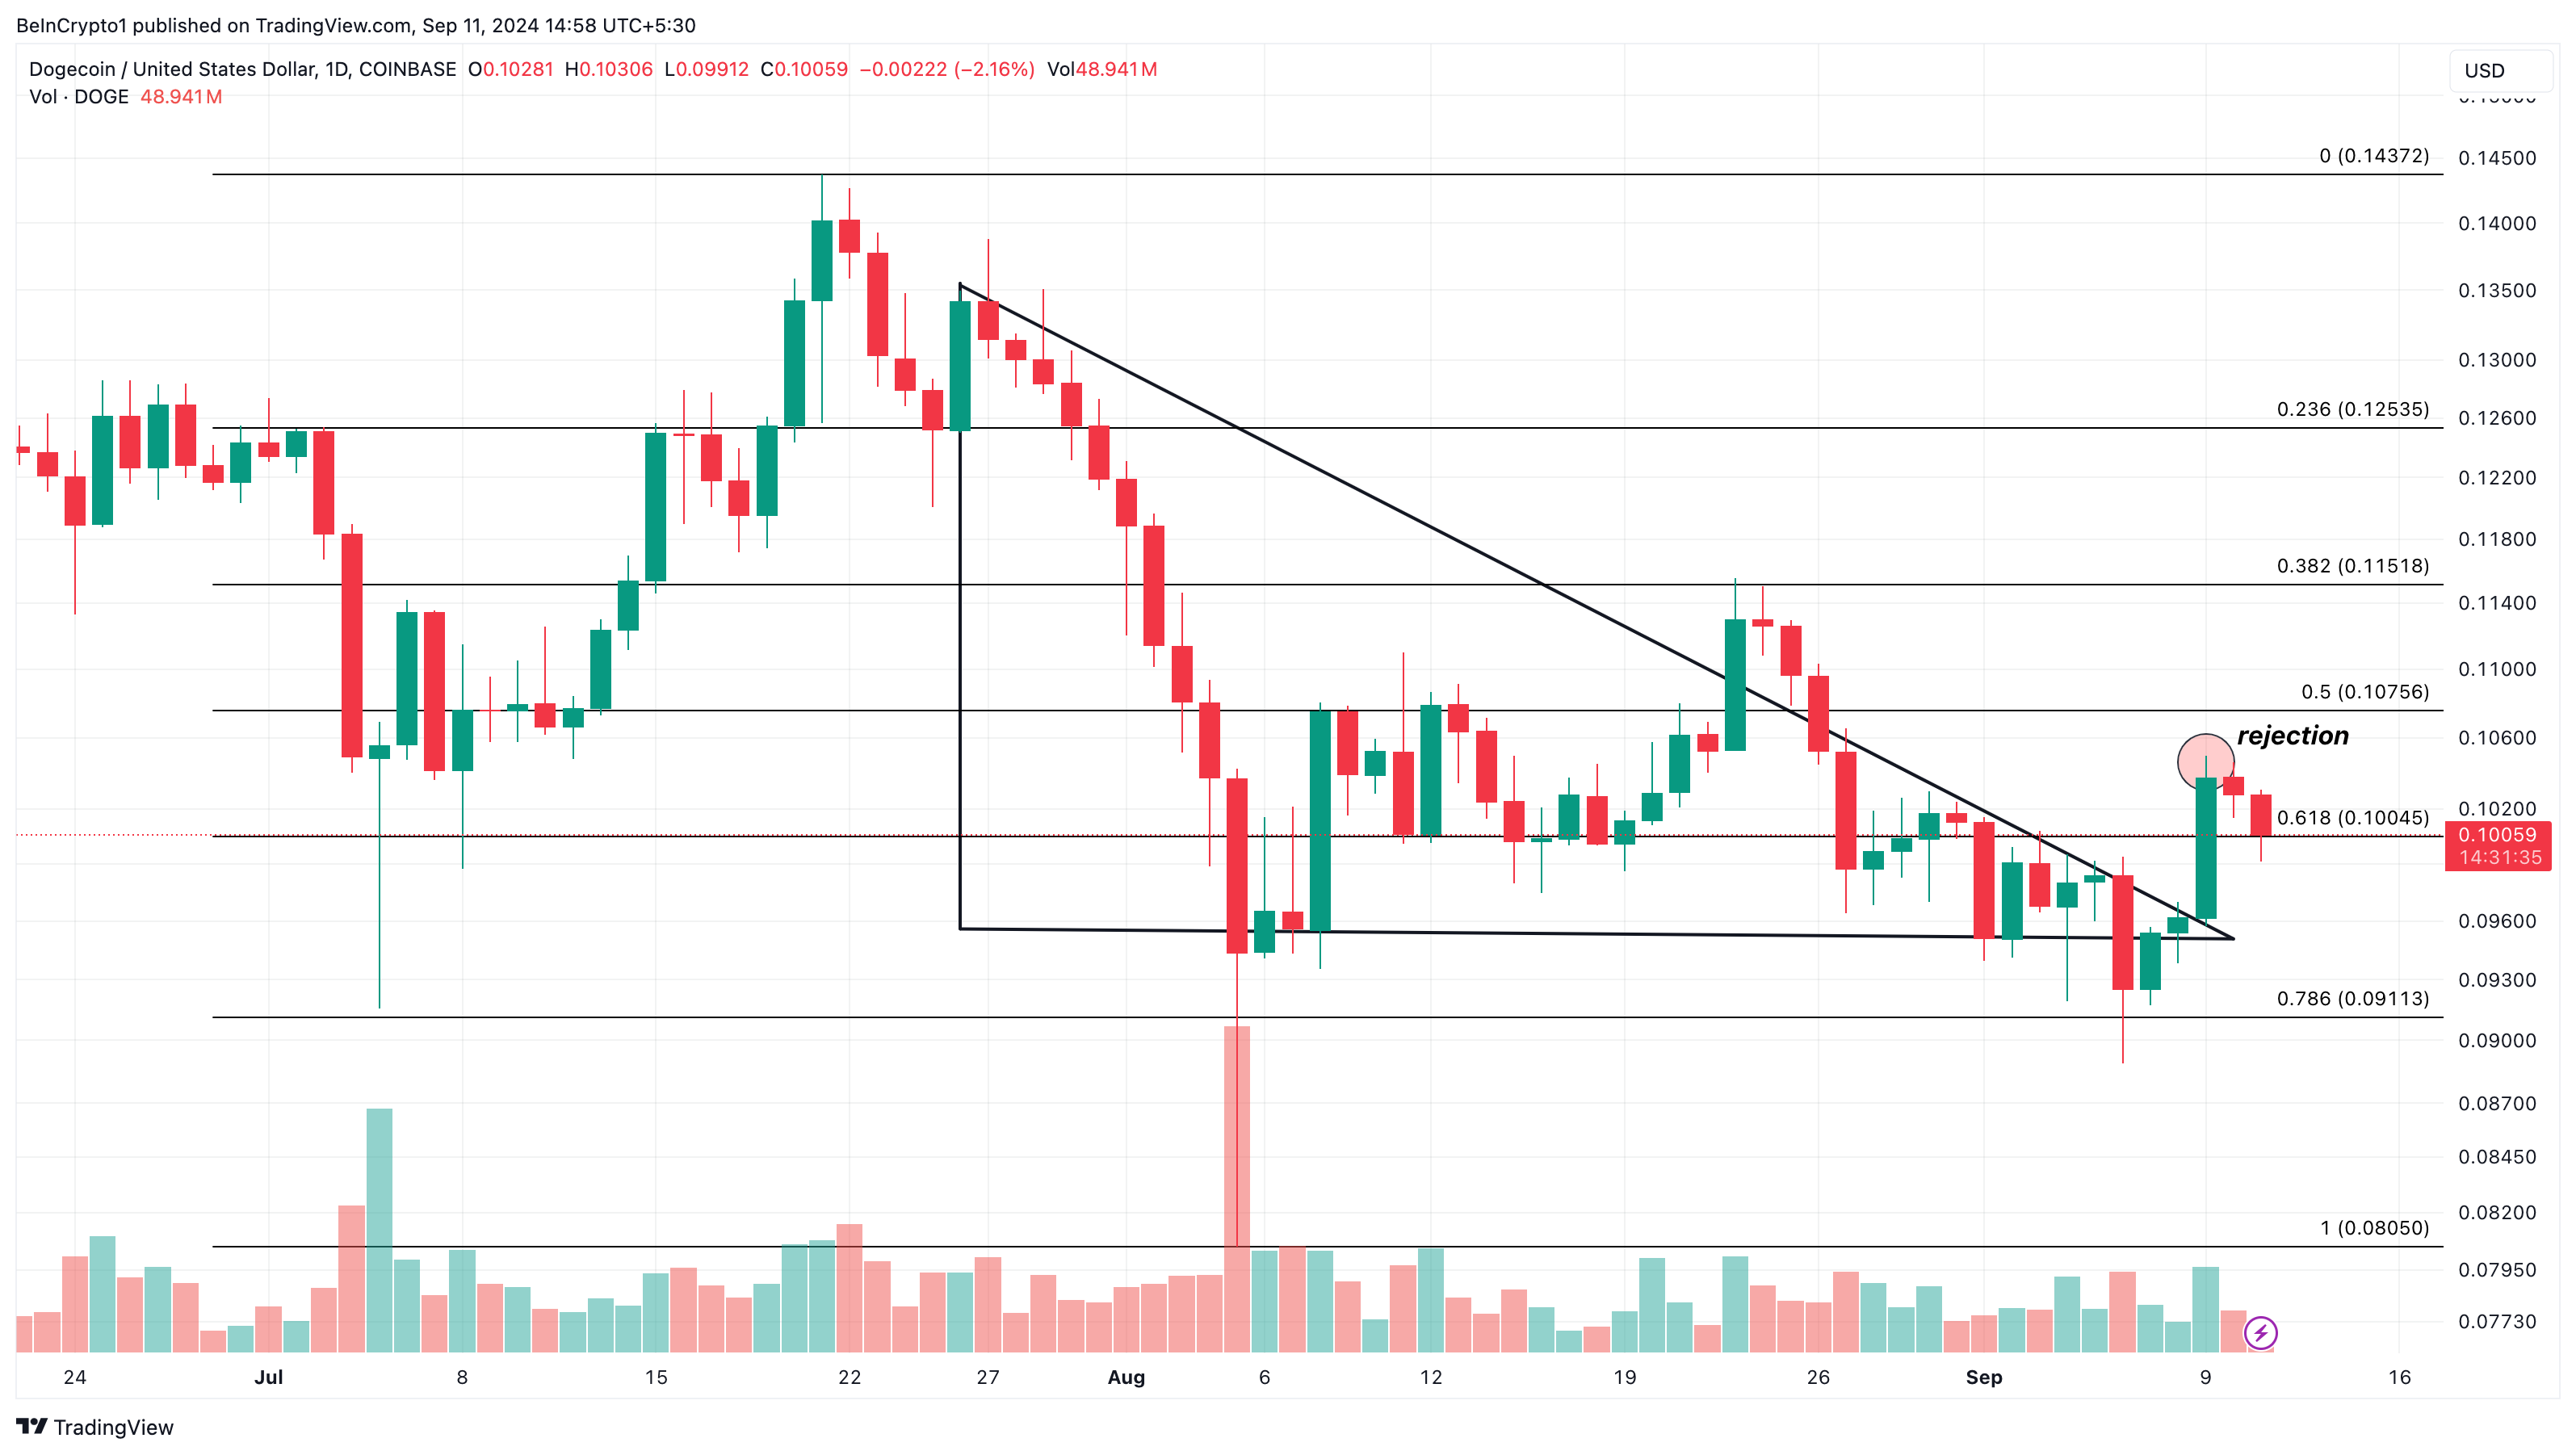
Dogecoin Daily Analysis. Source: TradingView

As soon as this happens, the bearish outlook could be confirmed, potentially driving the price down to $0.091. However, if bulls manage to hold the price above this level, the bearish prediction could be invalidated, and Dogecoin might rise to $0.12.

Disclaimer: For information purposes only. Past performance is not indicative of future results.
placeholder
2025 Black Friday is coming! Which stocks may see volatility?Coming on the day right after Thanksgiving in the United States, Back Friday marks the start of the holiday shopping season. Sales data from this shopping frenzy day reflects investor confidence and consumer trends. The National Retail Federation (NRF) predicts that holiday season (Nov and Dec) retail sales in 2025 will likely exceed $1 trillion for the very first time, which represents a year-over-year increase of 3.7 to 4.2 percent. Historic data from the past decade show that the retail sector has generally outperformed the S&P 500 during the weeks before and after Black Friday. The following retailing companies are expected to be big winners:
Author  Insights
Nov 24, Mon
Coming on the day right after Thanksgiving in the United States, Back Friday marks the start of the holiday shopping season. Sales data from this shopping frenzy day reflects investor confidence and consumer trends. The National Retail Federation (NRF) predicts that holiday season (Nov and Dec) retail sales in 2025 will likely exceed $1 trillion for the very first time, which represents a year-over-year increase of 3.7 to 4.2 percent. Historic data from the past decade show that the retail sector has generally outperformed the S&P 500 during the weeks before and after Black Friday. The following retailing companies are expected to be big winners:
placeholder
Bitcoin Bleeds to $86K, But This Key Indicator Screams "The Top Isn't In"Bitcoin’s adjusted Spent Output Profit Ratio (aSOPR) has spent nearly two years coiling below the extremes seen at past bull-market peaks, even as BTC trades around $86,300 and down 9% on the week — a setup that leaves open the possibility that this cycle’s true top may still lie ahead.
Author  Mitrade
Nov 25, Tue
Bitcoin’s adjusted Spent Output Profit Ratio (aSOPR) has spent nearly two years coiling below the extremes seen at past bull-market peaks, even as BTC trades around $86,300 and down 9% on the week — a setup that leaves open the possibility that this cycle’s true top may still lie ahead.
placeholder
Bitcoin Price Rebound Gains Traction with $90K Break in SightBitcoin is trading above $87,000 and its 100-hour SMA after rebounding from $83,500, with a bearish trend line at $88,200 and resistance at $89,000–$90,000 now in focus as BTC either breaks higher toward $91,750–$94,000 or slips back toward $86,700, $85,000 and lower supports.
Author  Mitrade
Yesterday 02: 58
Bitcoin is trading above $87,000 and its 100-hour SMA after rebounding from $83,500, with a bearish trend line at $88,200 and resistance at $89,000–$90,000 now in focus as BTC either breaks higher toward $91,750–$94,000 or slips back toward $86,700, $85,000 and lower supports.
placeholder
Bitcoin Targets $89K Breakout as S&P 500 Nears ATH on Fed Rate Cut HopesBitcoin price action shows signs of a potential short squeeze as it hovers near $88,000, with analysts watching liquidity dynamics that could push it toward $89,000 or retrace to $85,000.
Author  Mitrade
5 hours ago
Bitcoin price action shows signs of a potential short squeeze as it hovers near $88,000, with analysts watching liquidity dynamics that could push it toward $89,000 or retrace to $85,000.
placeholder
Ethereum Reclaims $3K Handle—Is a Breakout Imminent?Ethereum has jumped back above $3,000 and reclaimed key Fib levels, with a bullish trend line at $2,880 and strong MACD/RSI readings putting a breakout above $3,120–$3,165 — and a possible run toward $3,320–$3,350 — on the table, as long as support around $2,980–$2,920 holds.
Author  Mitrade
5 hours ago
Ethereum has jumped back above $3,000 and reclaimed key Fib levels, with a bullish trend line at $2,880 and strong MACD/RSI readings putting a breakout above $3,120–$3,165 — and a possible run toward $3,320–$3,350 — on the table, as long as support around $2,980–$2,920 holds.
goTop
quote