Dogecoin To $0.15: Analyst Explains What Could Kick Off A Fresh Rally

Source Newsbtc

An analyst has explained how Dogecoin has been forming a Falling Wedge pattern recently, breaking which may kickstart a new bull rally.

Dogecoin Has Been Moving Inside A Falling Wedge Recently

In a new post on X, analyst Ali Martinez has discussed a pattern that has recently been forming in the 1-day price of Dogecoin. The pattern in question is the “Falling Wedge” from technical analysis (TA), which is a type of Wedge.

A Wedge pattern appears when the price of the asset consolidates between two converging trendlines (that is, the lines have different slopes and are angled inwards). Depending on where this consolidation is headed, the pattern is termed as Falling or Rising.

In a Falling Wedge, the upper line of the pattern connects lower highs in the price, while the bottom one connects lower lows. Similarly, a Rising Wedge has the upper line joining together higher highs and the lower one with higher lows. Just like other TA consolidation patterns, the upper line may continue to act as a source of resistance in the near future, while the lower one may provide support.

Also, a break out of either of these trendlines can suggest a continuation of pattern in that direction. Wedges specifically are considered to be formations that lead to a reversal, so a break in the direction opposite to that of the Wedge may be considered to be more likely.

Dogecoin has recently been showing a Wedge-like consolidation towards the downside in recent months, so the coin may be forming a Falling Wedge pattern. Below is the chart shared by Ali that showcases this formation.
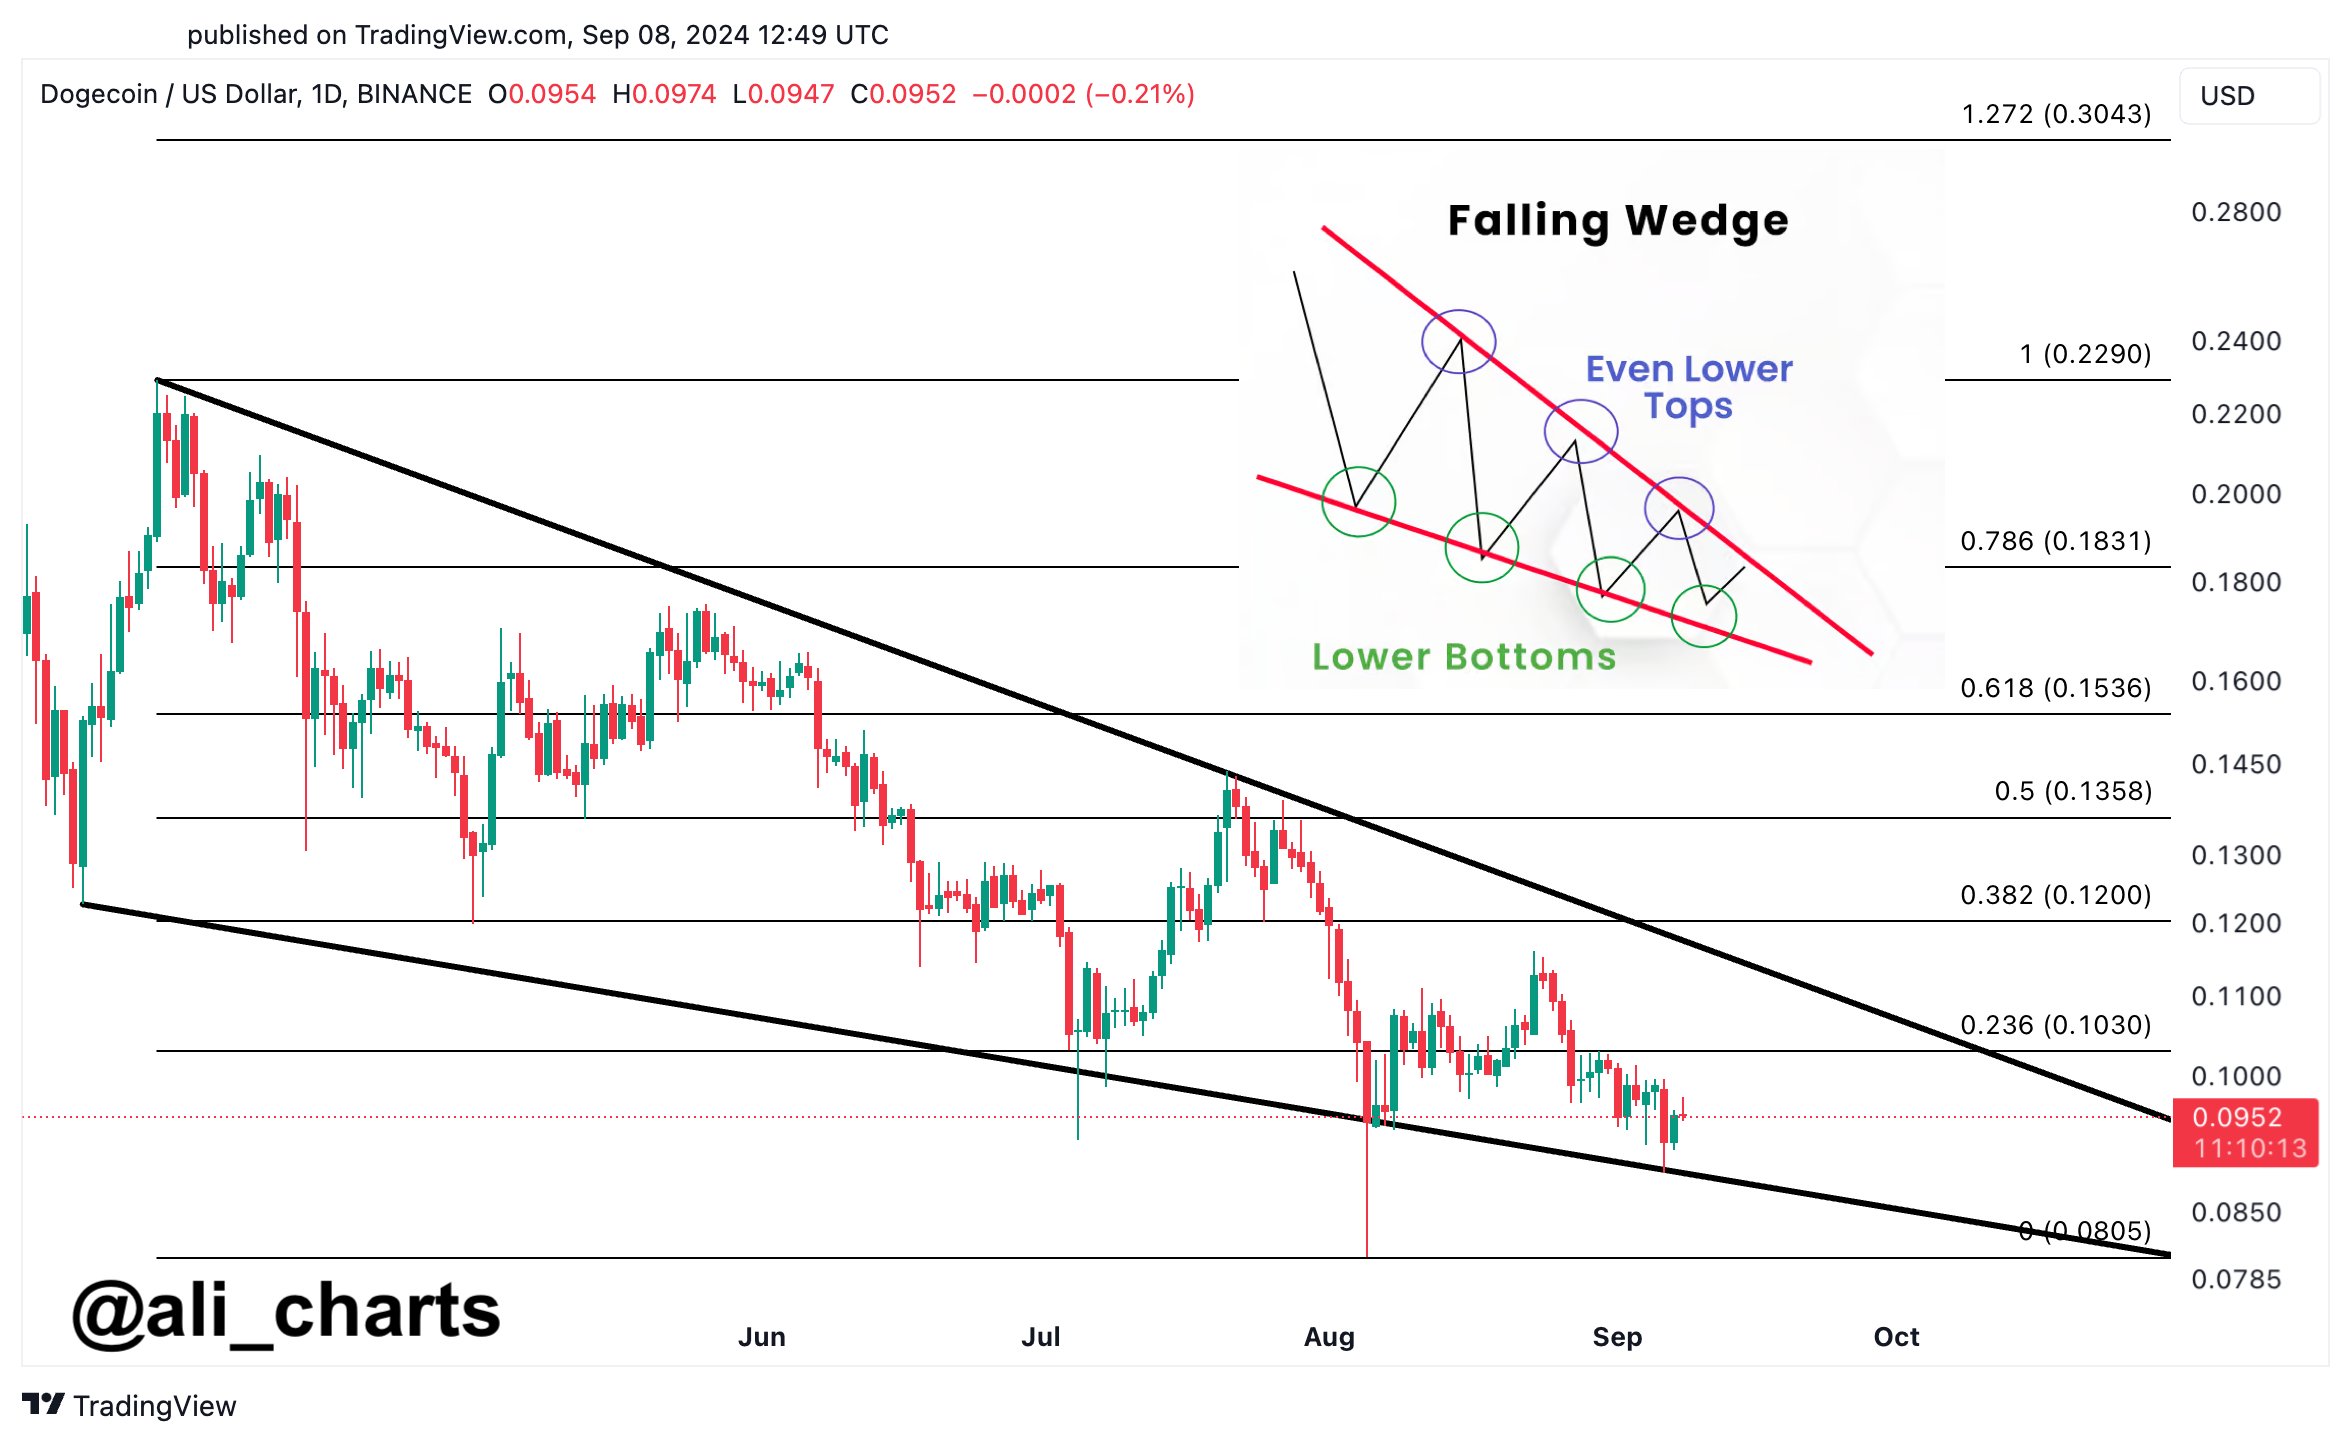
Dogecoin Falling Wedge

As is visible in the graph, the Dogecoin price has recently made an apparent retest of the bottom line of this Falling Wedge pattern and has found support at it. Thus, it’s possible that DOGE may now see a surge towards the upper trendline.

Before the coin retests the upper line, though, there is perhaps another important level it has to surpass first: the 0.236 Fibonacci Retracement level. Fibonacci Retracement levels are based on ratios that are found in the famous Fibonacci series.

These levels correspond to the percentage of drawdown as measured between two fixed levels. In the current case, Ali has taken the top of the Falling Wedge as the start of these levels (that is, the 100% or 1 mark).

The analyst notes that if Dogecoin can manage a sustained close above the $0.10 level (that is, above the 0.236 Fibonacci Retracement), it may be able to start a rally toward the $0.15 level.

From the current price of the memecoin, such a potential run would mean an increase of around 53%. It now remains to be seen how DOGE develops in the coming days and whether it would be able to follow any similar trajectory or not.

DOGE Price

Dogecoin had fallen under the $0.090 mark a couple of days back, but the asset appears to have rebounded as it has now recovered to $0.098.

Dogecoin Price Chart
Disclaimer: For information purposes only. Past performance is not indicative of future results.
placeholder
Top 3 Price Prediction: Bitcoin, Ethereum, Ripple – BTC, ETH and XRP Look for a Foothold After a Sharp ShakeoutBitcoin trades near $92,600 after a dip below $90,000, while Ethereum around $3,118 and XRP near $2.21–$2.23 sit on key support zones, as BTC, ETH and XRP all try to turn a sharp correction into a tradable rebound rather than a deeper slide.
Author  Mitrade
Nov 19, Wed
Bitcoin trades near $92,600 after a dip below $90,000, while Ethereum around $3,118 and XRP near $2.21–$2.23 sit on key support zones, as BTC, ETH and XRP all try to turn a sharp correction into a tradable rebound rather than a deeper slide.
placeholder
Bitcoin Volatility Spikes: Is Options-Driven Pricing Making a Comeback?Bitcoin's volatility is surging, suggesting a shift back to options-driven price action seen before Bitcoin ETFs were launched.
Author  Mitrade
Nov 24, Mon
Bitcoin's volatility is surging, suggesting a shift back to options-driven price action seen before Bitcoin ETFs were launched.
placeholder
2025 Black Friday is coming! Which stocks may see volatility?Coming on the day right after Thanksgiving in the United States, Back Friday marks the start of the holiday shopping season. Sales data from this shopping frenzy day reflects investor confidence and consumer trends. The National Retail Federation (NRF) predicts that holiday season (Nov and Dec) retail sales in 2025 will likely exceed $1 trillion for the very first time, which represents a year-over-year increase of 3.7 to 4.2 percent. Historic data from the past decade show that the retail sector has generally outperformed the S&P 500 during the weeks before and after Black Friday. The following retailing companies are expected to be big winners:
Author  Insights
Nov 24, Mon
Coming on the day right after Thanksgiving in the United States, Back Friday marks the start of the holiday shopping season. Sales data from this shopping frenzy day reflects investor confidence and consumer trends. The National Retail Federation (NRF) predicts that holiday season (Nov and Dec) retail sales in 2025 will likely exceed $1 trillion for the very first time, which represents a year-over-year increase of 3.7 to 4.2 percent. Historic data from the past decade show that the retail sector has generally outperformed the S&P 500 during the weeks before and after Black Friday. The following retailing companies are expected to be big winners:
placeholder
Gold Price Forecast: XAU/USD rises to near $4,150 as Fed rate cut bets growGold price (XAU/USD) attracts some buyers to around $4,140 during the early Asian session on Tuesday. The precious metal rises on growing expectations of a US Federal Reserve (Fed) interest rate cut in the December policy meeting.
Author  FXStreet
23 hours ago
Gold price (XAU/USD) attracts some buyers to around $4,140 during the early Asian session on Tuesday. The precious metal rises on growing expectations of a US Federal Reserve (Fed) interest rate cut in the December policy meeting.
placeholder
Bitcoin Bleeds to $86K, But This Key Indicator Screams "The Top Isn't In"Bitcoin’s adjusted Spent Output Profit Ratio (aSOPR) has spent nearly two years coiling below the extremes seen at past bull-market peaks, even as BTC trades around $86,300 and down 9% on the week — a setup that leaves open the possibility that this cycle’s true top may still lie ahead.
Author  Mitrade
17 hours ago
Bitcoin’s adjusted Spent Output Profit Ratio (aSOPR) has spent nearly two years coiling below the extremes seen at past bull-market peaks, even as BTC trades around $86,300 and down 9% on the week — a setup that leaves open the possibility that this cycle’s true top may still lie ahead.
goTop
quote