

Shiba Inu could extend gains with Shiba Eternity web3 version launch
- Shiba Eternity card game sees web3 version launch, enters closed beta early on Monday.
- Shiba Inu ecosystem’s game launch and declining exchange supply emerge as key market movers for SHIB.
- Shiba Inu supply on exchanges dropped by over 5% in the past three months, per Santiment data, suggesting easing selling pressure.
- SHIB extends gains on Tuesday, likely to rally towards the $0.000020 target after liquidity sweep at $0.000015.
Shiba Inu (SHIB), a dog-themed meme coin and the second-largest crypto asset in the category, has two key market movers this week. The web3 version launch of the card game Shiba Eternity and the on-chain data.
Shiba Eternity web3 opens closed beta
Shiba Inu marketing executive behind the X handle @LucieSHIB announced the official launch of web3 version of the card game Shiba Eternity in closed beta.
The collectible card game is hosted on the Shibarium network, and its launch is scheduled for this week, according to Angel, a member of the Shiba Games team.
The card game’s players will stake LEASH tokens to access the collectible cards. After its initial release, Shiba Eternity will be available to those holding at least one of three NFTs: Shiboshi, Sheboshi, or Shiba Eternity Lore NFT.
Shiba Inu on-chain metrics support bullish thesis
Shiba Inu supply on exchanges decreased 5% between May and July. In the last three months, the volume of SHIB held in exchange wallets dipped, reducing the volume available for users to sell. Santiment data shows SHIB supply on exchanges is 78.14 trillion on Tuesday.
 [12.50.55, 30 Jul, 2024]-638579288059393850.png)
SHIB supply on exchanges vs. price
Santiment data shows that active addresses crossed 4,000 on Monday and Tuesday. This shows that SHIB remains relevant among crypto traders, even as Bitcoin enjoys the spotlight in light of recent events, such as the Bitcoin Conference and the macro events lined up this week.
Technical analysis: Shiba Inu could rally 30%
Shiba Inu is in a downward trend since March, as observed in the SHIB/USDT daily chart. After its 2024 peak of $0.00004567 on March 5, SHIB erased its gains and tumbled to its July 5 low of $0.00001266.
SHIB is likely to sweep liquidity in the Fair Value Gap (FVG) between $0.00001508 and $0.00001539. Once the inefficiency is balanced, Shiba Inu could extend gains by more than 30% and hit its target of $0.00002045, the 23.6% Fibonacci retracement of the above-mentioned downward move.
Shiba Inu faces two zones of resistance between $0.00001819 and $0.00001847; and $0.00001944 to $0.00002040, on its path to the $0.00003045 target.
The Moving Average Convergence Divergence (MACD) indicator supports the thesis of a liquidity sweep, as the MACD line crossed under the signal line, marked by a circle in the chart below.
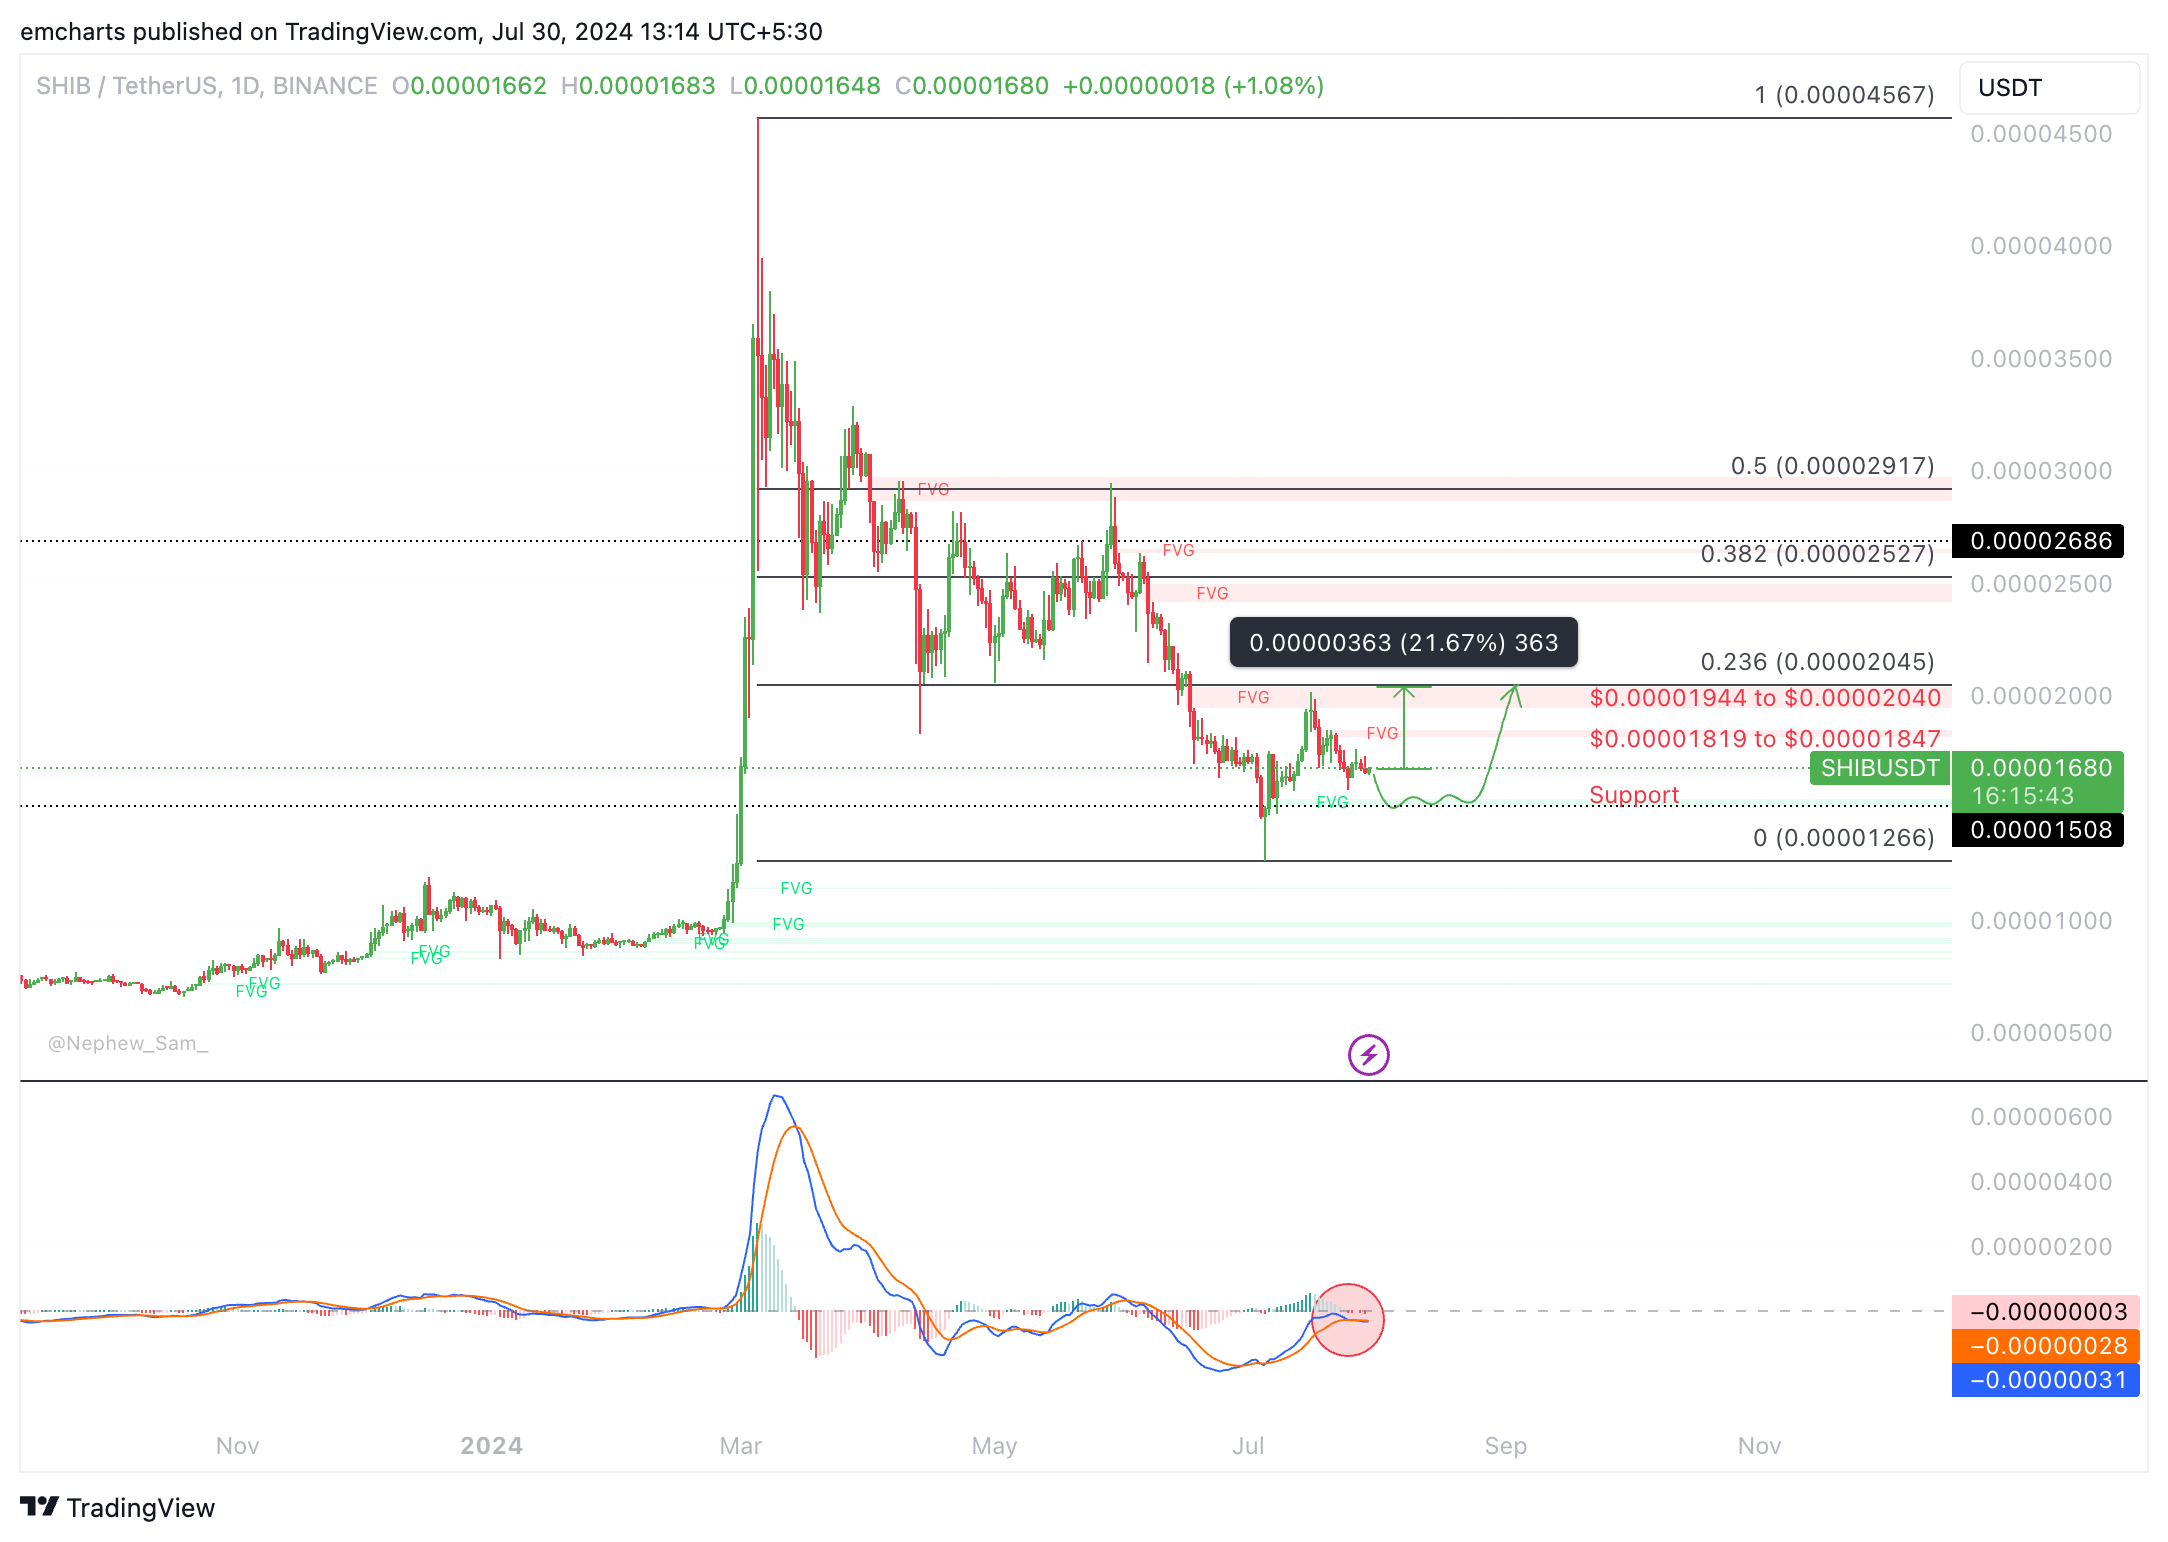
SHIB/USDT daily chart
Looking down, a daily candlestick close below $0.00001508 could invalidate the bullish thesis. Further down, the July 5 low of $0.00001266 could act as support for the meme coin.
Bitcoin, altcoins, stablecoins FAQs
Bitcoin is the largest cryptocurrency by market capitalization, a virtual currency designed to serve as money. This form of payment cannot be controlled by any one person, group, or entity, which eliminates the need for third-party participation during financial transactions.
Altcoins are any cryptocurrency apart from Bitcoin, but some also regard Ethereum as a non-altcoin because it is from these two cryptocurrencies that forking happens. If this is true, then Litecoin is the first altcoin, forked from the Bitcoin protocol and, therefore, an “improved” version of it.
Stablecoins are cryptocurrencies designed to have a stable price, with their value backed by a reserve of the asset it represents. To achieve this, the value of any one stablecoin is pegged to a commodity or financial instrument, such as the US Dollar (USD), with its supply regulated by an algorithm or demand. The main goal of stablecoins is to provide an on/off-ramp for investors willing to trade and invest in cryptocurrencies. Stablecoins also allow investors to store value since cryptocurrencies, in general, are subject to volatility.
Bitcoin dominance is the ratio of Bitcoin's market capitalization to the total market capitalization of all cryptocurrencies combined. It provides a clear picture of Bitcoin’s interest among investors. A high BTC dominance typically happens before and during a bull run, in which investors resort to investing in relatively stable and high market capitalization cryptocurrency like Bitcoin. A drop in BTC dominance usually means that investors are moving their capital and/or profits to altcoins in a quest for higher returns, which usually triggers an explosion of altcoin rallies.
Recommended Articles


