
Fantom (FTM) Bears Pause as Exchange Supply Hits 2-Year Low
On Wednesday, the number of Fantom (FTM) coins held in wallets on cryptocurrency exchanges fell to a two-year low of 639 million, its lowest number since January 10, 2022.
This decline in FTM’s supply on exchanges amid the broader market rally is a good precursor for an uptrend.
Fantom Witnesses Decline in Selling Pressure
Fantom’s supply on cryptocurrency exchanges has declined steadily since it climbed to a year-to-date peak of 674 million coins on April 4. Since then, it has fallen by 5%.
When an asset’s supply on exchanges falls, fewer units of that asset are available for trading on those platforms. This may be because investors are moving their holdings away from exchanges into private wallets for long-term holding.
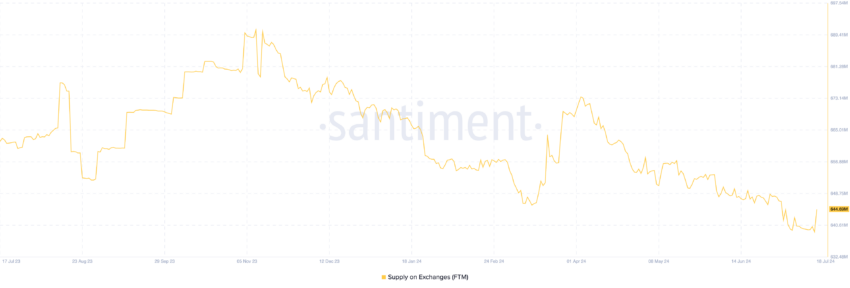 Fantom Supply on Exchanges. Source: Santiment
This move is often considered a bullish signal because it leads to a drop in selling pressure. The reason for this is simple: with fewer coins available for sale on exchanges, there is less downward pressure on the price, potentially driving up an asset’s value.
Further, the coin’s Mean Coin Age has been in an uptrend, confirming that FTM has indeed witnessed network-wide accumulation since its supply on exchanges began to fall.
Read More: Top 5 Yield Farms on Fantom
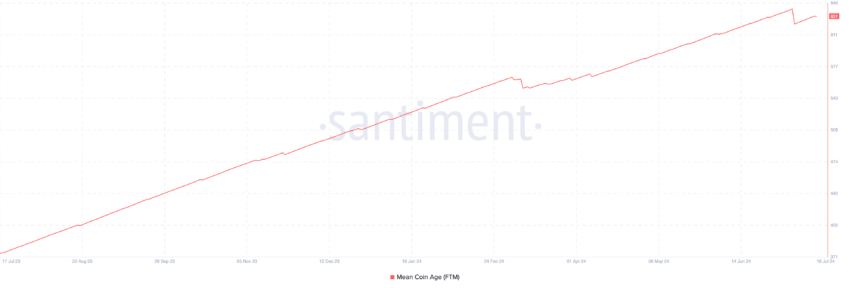 Fantom Mean Coin Age. Source: Santiment
This metric measures the average age of all coins or tokens within a specific blockchain. In simpler terms, it tells you how long coins have been held by their current owners on average.
When it maintains an uptrend, it means the coins are being held longer. As of this writing, FTM’s Mean Coin Age is 631.
FTM Price Prediction: Coin’s Next Price Target is Above $0.5
As of this writing, FTM exchanged hands at $0.49. Its value has surged by 4% in the last month. The coin’s Parabolic Stop and Reverse (SAR) indicator hints at the possibility of a sustained rally. At press time, the dots of this indicator lie below FTM’s price. They have been so positioned since July 9.
This indicator identifies an asset’s potential trend direction and reversal points. When its dots lie under an asset’s price, the market is in an uptrend. It indicates an asset’s price is rising, and the rally may continue.
If this uptrend continues, FTM will exchange hands above $0.5 to sell for $0.57.
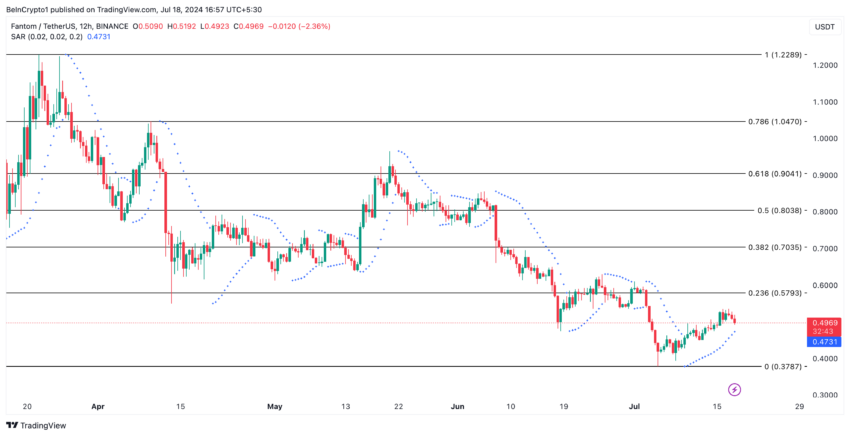 Fantom Analysis. Source: TradingView
However, if the trend reverses and a downtrend begins, the coin’s value may drop to $0.37.
Recommended Articles


