Gold Price Forecast: XAU/USD holds key 20-day EMA above $3,350, US-Iran tensions escalate

Gold price trades subduedly above $3,500 as higher US Dollar limits its upside.
Iran vows to retaliate against the US for destroying three nuclear facilities.
Fed’s Waller support interest rate cuts in July to offset upside risks to labor market.
Gold price (XAU/USD) exhibits a sluggish performance above $3,350 during European trading hours on Monday. The precious metal trades slightly lower even though tensions between the United States (US) and Iran have escalated after Tehran vows to retaliate for striking three nuclear facilities, which was aimed to dismantle country’s ambitions.
A report from the Bloomberg showed last week that senior US officials are preparing for a possible attack on Iran as soon as the weekend, aiming to restrict Tehran from building nuclear warheads.
During the European trading session, the new head of Iran’s military, Major General Amir Hatami, said every time Americans have committed crimes against Iran, they’ve received a decisive response, and it will be the same this time, Fars news agency reported.
Theoretically, heightened geopolitical tensions improve demand for safe-haven assets, such as Gold. However, upbeat US Dollar (USD) has capped the Gold price’s upside. The US Dollar Index (DXY), which tracks the Greenback’s value against six major currencies, refreshes three-week high around 99.40. Technically, higher US Dollar makes Gold an expensive bet for investors.
Meanwhile, a slight increase in US bond yields has also weighed on the Gold price. 10-year US Treasury yields rose 0.4% to near 4.39%. Higher yields on interest-bearing assets diminish demand for non-yielding assets, such as Gold.
US Treasury yields rise even though Federal Reserve (Fed) Governor Christopher Waller has argued in favor of reducing interest rates in the July policy meeting, cited concerns over the labor market outlook. “The Fed should not wait for the job market to crash in order to cut rates," Waller said.
Gold technical analysis
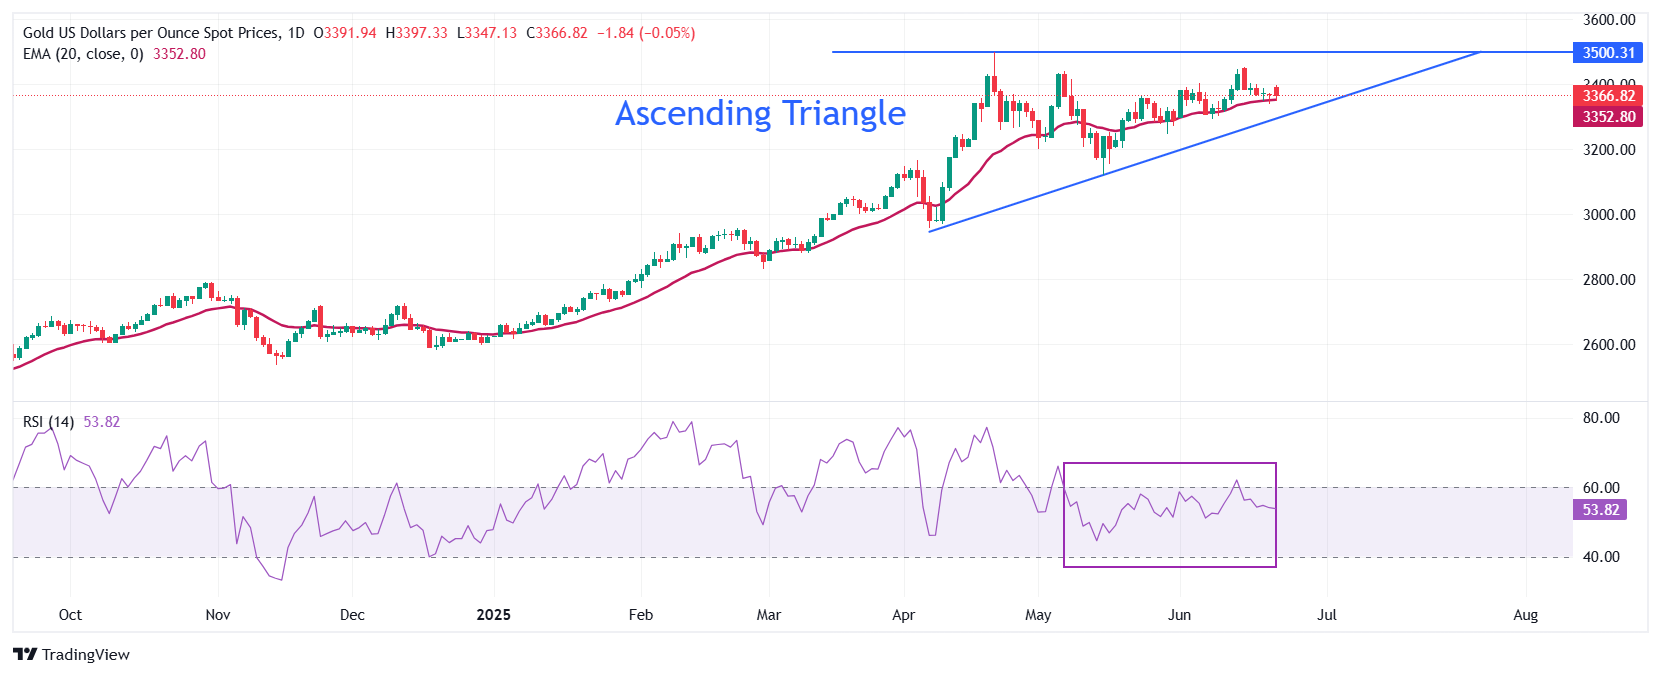
Gold price trades in an Ascending Triangle formation on a daily timeframe, which indicates volatility contraction. The horizontal resistance of the above-mentioned chart pattern is plotted from the April 22 high around $3,500, while the upward-sloping trendline is placed from the April 7 low of $2,957.
The 20-day Exponential Moving Average (EMA) continues to provide support to the Gold price around $3,350
The 14-day Relative Strength Index (RSI) struggles to break above 60.00. A fresh bullish momentum would emerge if the RSI breaks above that level.
Looking up, the Gold price would enter in an unchartered territory after breaking above the psychological level of $3,500 decisively. Potential resistances would be $3,550 and $3,600.
Alternatively, a downside move by the Gold price below the May 29 low of $3,245 would drag it towards the round-level support of $3,200, followed by the May 15 low at $3,121.
Gold daily chart

* The content presented above, whether from a third party or not, is considered as general advice only. This article should not be construed as containing investment advice, investment recommendations, an offer of or solicitation for any transactions in financial instruments.

