

Shiba Inu (SHIB) Price Climbs to 30-Day High, Eyes More Gains
In the early trading hours of Tuesday, the leading meme coin, Shiba Inu (SHIB), traded briefly at a monthly high of $0.000020.
Although it has since retraced and is currently trading at $0.000019, SHIB remains poised to reclaim this high and continue its uptrend.
Shiba Inu Seeks New Highs
As assessed on a daily chart, some of Shiba Inu’s key technical indicators confirm the possibility of a sustained rally.
Its Moving Average Convergence/Divergence (MACD), which tracks an asset’s price trends and measures momentum, suggests a steady rise in the bullish sentiment trailing SHIB.
Since July 5, SHIB’s MACD line (blue) has rested above the signal line (orange) and has trended toward the zero line in an attempt to breach it. When an asset’s MACD line crosses its signal line and is headed toward its zero line, it signifies a significant shift in market momentum from bearish to bullish.
Read More: How To Buy Shiba Inu (SHIB) and Everything You Need To Know
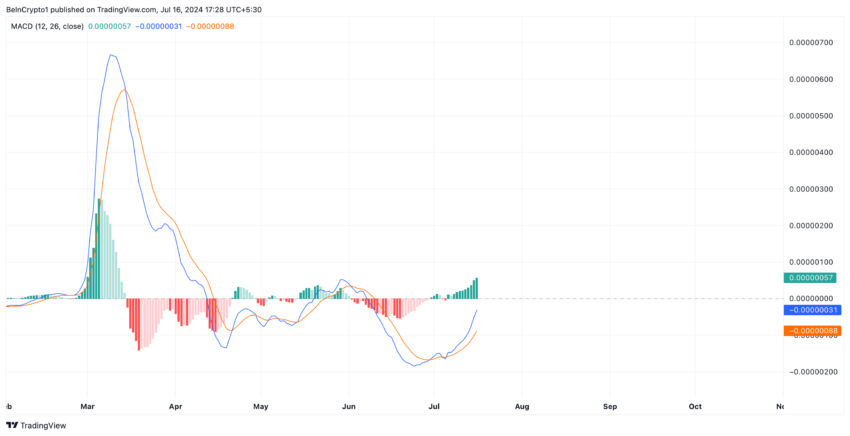 Shiba Inu MACD Analysis. Source: TradingView
If SHIB successfully crosses the zero line, the current bullish trend will be confirmed, potentially attracting more buyers and driving its price higher.
Further, readings from SHIB’s Elder-Ray index show that bull power is currently dominant. At press time, the indicator’s value is 0.0000036. It has returned only positive values since July 13.
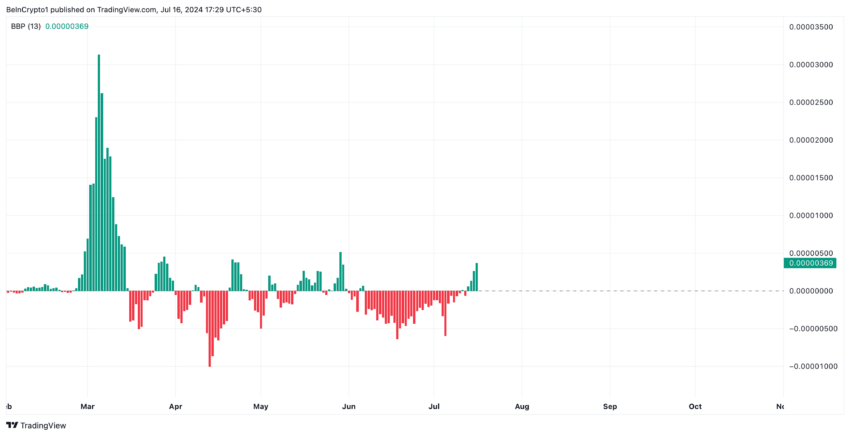 Shiba Inu Elder-Ray Index Analysis. Source: TradingView
The indicator measures the relationship between the strength of an asset’s buyers and sellers. When its value is positive, it means that bullish strength outweighs bearish efforts in the market.
SHIB Price Prediction: Activity Has Spiked in Its Futures Market
SHIB’s price hike has also led to an uptick in its derivatives market. At press time, the coin’s futures open interest currently sits at a one-month high of $39 million. It has increased by over 40% in the past seven days.
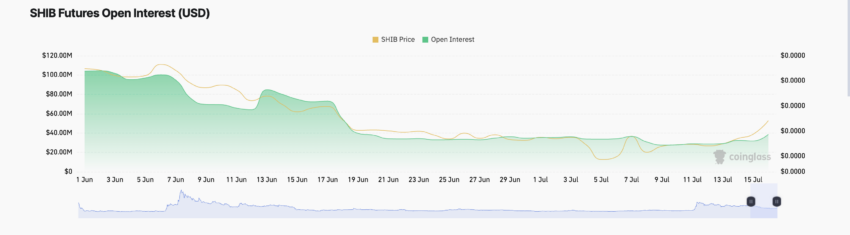 Shiba Inu Futures Open Interest. Source: Coinglass
An asset’s futures open interest refers to the total number of outstanding futures contracts that have not been settled. When it spikes, it means that more traders are entering into new positions. This bullish signal can potentially send an asset’s value to new highs.
If this holds true in SHIB’s case, the meme coin’s price will reclaim and rally past the $0.000020 price level. It may exchange hands at $0.000025.
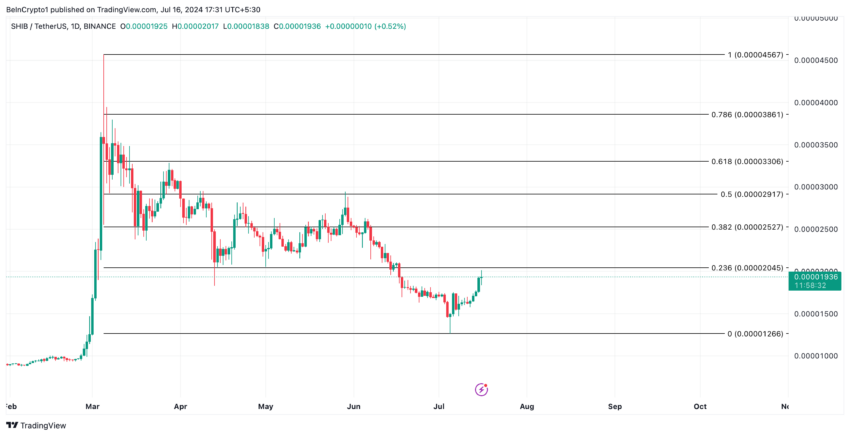 Shiba Inu Analysis. Source: TradingView
However, if market sentiment shifts from bullish to bearish, the coin’s price will plummet to $0.000012.
Recommended Articles


