


Altcoin Dominance Continues to Drop Amid Market-Wide Decline
Altcoin dominance has fallen by 2% over the past week. This indicates that crypto assets other than Bitcoin (BTC) have underperformed compared to the leading cryptocurrency.
Meanwhile, Bitcoin’s dominance has seen a modest increase of 1% during the same period. This suggests that the coin has witnessed more trading activity than altcoins in the seven-day period under review.
Brett (BRETT) Leads as the Altcoin With the Most Losses
Referred to as Pepe’s (PEPE) best friend on Base Chain, Brett (BRETT) is the altcoin with the most losses in the past seven days. Exchanging hands at $0.12 at press time, the altcoin’s value has plunged by 23% in the last week.
Impacted by the general decline in activity in the altcoin market, BRETT’s demand by market participants has dwindled in the past few weeks. Measured by its Relative Strength Index (RSI), the on-chain metric shows that BRETT’s selling pressure currently exceeds all buying activity. As of this writing, the metric’s value is below the 50-neutral line at 49.52.
 Brett Relative Strength Index. Source: Santiment
An asset’s RSI measures its overbought and oversold market conditions. It ranges between 0 and 100. Values above 70 suggest that the asset is overbought and due for a decline, while values below 30 signal that the asset is oversold and may witness a reversal.
Confirming the bearish bias toward the altcoin, its Elder-Ray Index has returned only negative values since July 3. As of this writing, the indicator’s value is -0.01.
If the current downtrend is maintained, BRETT’s price may fall to $0.10.
Read More: 12 Best Altcoin Exchanges for Crypto Trading in July 2024
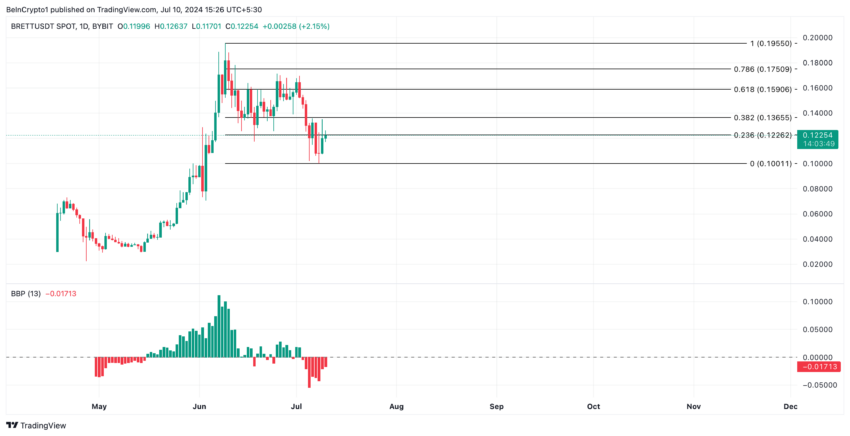 Brett Analysis. Source: TradingView
However, a spike in buying activity will invalidate the bearish projection above. It will push the altcoin’s price to $0.13.
Sui (SUI) Charges Toward Key Moving Average
Also mirroring the general decline in the altcoin market, Sui’s (SUI) value has dropped by 10% in the past seven days.
However, readings from its price movements on a one-day chart suggest a spike in buying activity. For example, SUI’s price trends toward its 20-day exponential moving average (EMA) appear poised to cross above it.
An asset’s 20-day EMA measures its average price over the past 20 days. When an asset’s price attempts to cross above this key moving average, it is a bullish signal. It suggests buyers are gaining control, potentially pushing the price higher.
If SUI buying activity continues to surge, its price might rally to $0.76.
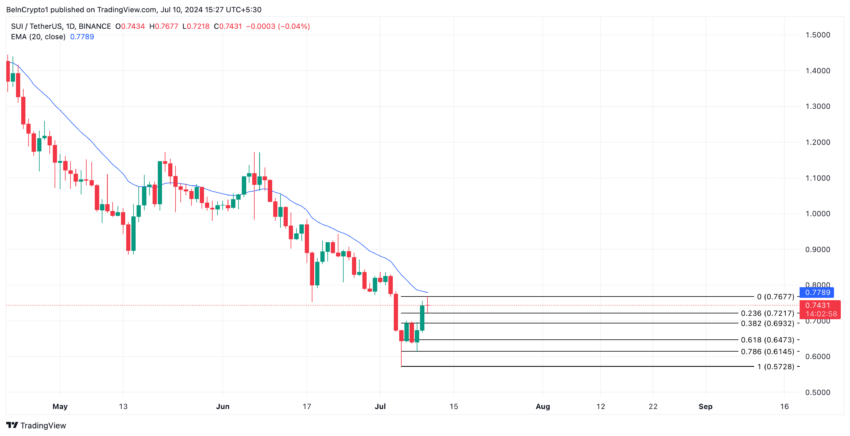 Sui Analysis. Source: TradingView
However, if profit-taking activity commences, SUI will shed its recent gains to trade at $0.72.
Recommended Articles


