GMT price poised for a 10% rally as technical indicators signal bullish momentum

Source Fxstreet
  • GMT price broke above the downward channel pattern.
  • Technical analysis shows that GMT has formed a bullish divergence on a momentum indicator.
  • A daily candlestick close below $0.184 would invalidate the bullish thesis.

GMT price surged beyond the confines of its downward channel pattern, buoyed by a bullish divergence indicated by both the Relative Strength Index (RSI) and the Awesome Oscillator (AO), potentially paving the way for an upward rally.

GMT price looks promising 

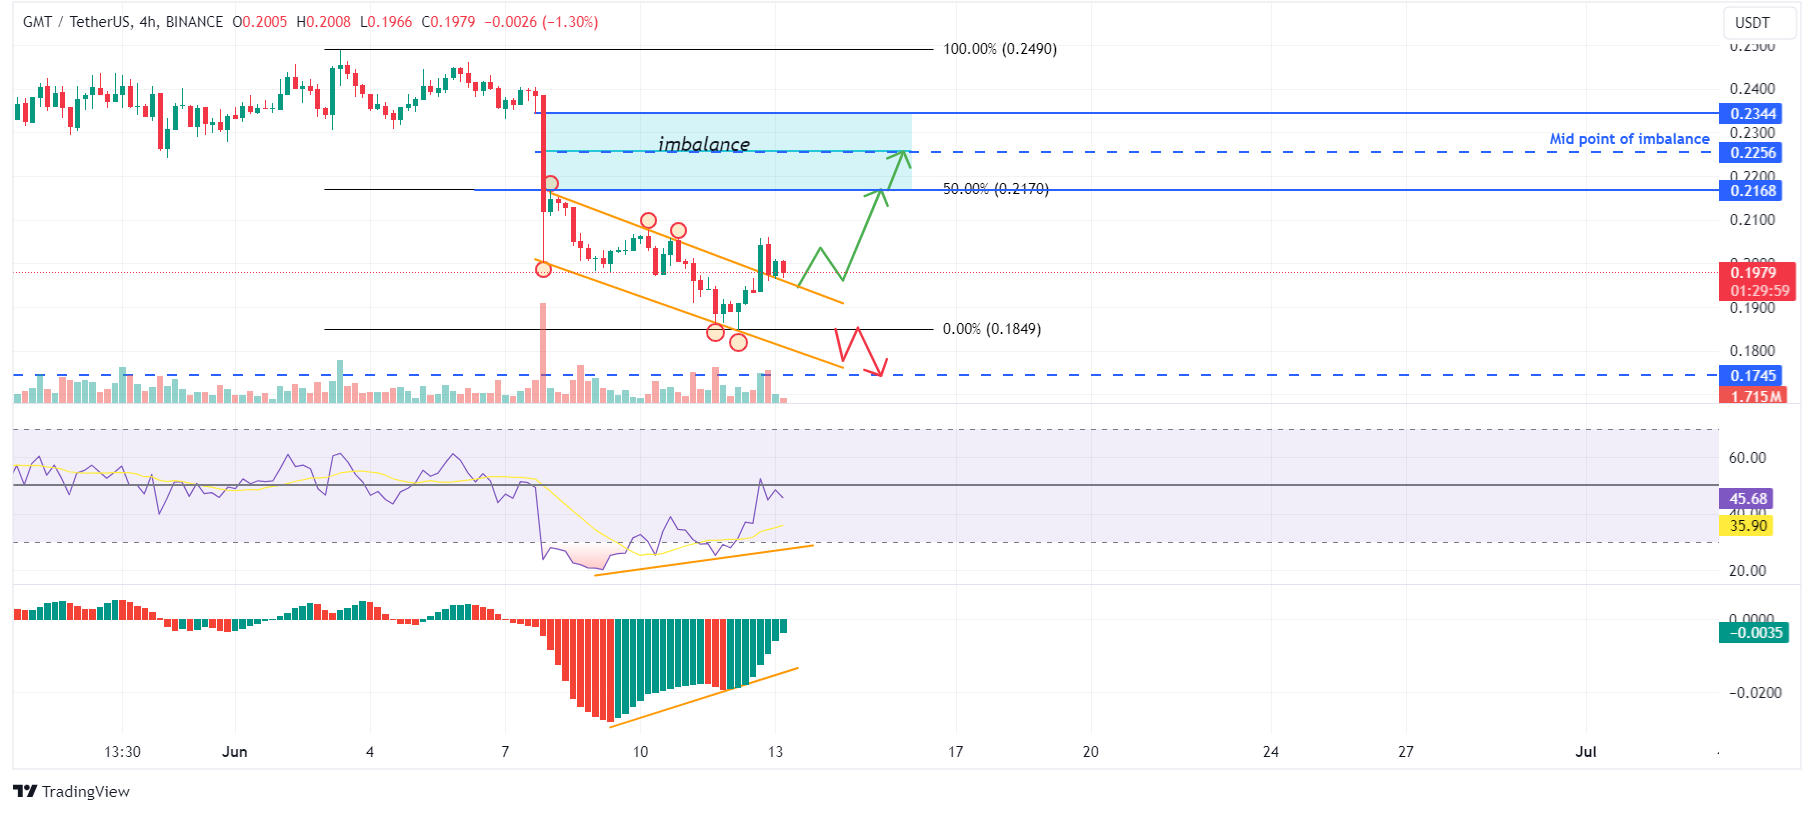
GMT price has produced three lower highs and three lower lows since June 7. Connecting these swing points using trend lines reveals a downward channel formation in the 4-hour chart.

GMT price broke out of the downward channel on June 12 and is currently supported by the upper boundary of the downward channel. If this support holds, then GMT price could rally 10% to tag $0.217, its 50% price retracement level drawn from a swing high of $0.249 on June 3 to a swing low of $0.184 on June 12.

The RSI and the AO support this bullish thesis. The lower low formed on June 12 does not reflect the RSI higher high for the same period. This development is termed a bullish divergence and often leads to the reversal of the trend or a short-term rally.

If the bulls are aggressive and the overall crypto market outlook is positive, then GMT could extend an additional rally of roughly 4% to tag the midpoint of the price imbalance at $0.225, formed between $0.216 and $0.234. 
GMT/USDT 4-hour chart

GMT/USDT 4-hour chart

However, if the GMT price produces a daily candlestick close below $0.184, it would produce a lower low in the daily time frame. Such a development would give rise to a bearish market structure. This change in market structure would invalidate the bullish thesis and catalyze a 6% crash in the GMT price to revisit the previous support level of $0.174.

Disclaimer: For information purposes only. Past performance is not indicative of future results.
placeholder
Ethereum Price Forecast: ETH tests $3,000 following strong ETF and treasury inflowsEthereum (ETH) climbed above $2,900 on Thursday, mimicking the rally seen in Bitcoin.
Author  FXStreet
Yesterday 01: 36
Ethereum (ETH) climbed above $2,900 on Thursday, mimicking the rally seen in Bitcoin.
placeholder
Bitcoin's surge to new all-time high sparks $1 billion in short liquidationsBitcoin (BTC) traded above 4% on Thursday after soaring to a new all-time high above $116,800. The rally, which appears to be leverage-driven, triggered over a $1 billion short-squeeze across the entire crypto market.
Author  FXStreet
Yesterday 03: 24
Bitcoin (BTC) traded above 4% on Thursday after soaring to a new all-time high above $116,800. The rally, which appears to be leverage-driven, triggered over a $1 billion short-squeeze across the entire crypto market.
placeholder
Japanese Yen dives back closer to weekly trough against a broadly firmer USDThe Japanese Yen (JPY) drifts lower against a broadly stronger US Dollar (USD) during the Asian session on Friday.
Author  FXStreet
Yesterday 03: 45
The Japanese Yen (JPY) drifts lower against a broadly stronger US Dollar (USD) during the Asian session on Friday.
placeholder
Dogecoin (DOGE) Rockets to $0.20 — Can It Go Even Higher?Dogecoin started a fresh increase above the $0.180 zone against the US Dollar.
Author  NewsBTC
21 hours ago
Dogecoin started a fresh increase above the $0.180 zone against the US Dollar.
placeholder
Gold price approaches weekly high as tariff jitters boost safe-haven demandGold price (XAU/USD) is gaining positive traction for the third consecutive day on Friday and approaching the top end of its weekly range amid rising trade tensions.
Author  FXStreet
21 hours ago
Gold price (XAU/USD) is gaining positive traction for the third consecutive day on Friday and approaching the top end of its weekly range amid rising trade tensions.
goTop
quote