


Ethereum slightly tilts toward bears, draws comparison to silver in recent prediction
- Ethereum ETFs will see only 20% of Bitcoin ETFs flows as it may be viewed like Silver.
- Hashdex withdrew its spot ETH ETF application after failing to submit updated 19b-4 with SEC.
- Ethereum may begin trading within key range until ETF S-1 approval.
Ethereum (ETH) sustained its sideways movement on Wednesday as Bloomberg analyst Eric Balchunas compared spot ETH ETFs to Silver ETFs, predicting that they will only see 20% of the flows recorded across Bitcoin ETFs.
Daily digest market movers: 20% of Bitcoin flows, Hashdex, L2 subcultures
Ethereum is slightly trending downward on Wednesday following fading ETF euphoria. Here are the latest news surrounding the number one altcoin:
In a recent X update, Bloomberg analyst Eric Balchunas used Silver ETFs vs. Gold ETFs to compare the potential performance of spot ETH ETFs vs. Bitcoin ETFs. According to Balchunas, Ethereum will be seen as similar to Silver, which has only a 15% share compared to Gold ETFs. "Many won't feel the need to go beyond Bitcoin/Gold for their crypto/precious metals allocation," said Balchunas.
Also read: Ethereum may continue outperforming Bitcoin as 'programmable money' may be ETH's new slogan
He also highlighted how the low share of ETH ETFs vs. Bitcoin ETFs in other regions forms the basis for a final prediction that spot ETH ETFs would only capture 20% of Bitcoin ETF flows.
The Securities & Exchange Commission's (SEC) latest filings revealed that Hashdex withdrew its spot ETH ETF proposal after failing to update 19b-4 forms like other issuers. The issuers that received 19b-4 approval on May 23 were VanEck, BlackRock, Franklin Templeton, Invesco & Galaxy, Fidelity, Grayscale, Bitwise and ARK 21Shares.
Volatility Shares 2x Ether Strategy ETF (ETHU) will launch on June 4 after approval from the SEC, according to a post on the company's website. The ETF aims to track twice the price performance of ETH and will become the first leveraged Ethereum ETF in the US.
Volatility Shares is one of the largest holders of Bitcoin futures contracts at the Chicago Mercantile Exchange (CME) after launching a Bitcoin 2x fund in June 2023. Many members of the crypto community see their ETH leveraged futures ETF approval as further confirmation that the SEC may have abandoned its investigations into Ethereum’s potential security status.
Read more: Ethereum may shoot past $4,000 as Michael Saylor believes spot ETH ETF will help Bitcoin
In a recent article, Ethereum co-founder Vitalik Buterin discussed how Layer 2s allow cultural extensions of the Ethereum ecosystem. "Layer 2s allow subcultures to emerge that are armed with substantial resources, and a feedback loop that forces them to learn and adapt in order to be effective in the real world," said Buterin.
He also stated how every Ethereum Layer 2 — including Polygon, Metis, Arbitrum, Optimism, etc. — has a unique soul: "some combination of Ethereum's culture, together with its own particular twist."
ETH technical analysis: Ethereum could sustain sideways move within key range
Ethereum is trading below $3,800 on Wednesday as it tilts further toward downside pressure in its sideways movement.
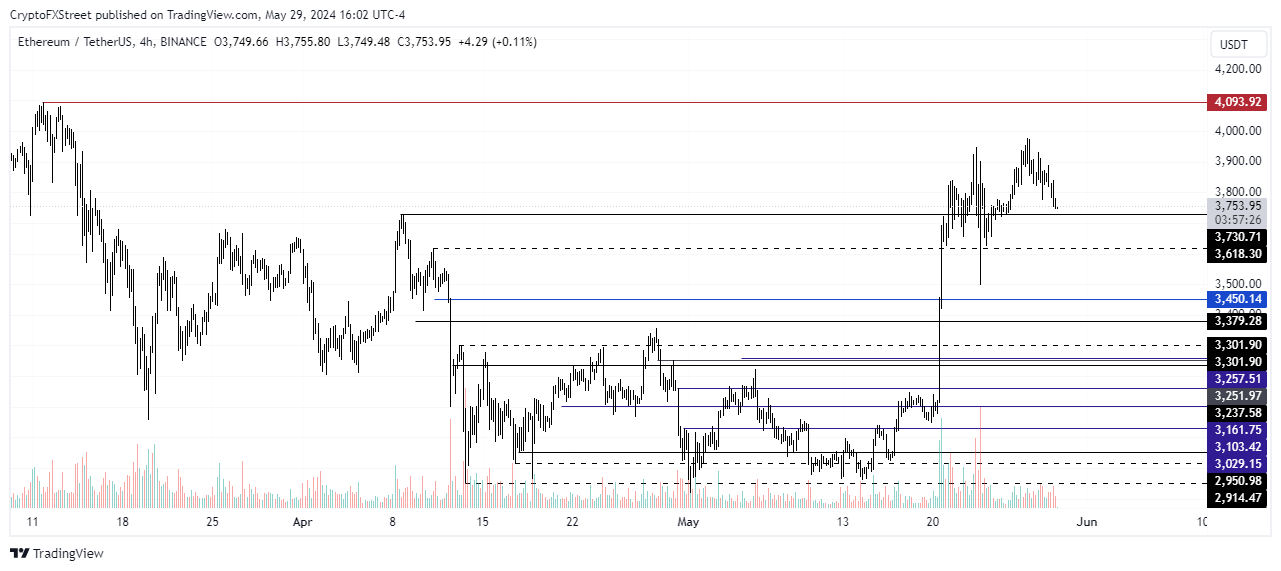
ETH/USDT 4-hour chart
The $4,000 and $3,605 range may prove crucial in the coming weeks until the spot ETH ETF S-1 registration approval. ETH will likely trade inside the range as it has failed to sustain any move outside since the spike of May 20. The only exception will be if a major bullish or bearish news hits the market. This sentiment is hinged on the general crypto market movement, which shows both bulls and bears have slowed down activity.
Also read: Week Ahead: Checking the health of Bitcoin’s bull run
ETH may resume its rally and break past the March high of $4,093 if positive information surrounding spot ETH ETFs enters the market.
ETH liquidation data reveals long liquidations are at $17.37 million, while shorts sit at $5.93 million.
Ethereum FAQs
Ethereum is a decentralized open-source blockchain with smart contracts functionality. Serving as the basal network for the Ether (ETH) cryptocurrency, it is the second largest crypto and largest altcoin by market capitalization. The Ethereum network is tailored for scalability, programmability, security, and decentralization, attributes that make it popular among developers.
Ethereum uses decentralized blockchain technology, where developers can build and deploy applications that are independent of the central authority. To make this easier, the network has a programming language in place, which helps users create self-executing smart contracts. A smart contract is basically a code that can be verified and allows inter-user transactions.
Staking is a process where investors grow their portfolios by locking their assets for a specified duration instead of selling them. It is used by most blockchains, especially the ones that employ Proof-of-Stake (PoS) mechanism, with users earning rewards as an incentive for committing their tokens. For most long-term cryptocurrency holders, staking is a strategy to make passive income from your assets, putting them to work in exchange for reward generation.
Ethereum transitioned from a Proof-of-Work (PoW) to a Proof-of-Stake (PoS) mechanism in an event christened “The Merge.” The transformation came as the network wanted to achieve more security, cut down on energy consumption by 99.95%, and execute new scaling solutions with a possible threshold of 100,000 transactions per second. With PoS, there are less entry barriers for miners considering the reduced energy demands.
Recommended Articles


