


Solana Price Forecast: Strong ETF inflows hint at a rally
- Solana price holds constructive bullish bias as it rebounds, finding support around the 100-day EMA at $94 on Wednesday.
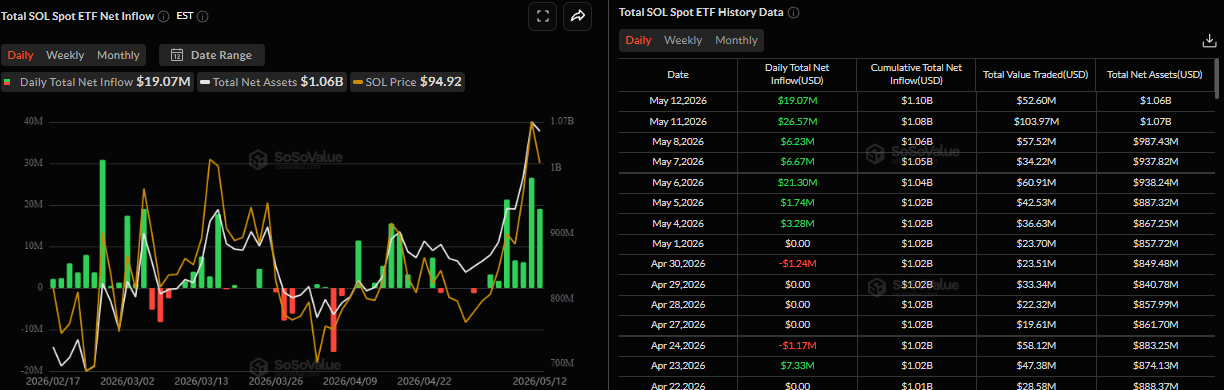
- Institutional demand remained strong, with spot SOL ETFs recording inflows of $19.07, marking the seventh consecutive day of positive flows.
- Derivatives metrics back bullish bias, with funding rates turning positive and long bets nearing the highest level in a month.
Solana (SOL) price rebounds, finding support around the key technical level near $94 on Wednesday. Strong institutional demand, with spot SOL Exchange Traded Funds (ETFs) recording inflows for the seventh consecutive day, hints at a potential rally ahead. Meanwhile, improving sentiment among traders in the derivative markets also projects a bullish bias for Solana.
Strong institutional demand for SOL
Institutional demand has remained strong so far this week. SoSoValue data shows that spot Solana ETFs recorded inflows of $19.07 million on Tuesday, after $26.57 million the previous day. Tuesday’s inflow marks the seventh consecutive day of positive flows since May 4. If this inflow continues and intensifies, SOL could see an upside move ahead.
Derivatives data flips bullish
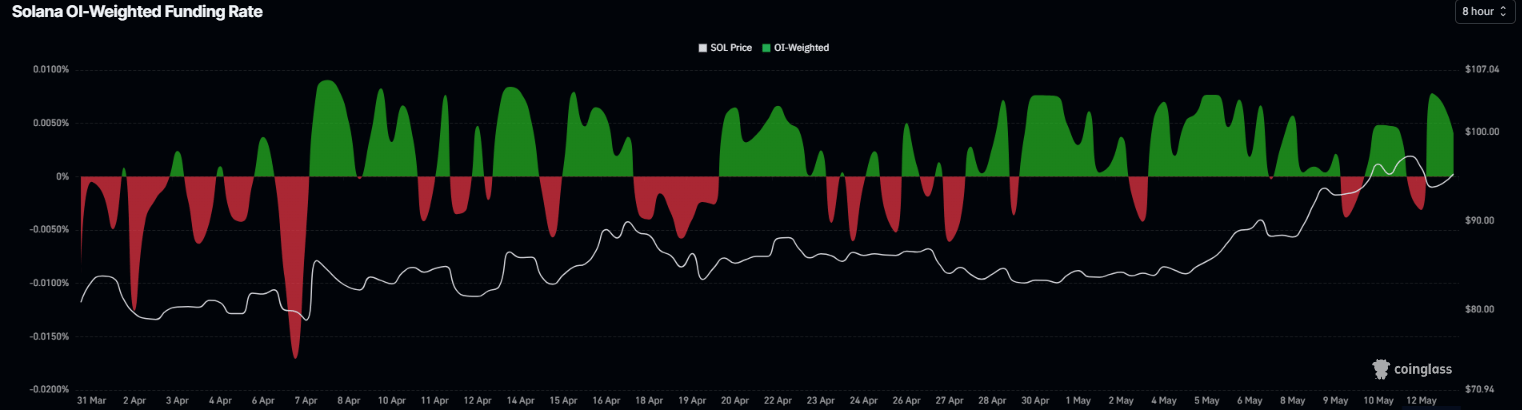
On the derivatives side, metrics also support a positive bias. Solana’s funding rates flipped positive on Tuesday and surge to 0.0041% on Wednesday, indicating that longs are paying shorts, supporting a bullish sentiment among traders.
CoinGlass’ long-to-short ratio for Solana read 1.06 on Wednesday, nearing the highest level over a month. This ratio, being above one, reflects bullish sentiment in the market, as more traders are betting on the asset price to rally.
Solana Price Forecast: SOL key support holds
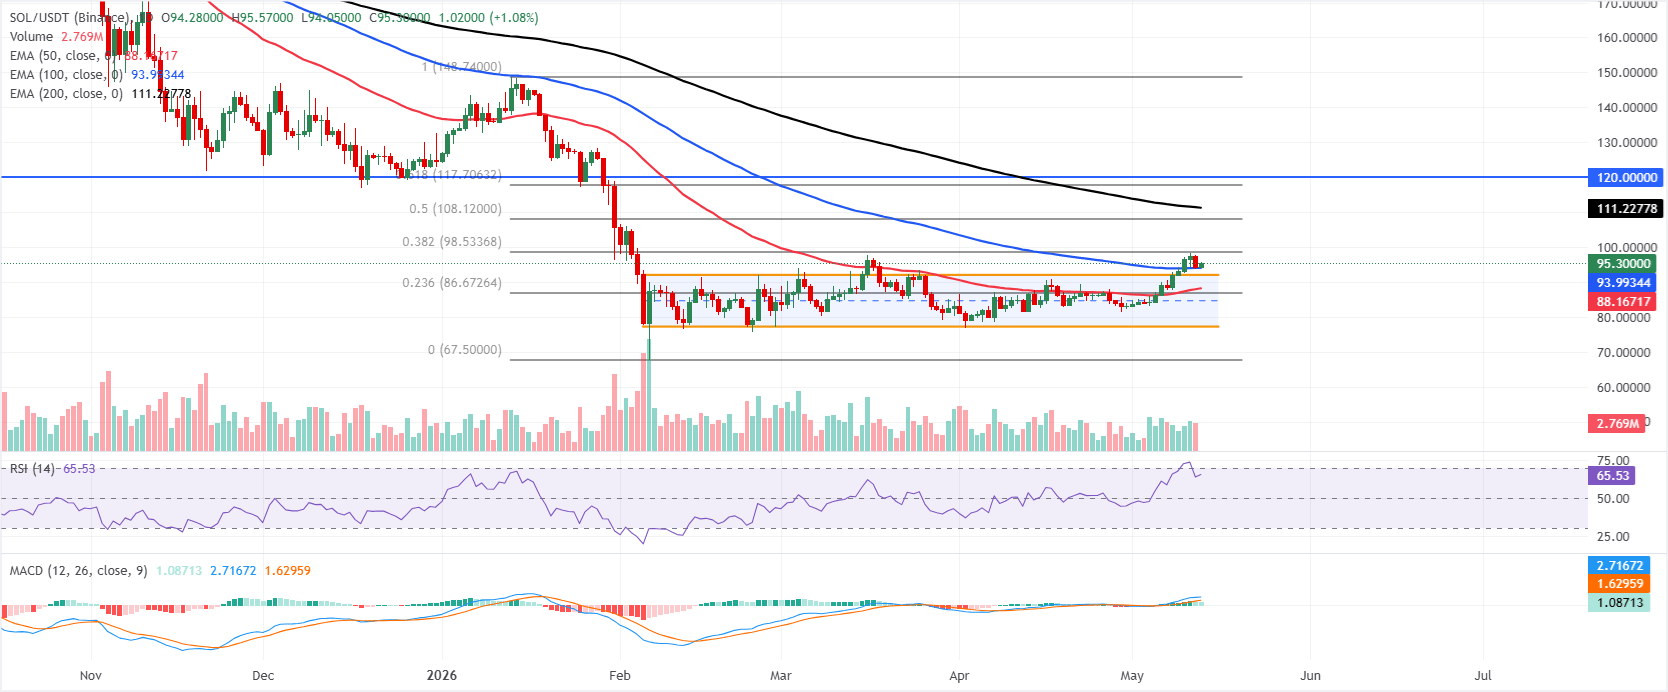
Solana price is trading at $95.30, rebounding slightly on Wednesday. SOL is holding a constructive bullish bias as it extends above the 100-day Exponential Moving Average (EMA) at roughly $93.99 and the 50-day EMA near $88.17.
Solana price has broken out over the top of its parallel channel around $92.11, suggesting a short-term shift from consolidation to recovery. At the same time, the Relative Strength Index (RSI) is near 65 points to firm but not yet overbought bullish momentum, reinforced by a positive Moving Average Convergence Divergence (MACD) reading above zero.
On the topside, initial resistance emerges at the 38.2% Fibonacci retracement of the latest swing around $98.53, ahead of the $108.12, its 50% retracement and the 200-day EMA clustered near $111.23, with a more substantial barrier at the horizontal resistance zone and 61.8% Fibonacci retracement between about $117.71 and $120.00.
On the downside, immediate support is provided by the 100-day EMA at $93.99 and the prior channel ceiling around $92.11, followed by the 50-day EMA at $88.16 and the 23.6% Fibonacci retracement near $86.67, with deeper cushions at the lower channel boundary around $77.12 and the structural swing low close to $67.50 if the current advance unwinds.
(The technical analysis of this story was written with the help of an AI tool.)
Recommended Articles


