Bitcoin Hit a 5-Month Losing Streak — On-Chain Data Screams Capitulation

Source Beincrypto

Bitcoin (BTC) has posted five consecutive monthly declines since October 2025. In March, the cryptocurrency is currently up around 0.56% amid macro headwinds.

A red close would tie the 2018–2019 stretch as the longest consecutive monthly losing streak in Bitcoin’s recorded history.

Follow us on X to get the latest news as it happens

Bitcoin Monthly Returns Since 2013.
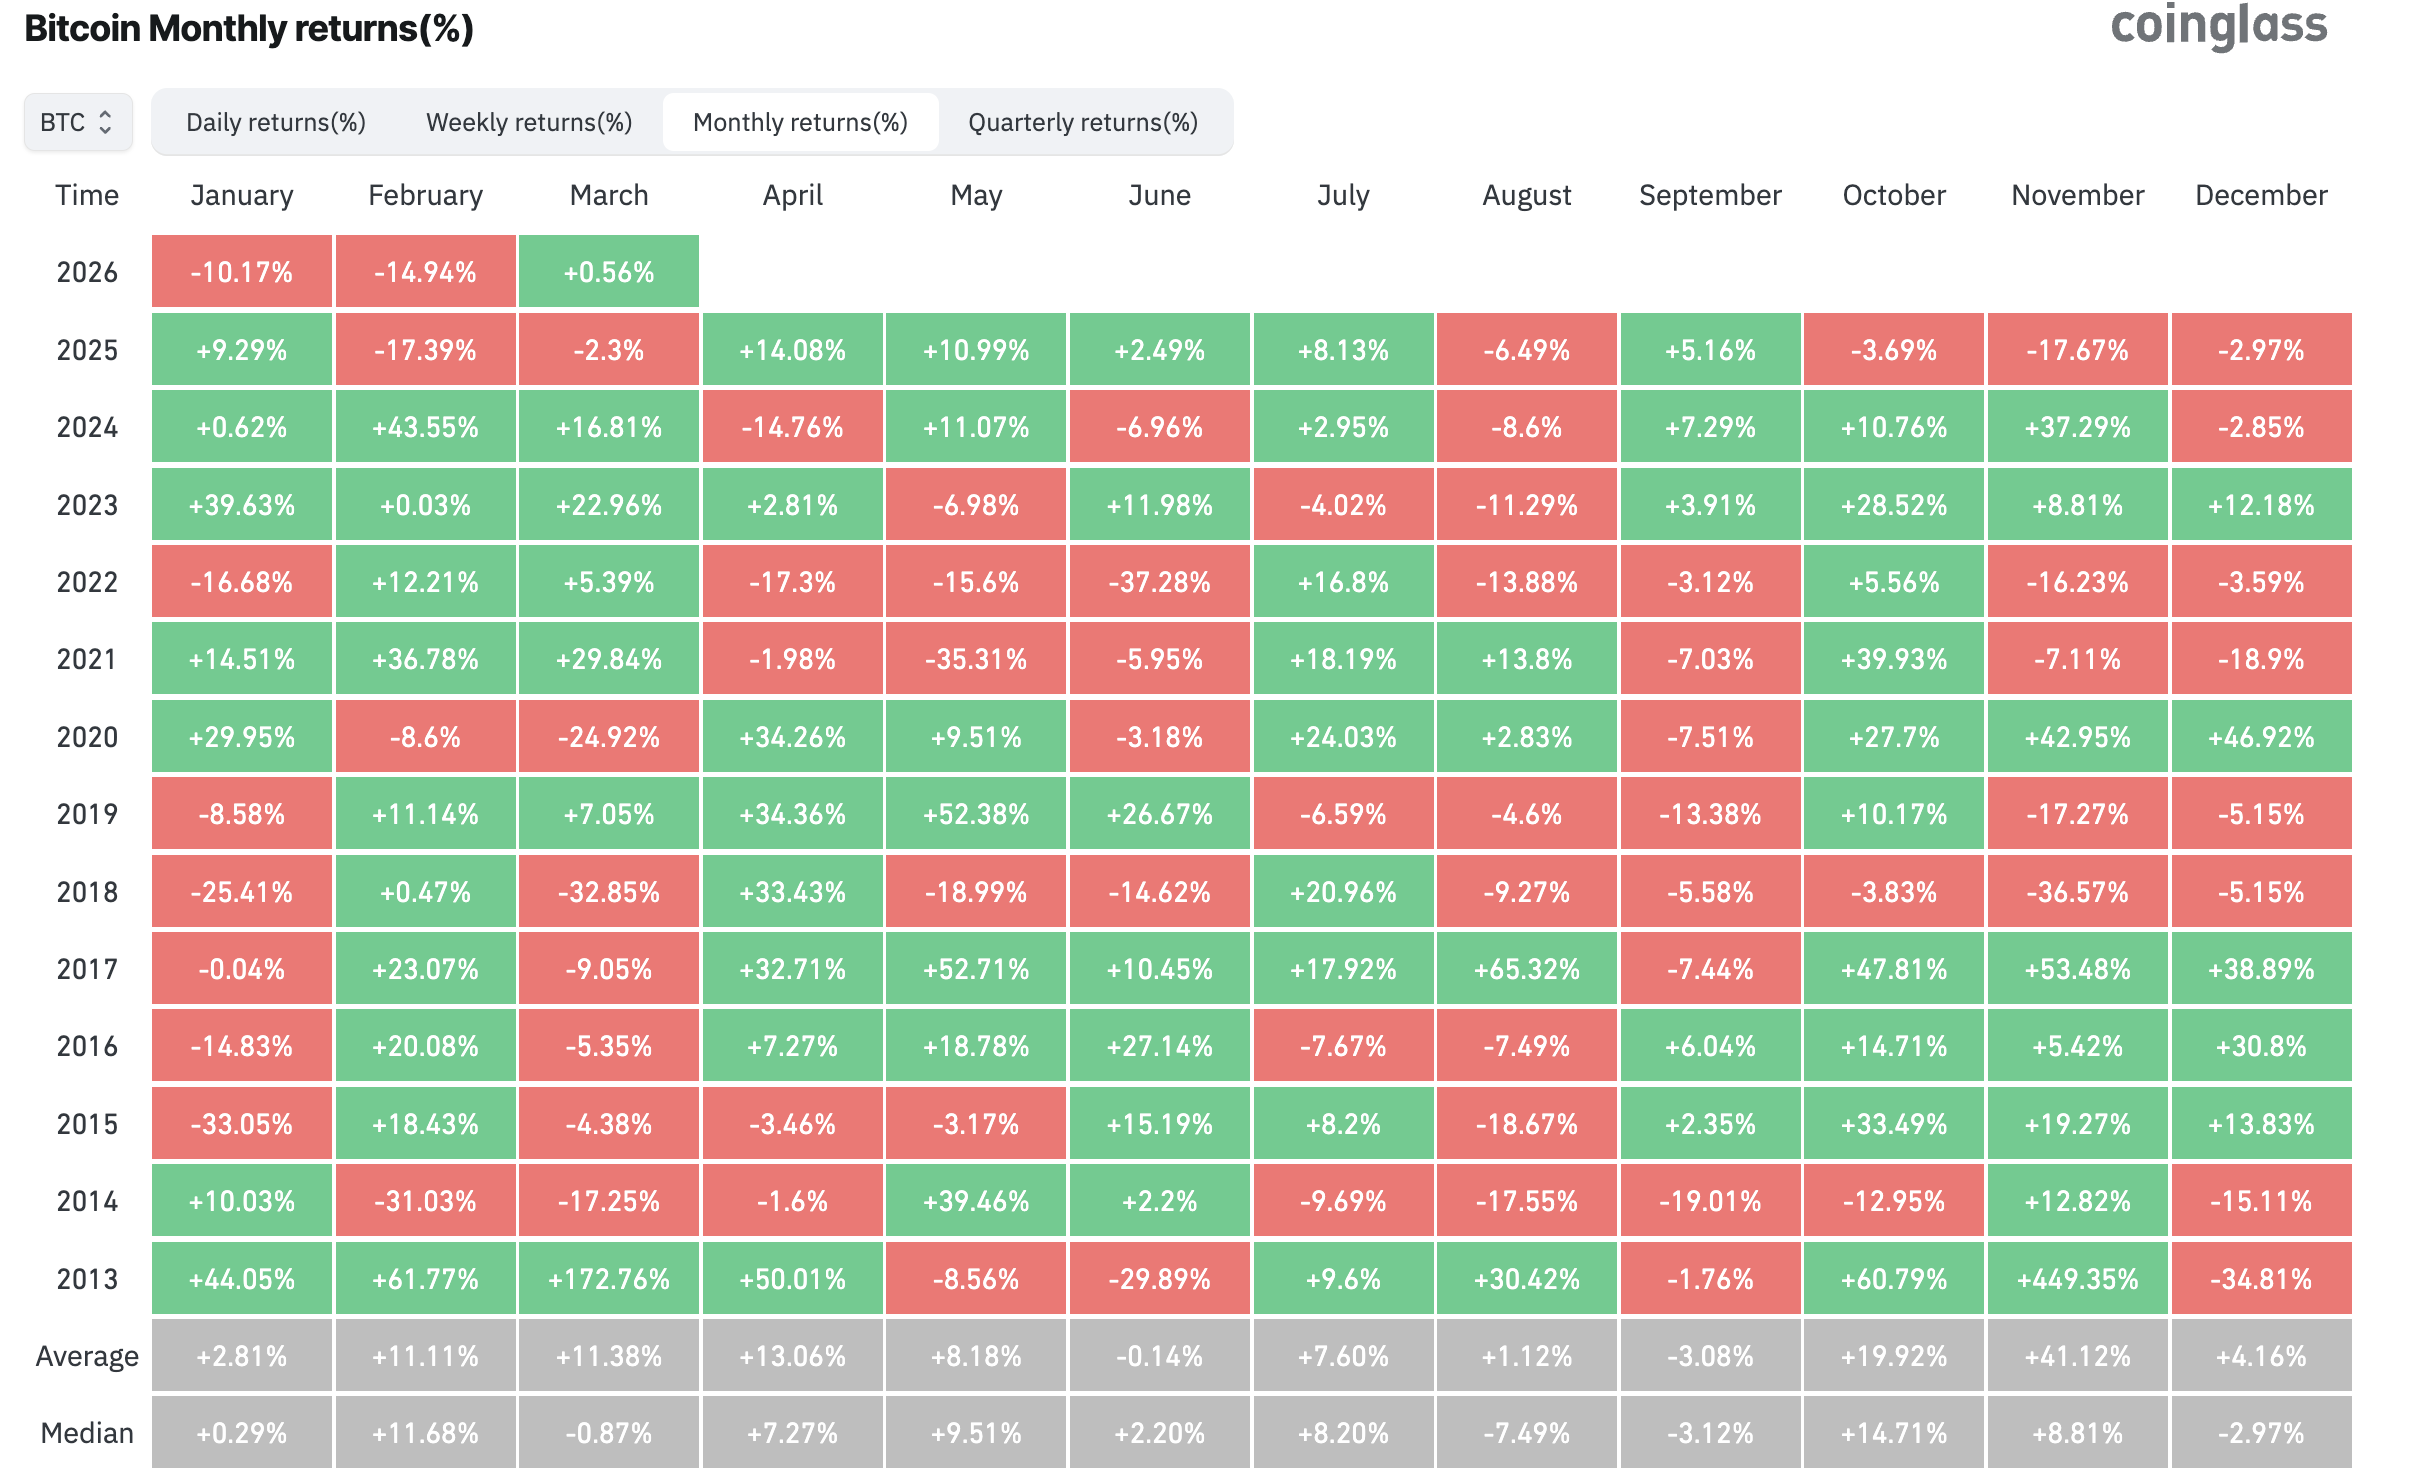
Bitcoin Monthly Returns Since 2013. Source: Coinglass

The sell-off has pushed BTC roughly 46.8% below its all-time high near $126,000. With the asset trading around $67,800, an on-chain indicator is now flashing a capitulation signal typically associated with market bottoms.

Analyst Crypto Dan flagged that the Long-Term Holder Spent Output Profit Ratio (SOPR) is below the 1.0 threshold. This means investors holding BTC for over 155 days are now selling at a loss on average.

“Because long-term holders are the least sensitive to short-term volatility, a phase in which they begin to realize losses can be interpreted as a broader market-wide capitulation. By this point, short-term holders have likely already exited the market or suffered significant losses,” the post read.

When this metric falls below 1, it typically signals a phase in which even conviction-driven participants exit positions while absorbing losses.

The analyst said that historically, such readings have preceded the exhaustion of sell-side pressure. This, in turn, results in market bottoms or zones close to long-term lows.

“While it may be premature to identify the current market as the absolute bottom, a phase in which losses become widespread would likely represent the final stage of fear and the beginning of opportunity,” Dan added.

Bitcoin Long Term Holder SOPR. 
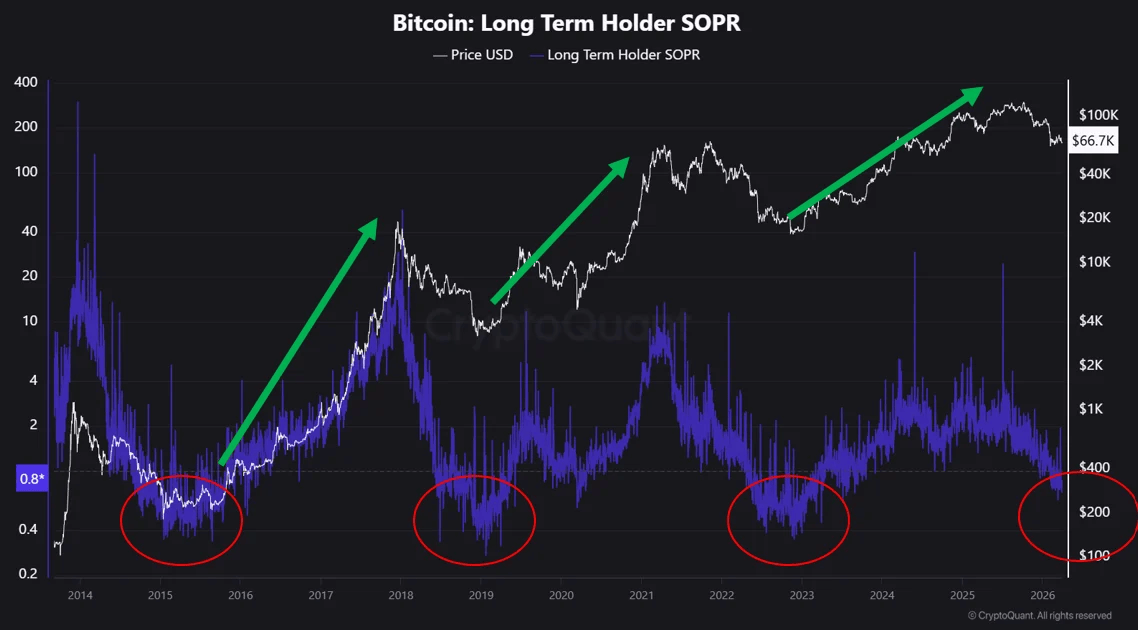
Bitcoin Long Term Holder SOPR. Source: CryptoQuant/Crypto Dan

Previously, analyst Michaël van de Poppe pointed to the BTC/Gold ratio chart, which shows a roughly 70% drawdown from its peak. 

“In any bear market, bottoms are found after a 70-85% correction.  On top of that, we’re already in a bear market for 13-14 months, and historically, that’s when $BTC has bottomed out vs. Gold. This time won’t be different,” he said.

However, on-chain analyst Willy Woo presented a more cautious outlook. Woo, citing “old school onchain models,” noted that BTC could bottom between $46,000 and $54,000.

This aligns with other analysts’ views who project a potential bottom forming below $40,000, suggesting the current sell-off may still have further to go.

Subscribe to our YouTube channel to watch leaders and journalists provide expert insights

Disclaimer: For information purposes only. Past performance is not indicative of future results.
placeholder
Natural Gas sinks to pivotal level as China’s demand slumpsNatural Gas price (XNG/USD) edges lower and sinks to $2.56 on Monday, extending its losing streak for the fifth day in a row. The move comes on the back of China cutting its Liquified Natural Gas (LNG) imports after prices rose above $3.0 in June. It
Author  FXStreet
Jul 01, 2024
Natural Gas price (XNG/USD) edges lower and sinks to $2.56 on Monday, extending its losing streak for the fifth day in a row. The move comes on the back of China cutting its Liquified Natural Gas (LNG) imports after prices rose above $3.0 in June. It
placeholder
The dollar weakened, equities dipped, and gold hit record highsThe dollar weakened, equities fell, and gold set new records on Wednesday as investors waited for a Fed rate cut later in the day.
Author  Cryptopolitan
Sep 17, 2025
The dollar weakened, equities fell, and gold set new records on Wednesday as investors waited for a Fed rate cut later in the day.
placeholder
ECB Policy Outlook for 2026: What It Could Mean for the Euro’s Next MoveWith the ECB likely holding rates steady at 2.15% and the Fed potentially extending cuts into 2026, EUR/USD may test 1.20 if Eurozone growth proves resilient, but weaker growth and an ECB pivot could pull the pair back toward 1.13 and potentially 1.10.
Author  Mitrade
Dec 26, 2025
With the ECB likely holding rates steady at 2.15% and the Fed potentially extending cuts into 2026, EUR/USD may test 1.20 if Eurozone growth proves resilient, but weaker growth and an ECB pivot could pull the pair back toward 1.13 and potentially 1.10.
placeholder
My Top 5 Stock Market Predictions for 2026Five 2026 market predictions written in a native, news-style voice: AI’s winners and losers, broader sector leadership, dividend demand, valuation cooling as the Shiller CAPE sits at 39 (Dec. 31, 2025), and quantum-computing bursts—while keeping all original facts and numbers unchanged.
Author  Mitrade
Jan 06, Tue
Five 2026 market predictions written in a native, news-style voice: AI’s winners and losers, broader sector leadership, dividend demand, valuation cooling as the Shiller CAPE sits at 39 (Dec. 31, 2025), and quantum-computing bursts—while keeping all original facts and numbers unchanged.
placeholder
Gold Price Forecast: XAU/USD opens lower around $4,450 on fears of widening Iran conflictsGold price (XAU/USD) opens over 1% lower to near $4,445.00 on Monday, as oil prices have rallied further on fears of further widening of conflicts in the Middle East. WTI Oil price is up almost 3% above $102.50 in the opening trade, increasing fears of higher inflation expectations globally.
Author  FXStreet
Yesterday 01: 40
Gold price (XAU/USD) opens over 1% lower to near $4,445.00 on Monday, as oil prices have rallied further on fears of further widening of conflicts in the Middle East. WTI Oil price is up almost 3% above $102.50 in the opening trade, increasing fears of higher inflation expectations globally.
goTop
quote