

Bullish Solana (SOL) Pattern Meets 3 Bearish Cues: 10% Bounce at Risk?
Solana price has climbed nearly 10% over the past month while trading inside a steady ascending channel since February 24. The structure remains technically bullish as the asset continues forming higher highs and higher lows.
But momentum is now approaching a critical stage. Several on-chain and derivatives signals suggest the rally could face pressure just as Solana approaches another breakout attempt.
Solana’s Ascending Channel Rally Faces Its First Technical Test
Since February 24, Solana has traded inside an ascending channel pattern, consistently forming higher highs and higher lows.
This structure often signals a gradual bullish trend where buyers continue stepping in at higher price levels.
Recently, a bullish crossover between the 20-period and 50-period exponential moving averages (EMAs) also appeared on the 12-hour chart. When a shorter-term EMA rises above a longer-term EMA, it often signals improving momentum and stronger buying pressure. EMA is a trend indicator that emphasizes recent price movements.
However, the latest candles show a long upper wick forming near the 100-period EMA. A wick appears when buyers push the price higher, but sellers quickly force it back down.
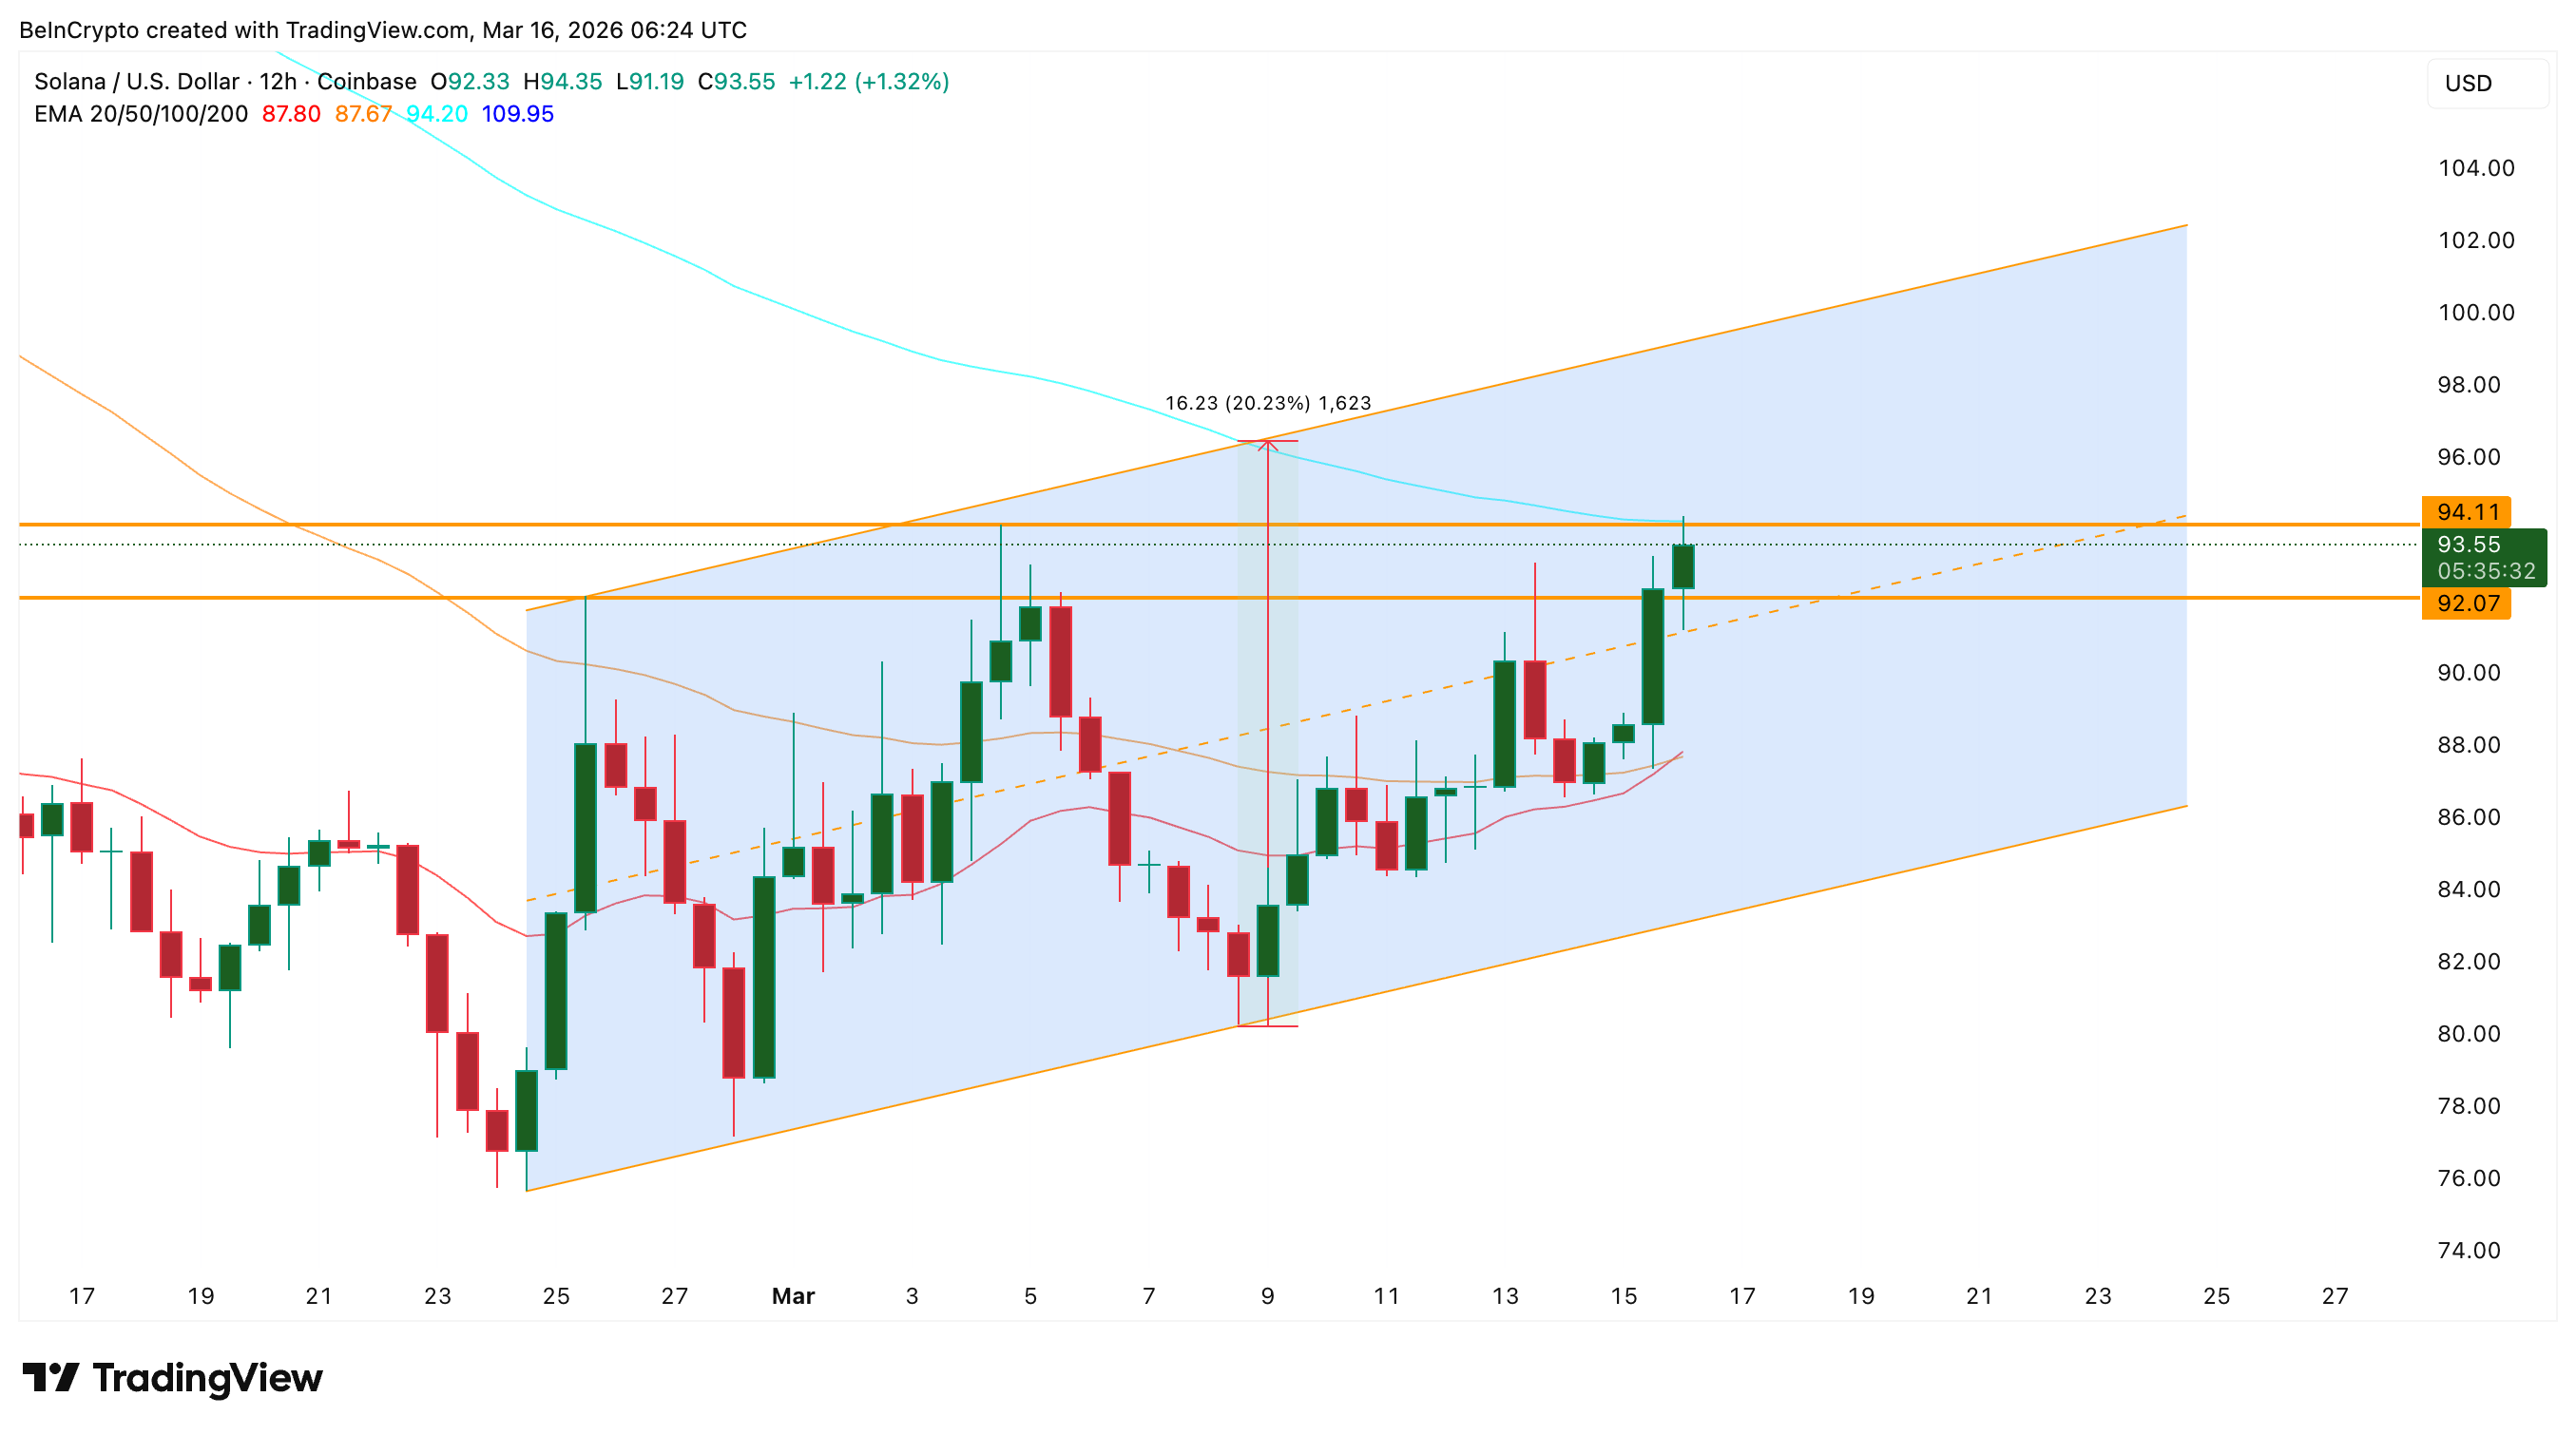 Bullish Price Pattern: TradingView
Want more token insights like this? Sign up for Editor Harsh Notariya’s Daily Crypto Newsletter here.
That behavior can indicate sellers are beginning to defend higher levels, with the 100-EMA being the first level to watch.
When such signals appear near the top of an ascending channel, traders often look deeper into on-chain metrics to determine whether the rally still has strong support.
One of the most important signals to examine is how many investors are already sitting in profit.
Rising Profitability Recreates the Conditions Seen Before February’s Drop
The Percent of Addresses in Profit metric measures how many wallets currently hold Solana at prices lower than the current market value.
When this percentage rises quickly, it means more investors are sitting on unrealized gains. While that can appear bullish, it also increases the probability that traders may begin locking in profits. Currently, more than 26% of Solana addresses are in profit, a level last seen around February 2.
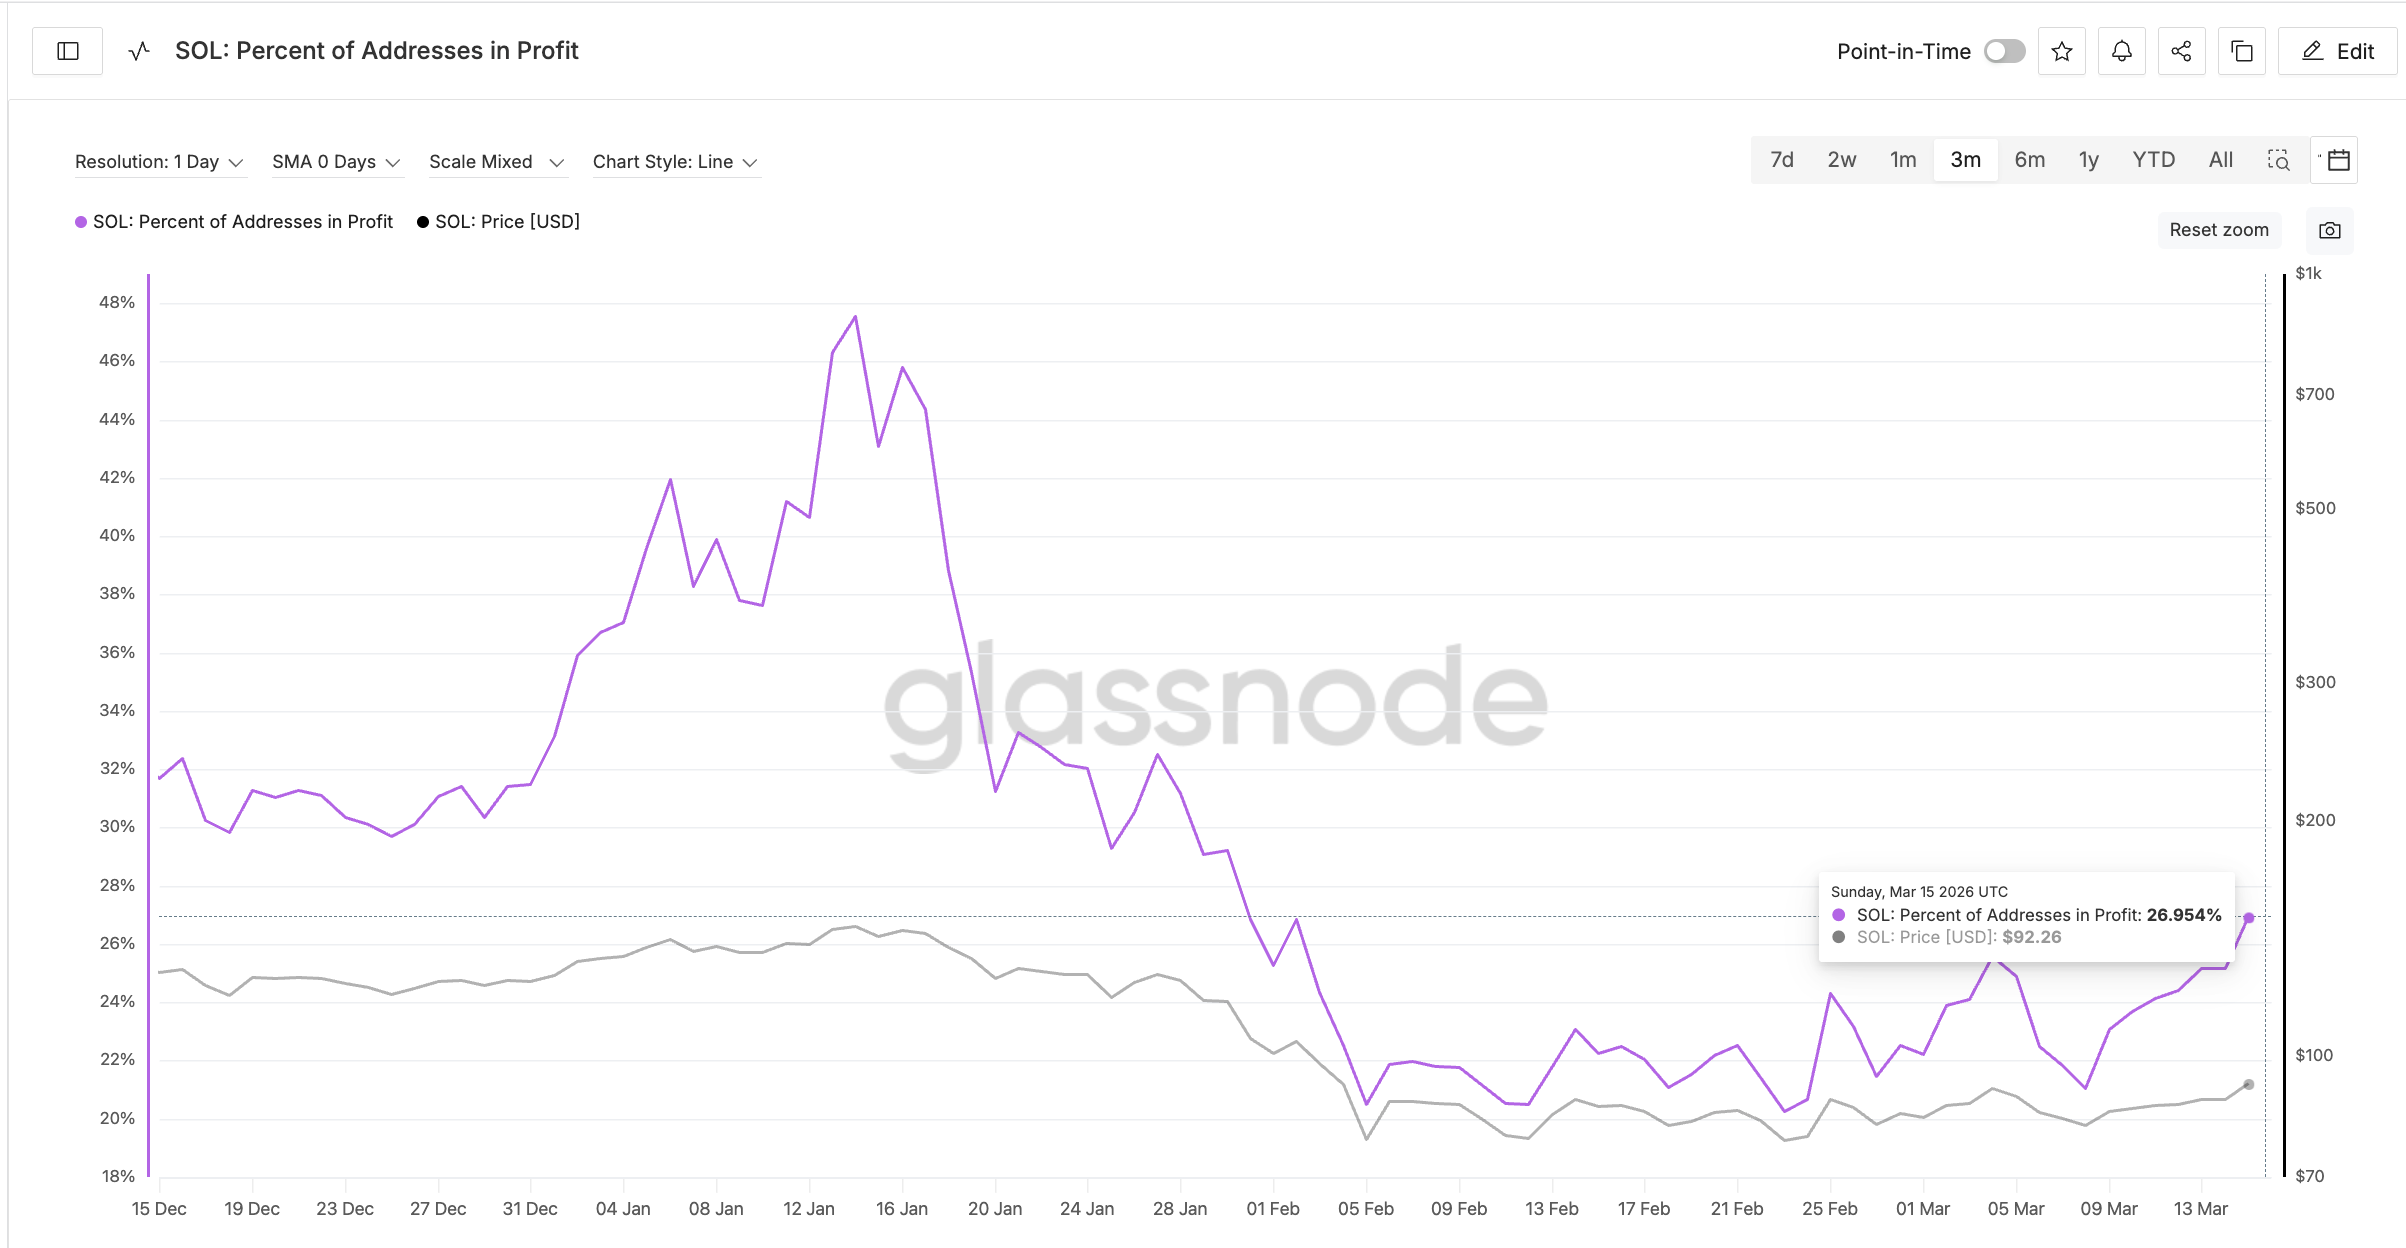 SOL Profitability: Glassnode
At that time, Solana was trading near $104. Within the next three days, the price fell to roughly $78, representing a 25% drop. This makes rising profitability the first bearish cue.
That historical example shows how rising profitability can sometimes trigger a wave of selling pressure. However, selling pressure often depends on how long-term holders behave during these moments.
To understand whether investors still have conviction in the rally, the next step is to examine holder accumulation.
Holder Conviction Has Dropped Nearly 50% Since the Last Profit Spike
The Hodler Net Position Change metric tracks the 30-day rolling change in coins held by long-term investors. Positive values indicate accumulation. Negative values suggest holders are distributing coins.
Around February 2, when profitability reached similar levels, long-term holders were adding roughly 3,042,783 SOL.
Today, that accumulation has fallen to about 1,527,770 SOL. That represents a nearly 50% decline in holder accumulation strength.
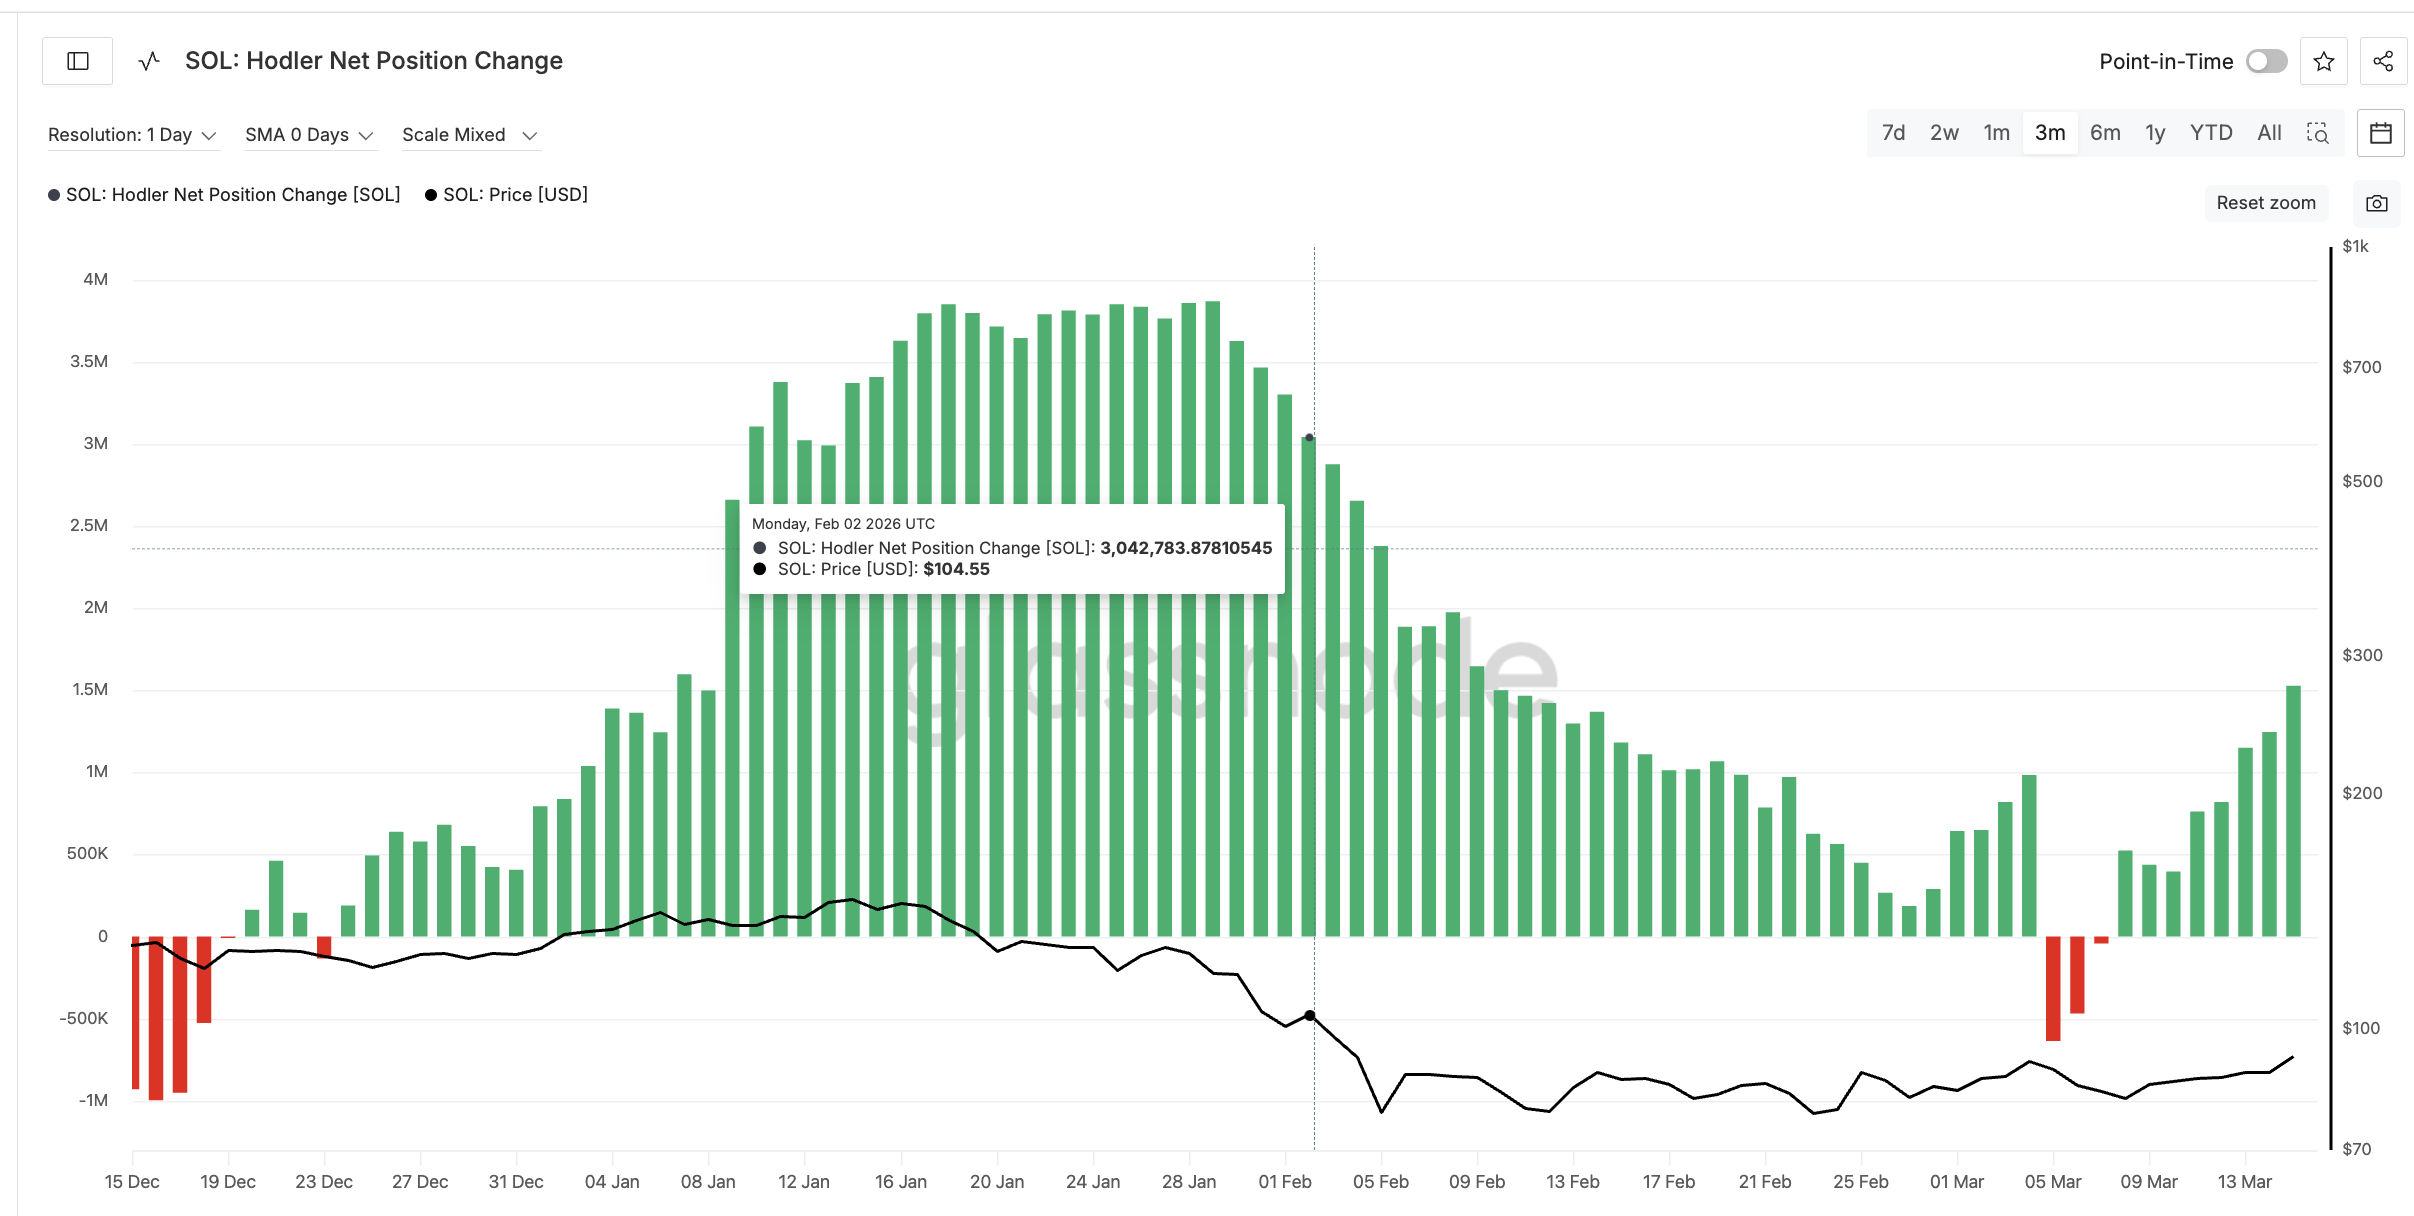 SOL Holders: Glassnode
This difference matters because strong holder buying can often stabilize prices during profit-taking phases. But the current rally is receiving significantly less long-term accumulation support than early February, making it the second bearish cue. This means that if the traders in profit plan to offload again, as they did in early February, there is a weaker holder floor underneath.
When both profitability rises and holder conviction weakens, traders often look to derivatives markets for the final piece of the puzzle. That data currently reveals another potential risk.
A Massive Long Leverage Cluster Could Amplify Any Solana Price Drop
Data from Binance’s SOL/USDT perpetual market shows a significant imbalance between long and short leveraged positions. Currently, roughly $306 million in long leverage sits in the market compared to only $75 million in short leverage.
That creates a leverage imbalance of more than four times toward the long side. Large leverage imbalances can become dangerous if prices start falling, because forced liquidations may accelerate downward moves.
One particularly important level sits near $89, where nearly one-third of the long liquidation clusters are concentrated.
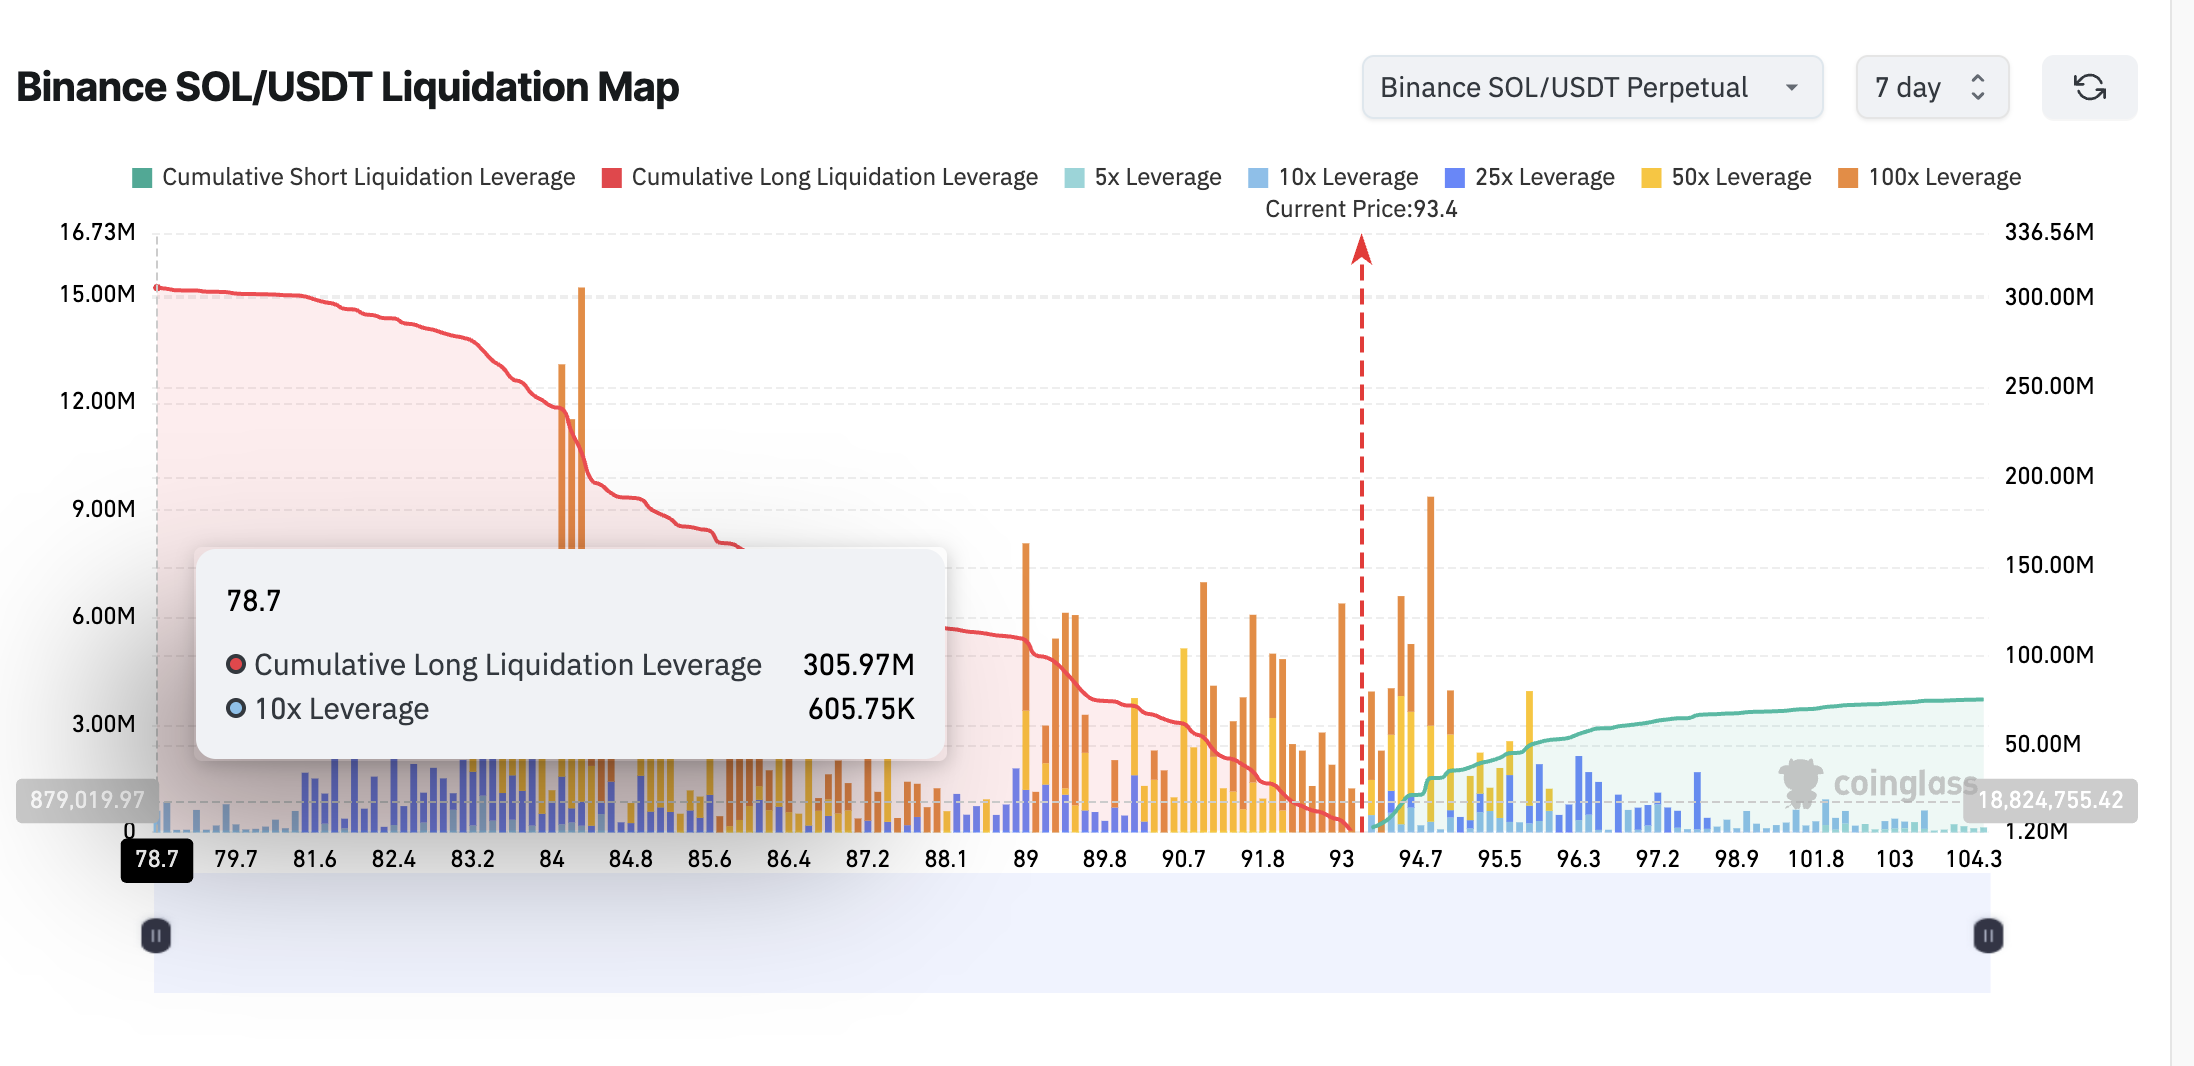 Liquidation Map: Coinglass
If Solana falls below this level, a cascade of liquidations could amplify the decline. Interestingly, this level even appears on the Solana price chart.
At the same time, the bullish channel structure remains intact as long as the price holds key supports. A sustained move above $94 (also the 100-EMA line) could strengthen momentum, while a break above $98 may give Solana enough strength to test higher levels toward $110.
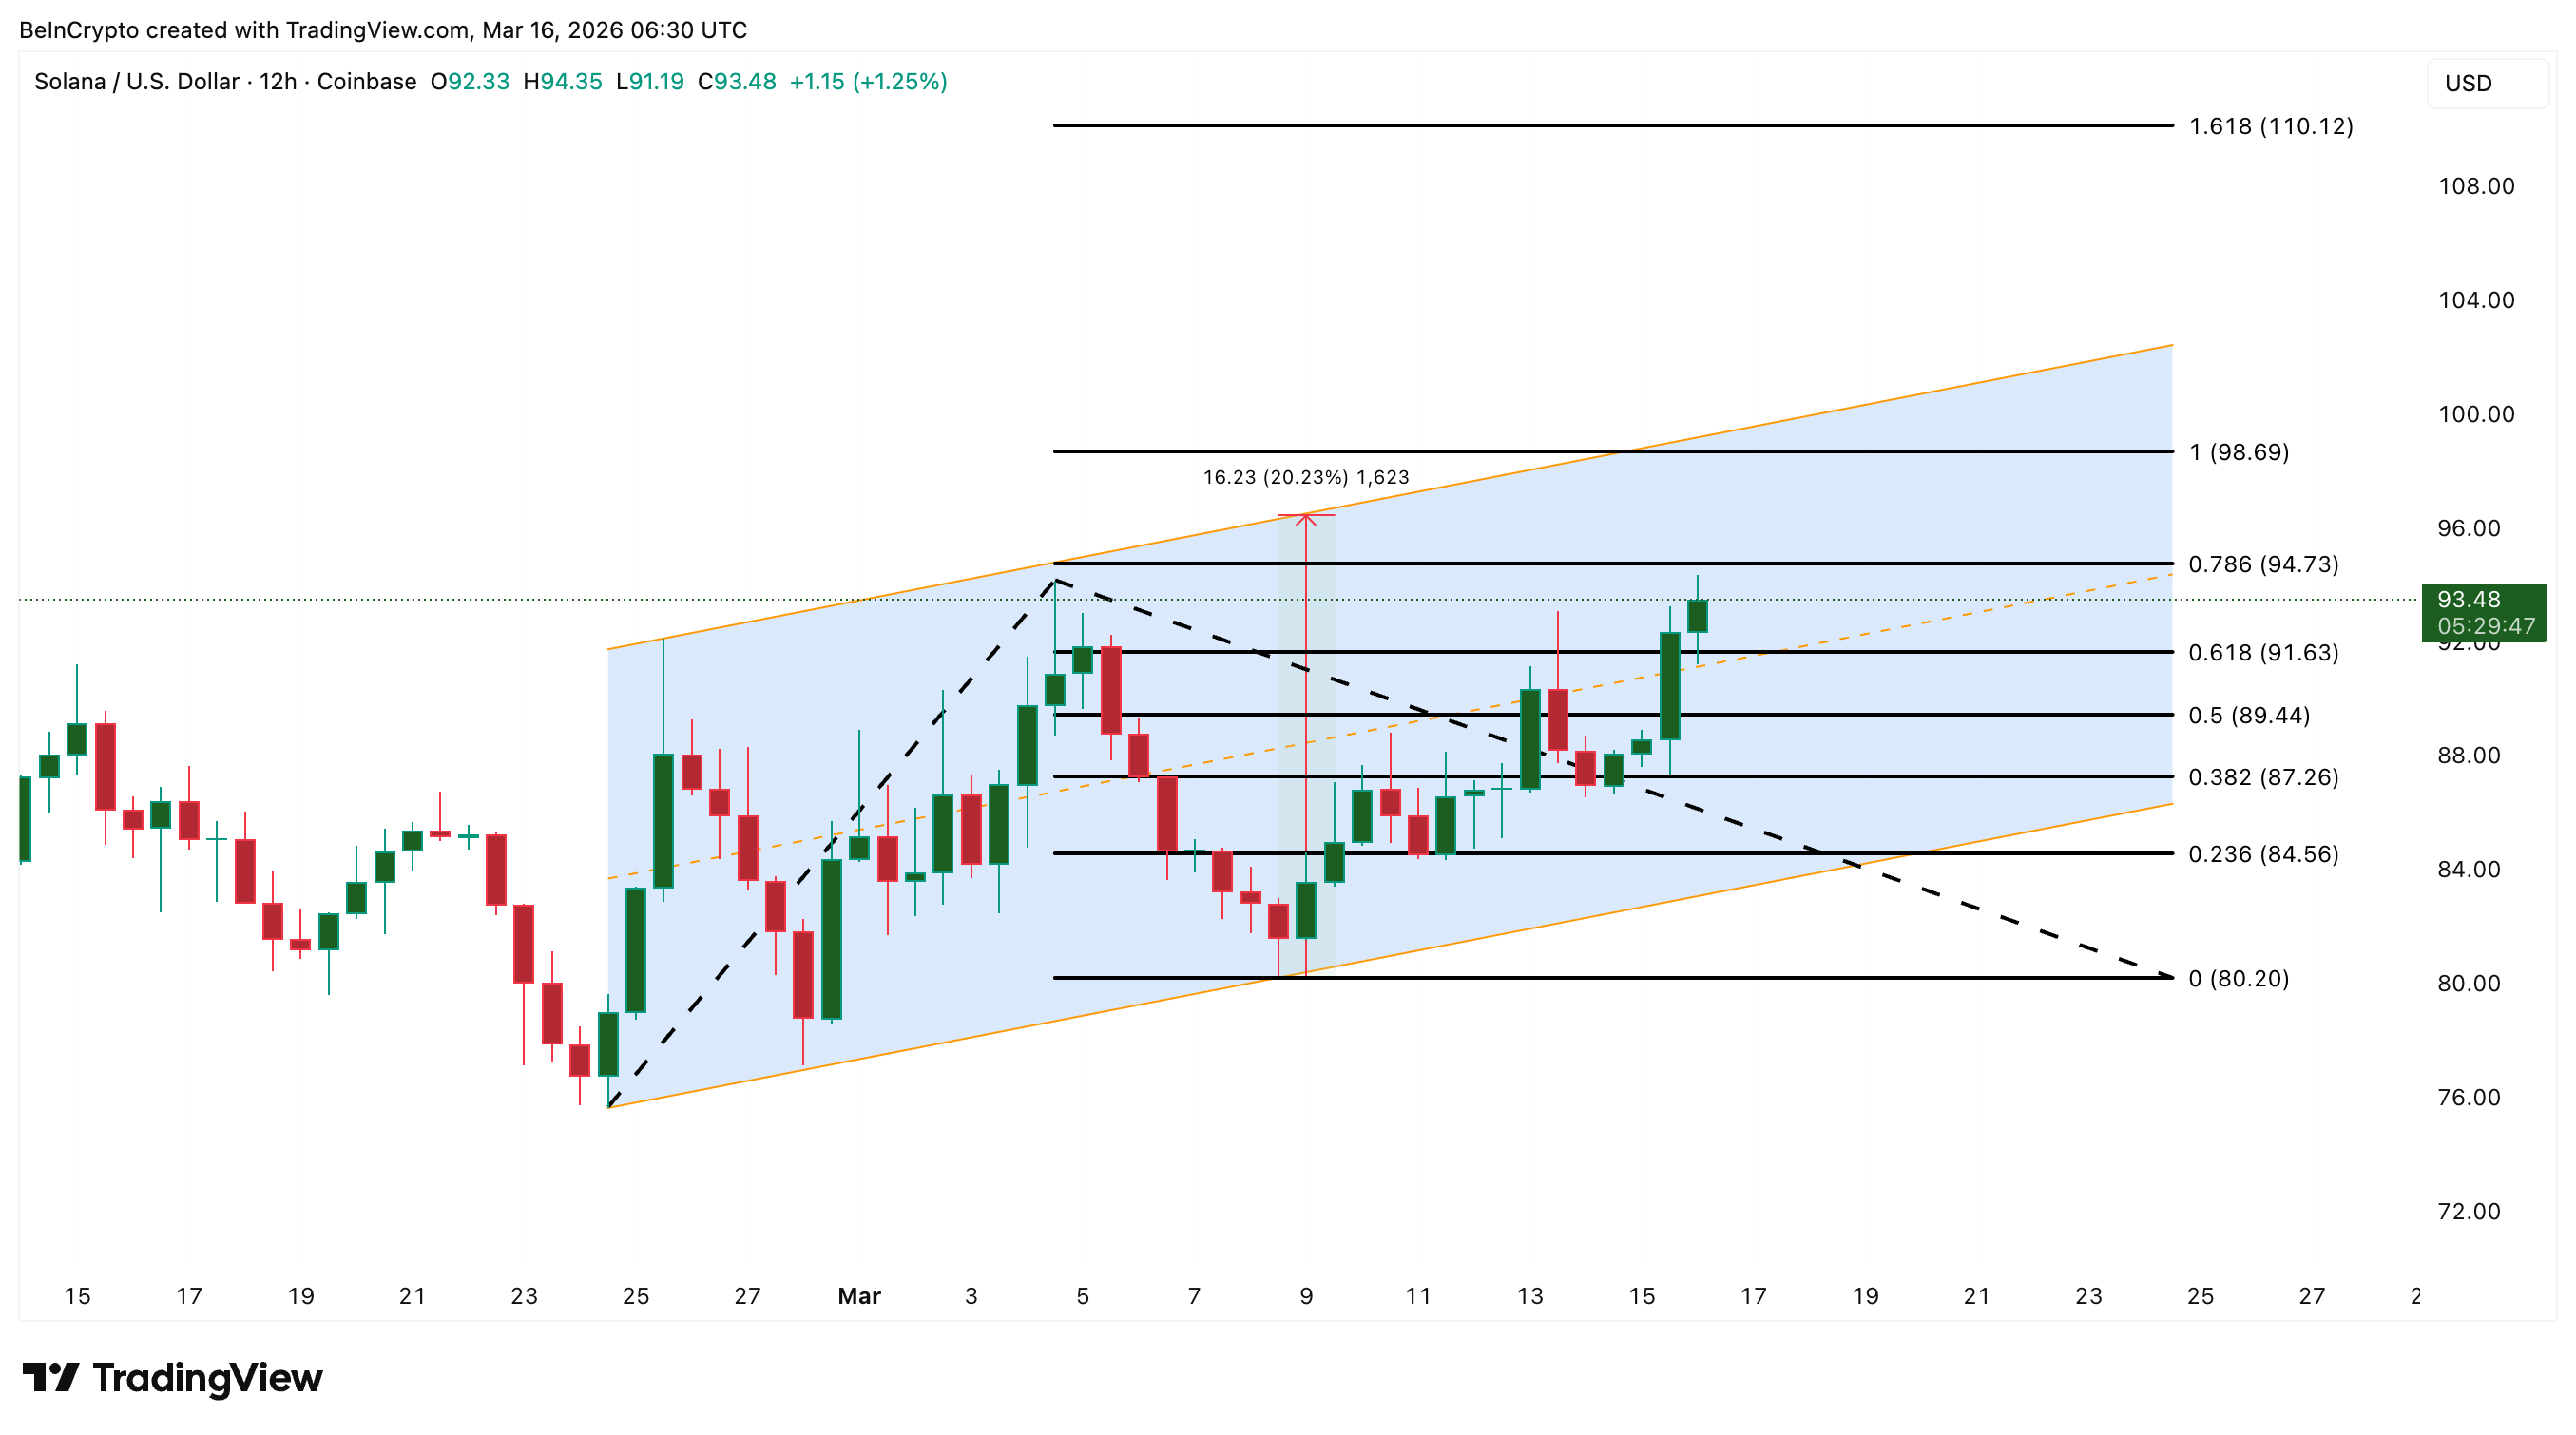 Solana Price Analysis: TradingView
But if selling pressure returns and price breaks below $89, the leverage imbalance could trigger a rapid move toward the $80 region, weakening the bullish channel pattern entirely. That would quickly erase the roughly 10% monthly gains Solana has accumulated.
Recommended Articles


