

Will Solana’s “Megaphone” Pattern Breakout Trigger Price Rally to $100?
Solana has been stuck in a period of sharp uncertainty, with price action momentum shifting indecisively. The altcoin is caught between competing bullish and bearish signals.
This tug-of-war leaves SOL vulnerable to a decisive move in either direction, making the current juncture critical for traders and long-term holders alike.
Solana Holders Can Stabilise Price
Solana onboarded 1.1 million new addresses in 24 hours, a notable milestone. However, the broader new address momentum is declining despite this spike. The monthly average, while still above the yearly average, is trending downward — a development that warrants caution if the slide continues.
Should the monthly average slip below the yearly average, Solana would face deteriorating network fundamentals. Declining new address growth signals weakening ecosystem activity and reduced user adoption. This metric deserves close monitoring, as a sustained drop below the annual benchmark historically precedes broader network slowdowns.
Want more token insights like this? Sign up for Editor Harsh Notariya’s Daily Crypto Newsletter here.
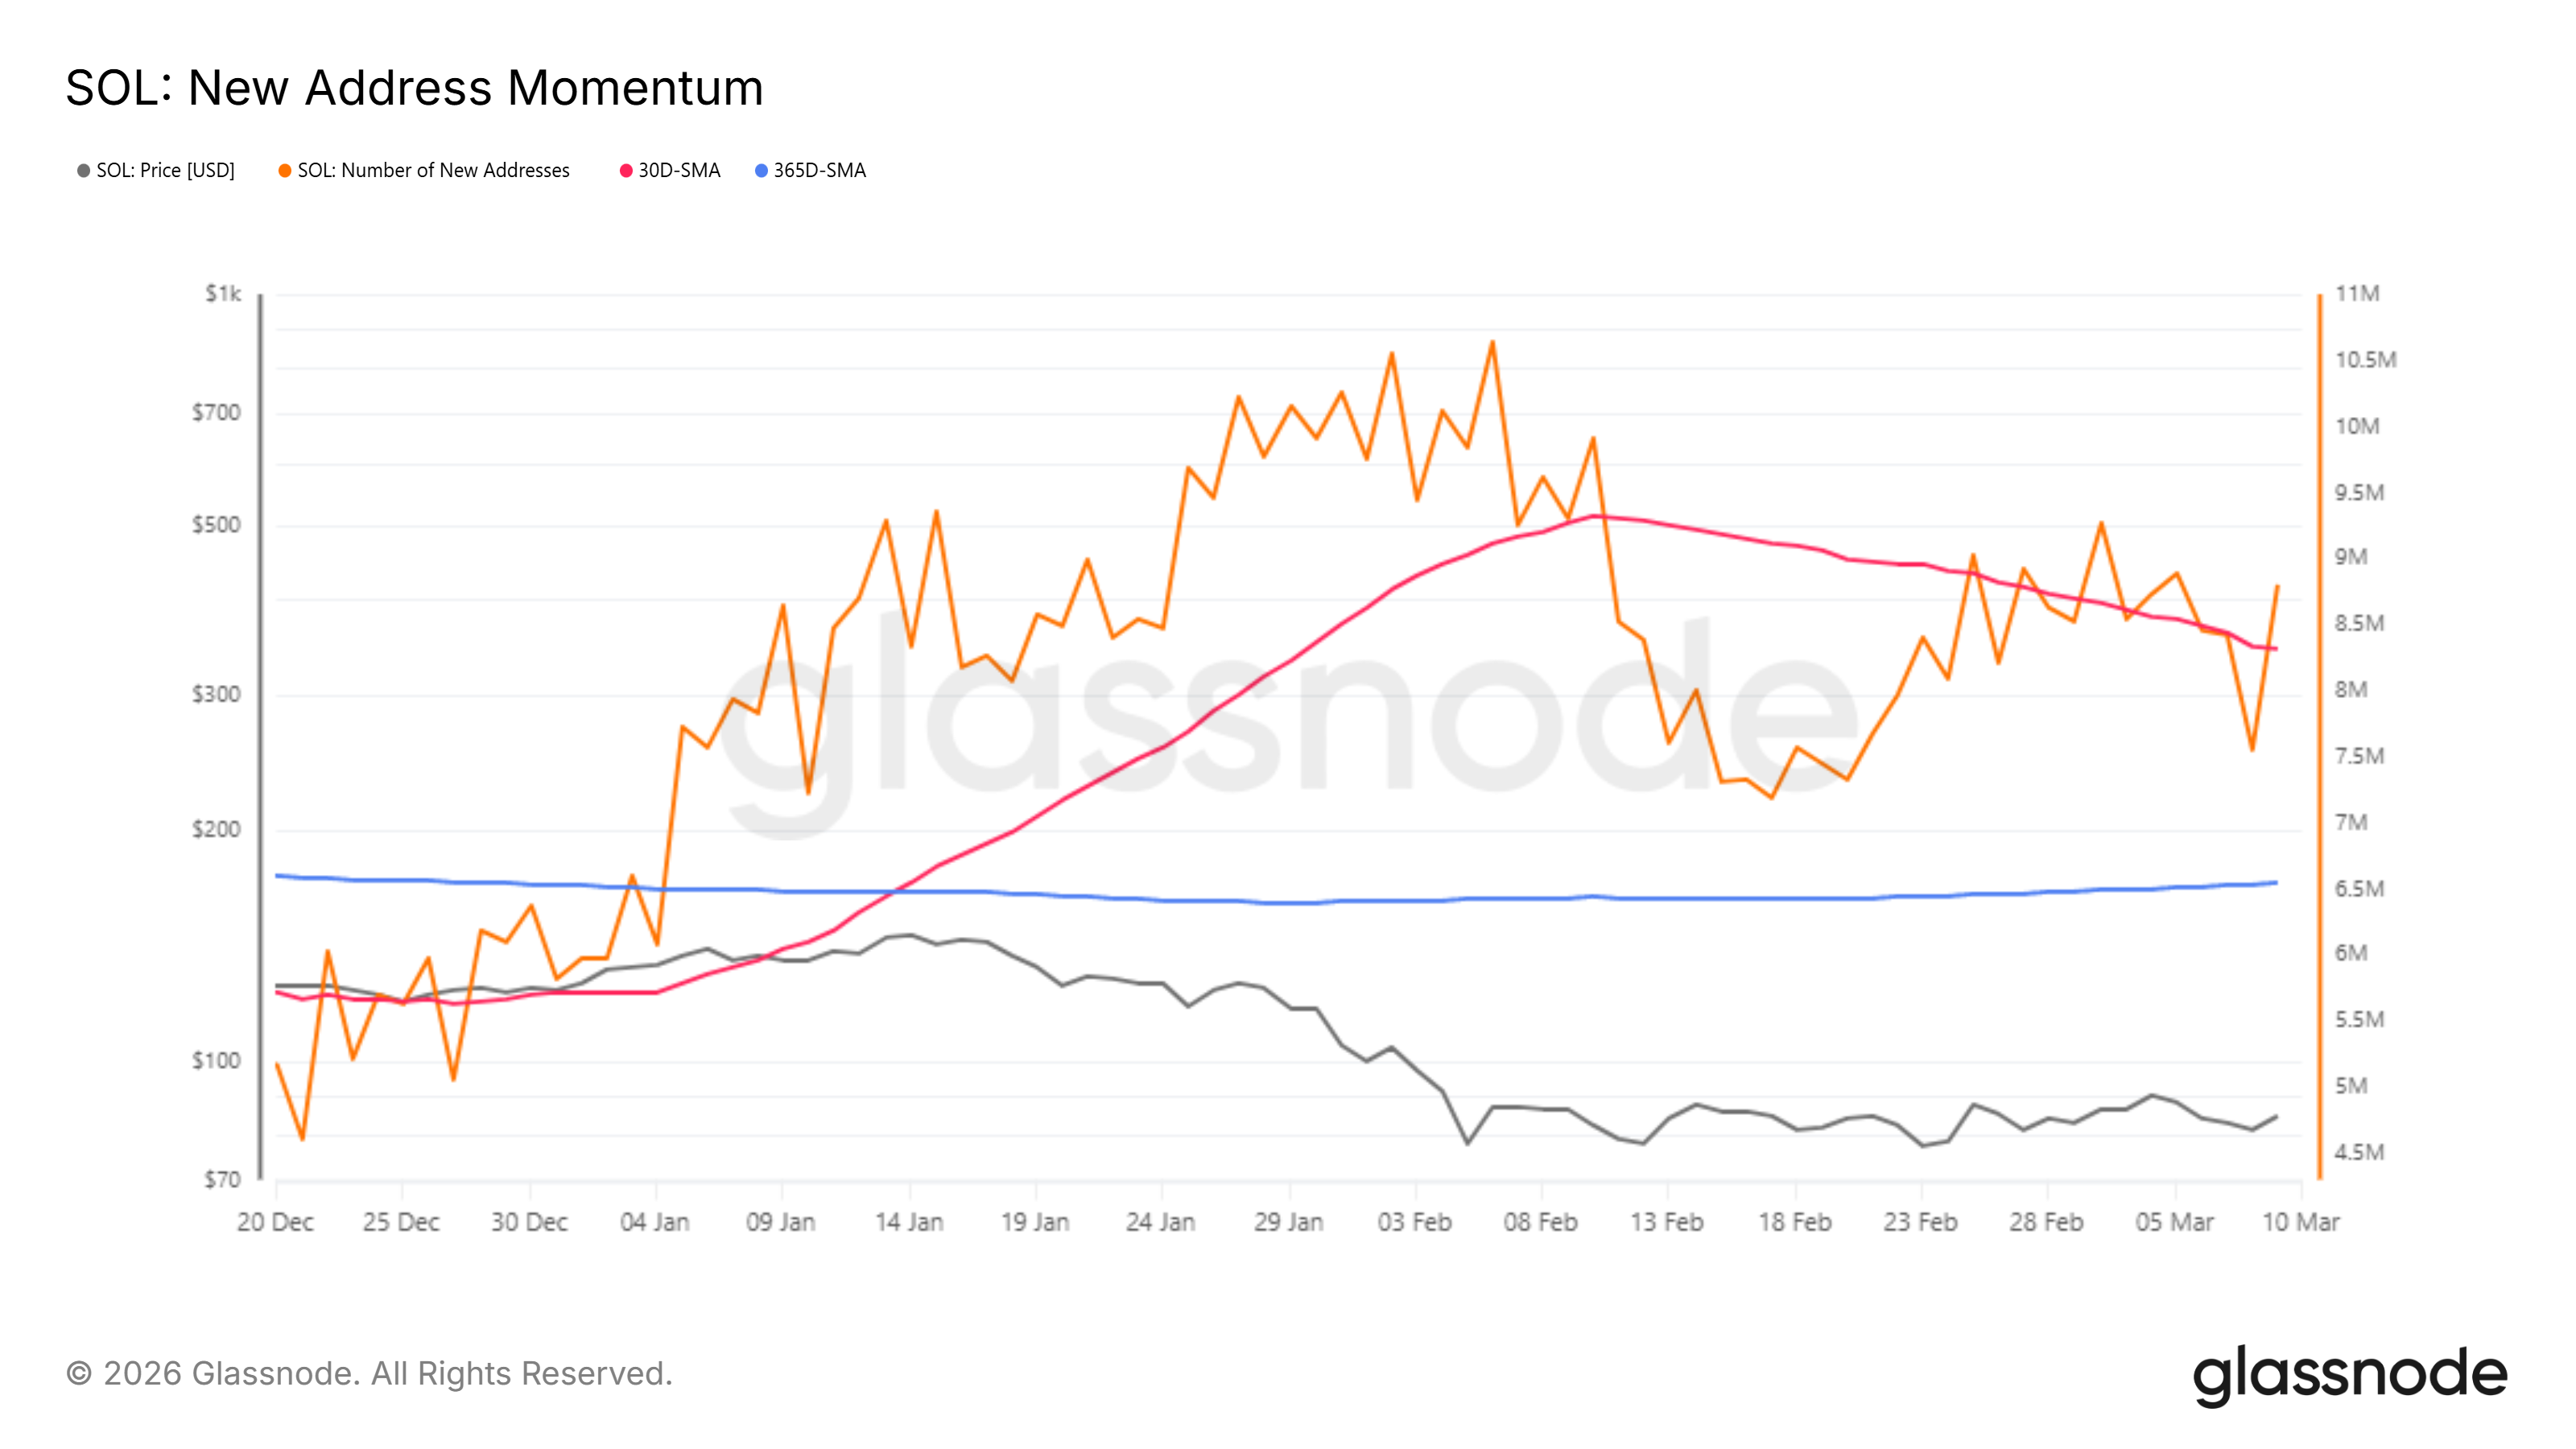 Solana New Addresses Momentum. Source: Glassnode
The CBD Heatmap reveals that investors have been actively buying at fluctuating low prices, creating overlapping supply and demand zones. This buying behavior, while reflecting confidence, has simultaneously trapped the SOL price within a tight consolidation range. Breaking out convincingly remains technically challenging under these conditions.
The coexistence of a supply zone and a demand zone is suppressing directional momentum. If current holders resist selling pressure, SOL could finally establish a clear trend. Seller conviction will ultimately determine whether the consolidation resolves bullishly or breaks down toward lower support levels.
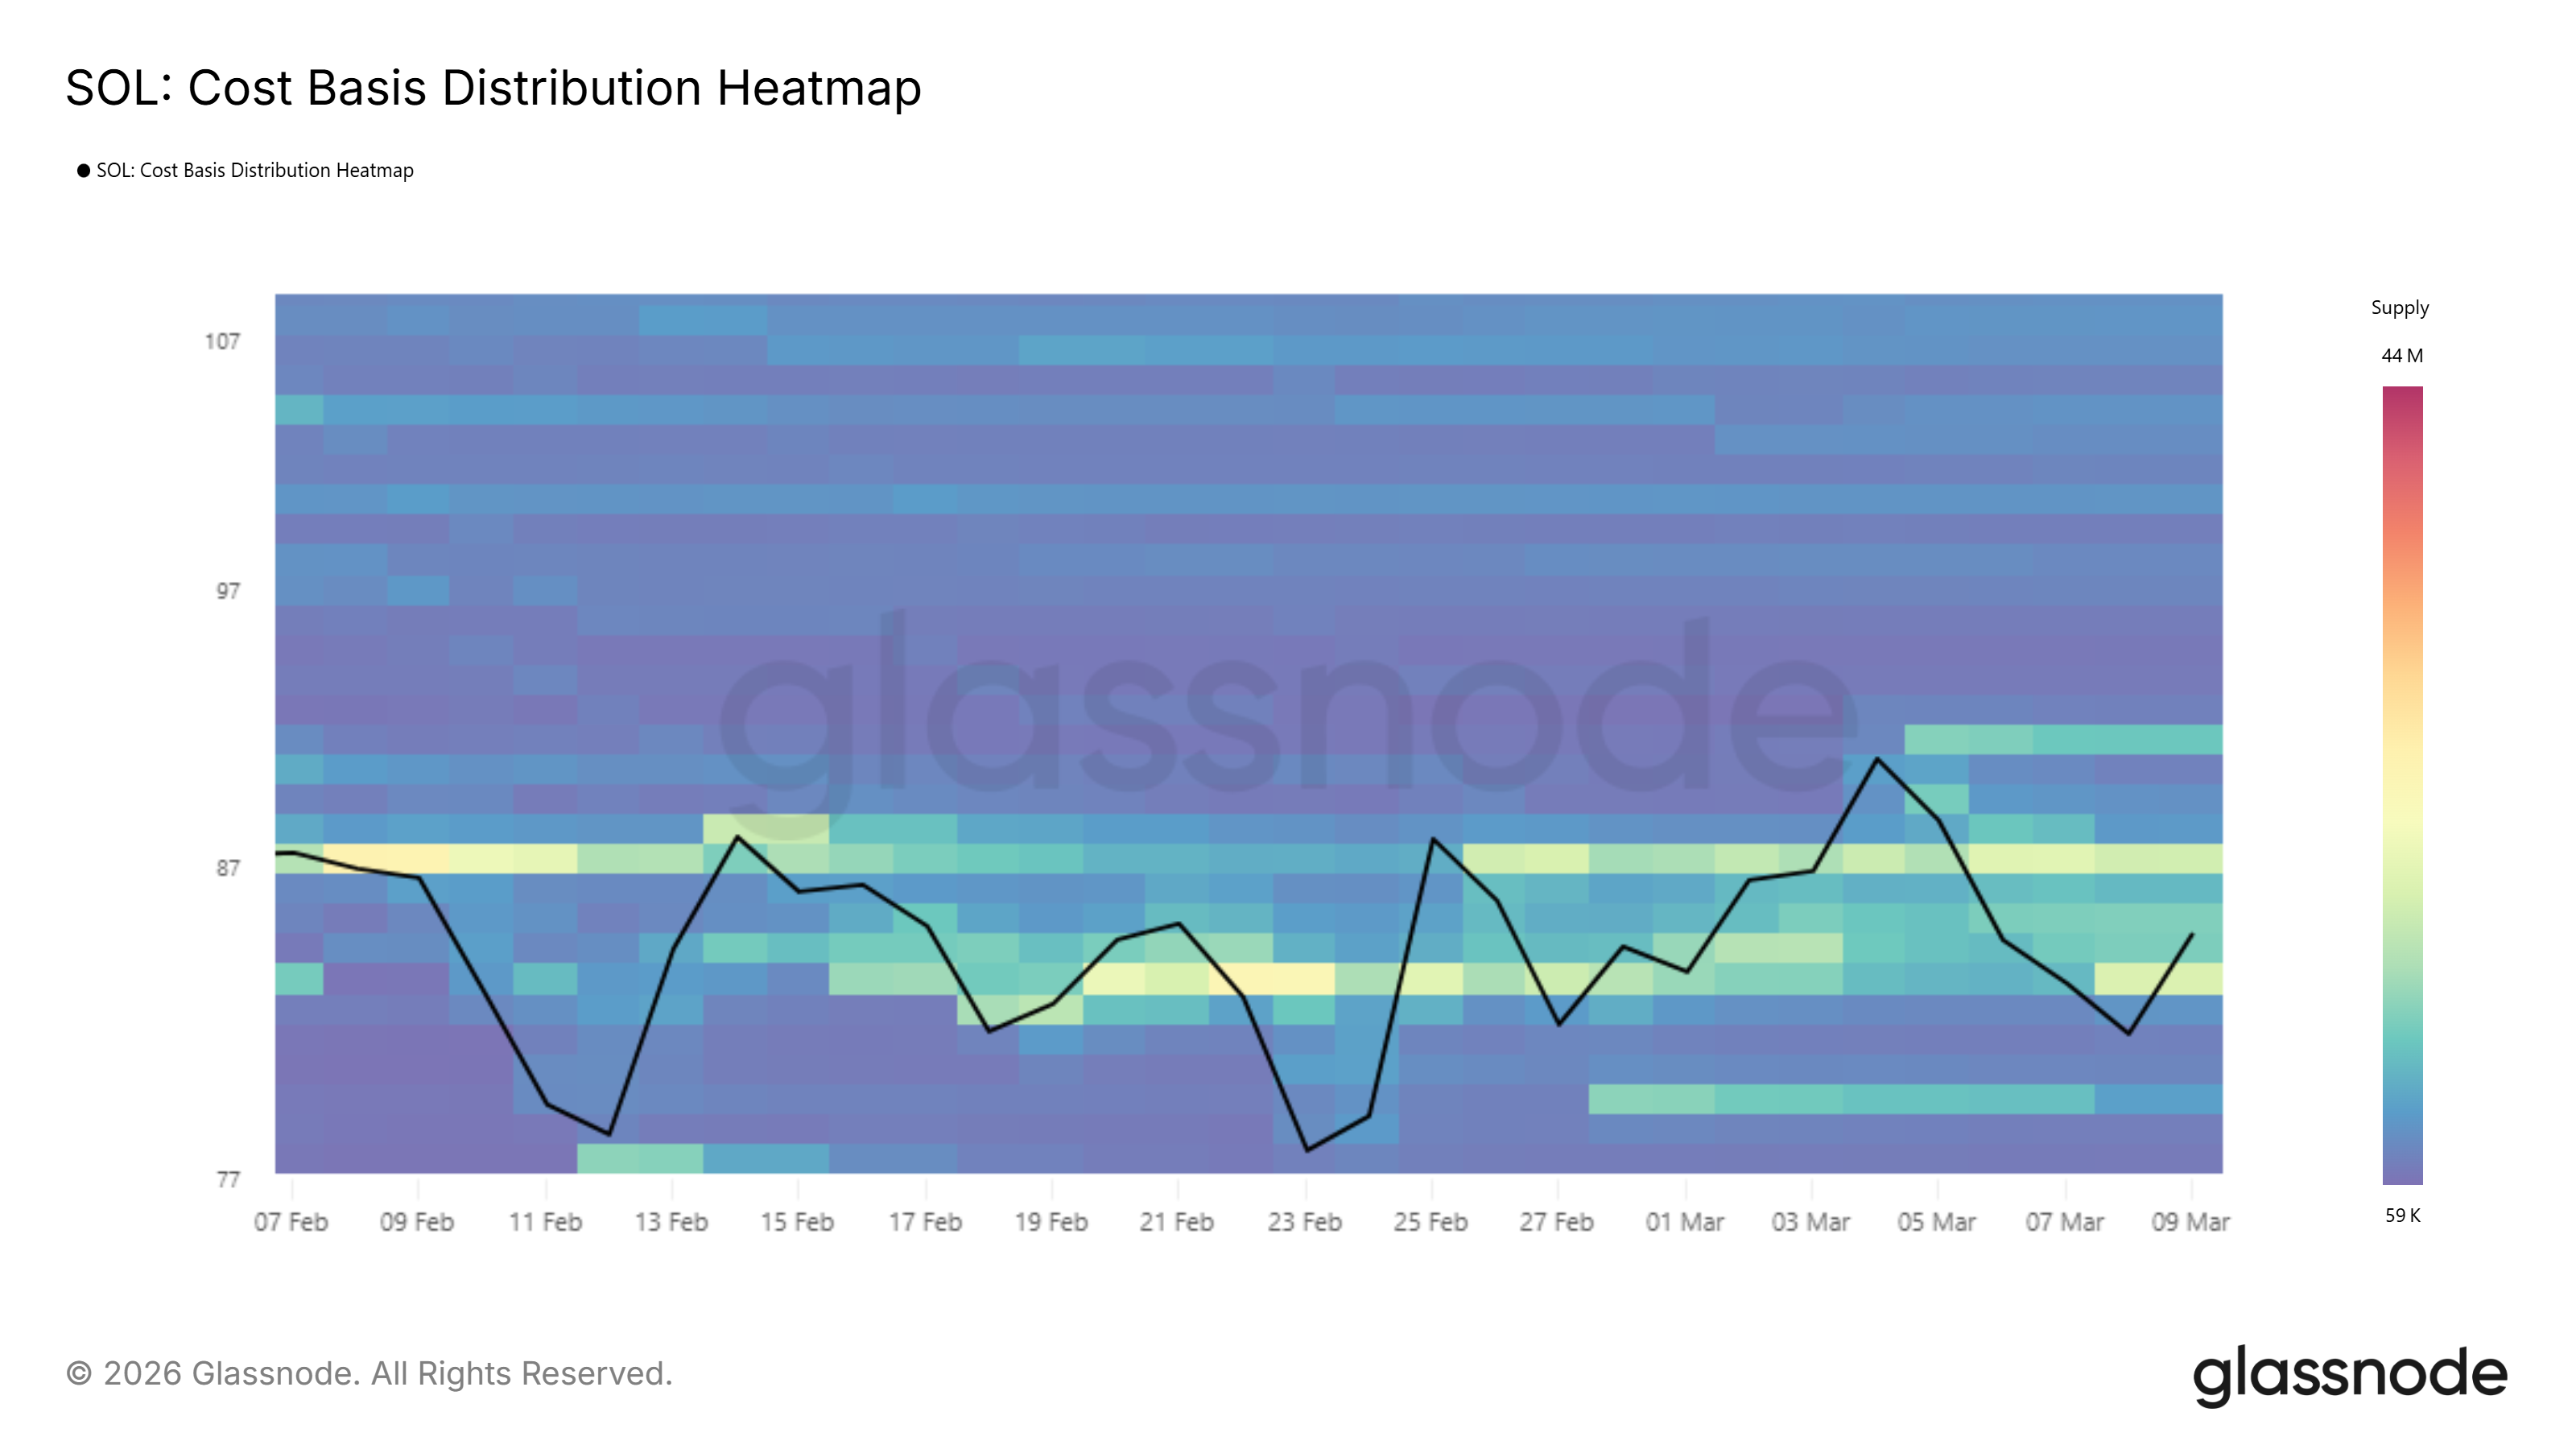 Solana CBD Heatmap. Source: Glassnode
SOL Price May See Erratic Movements
Solana is forming a broadening top, or Megaphone pattern, characterized by higher highs and lower lows. This neutral formation offers no directional bias on its own. Price could swing sharply in either direction once the pattern resolves, making confirmation from supporting indicators essential before committing to a directional trade.
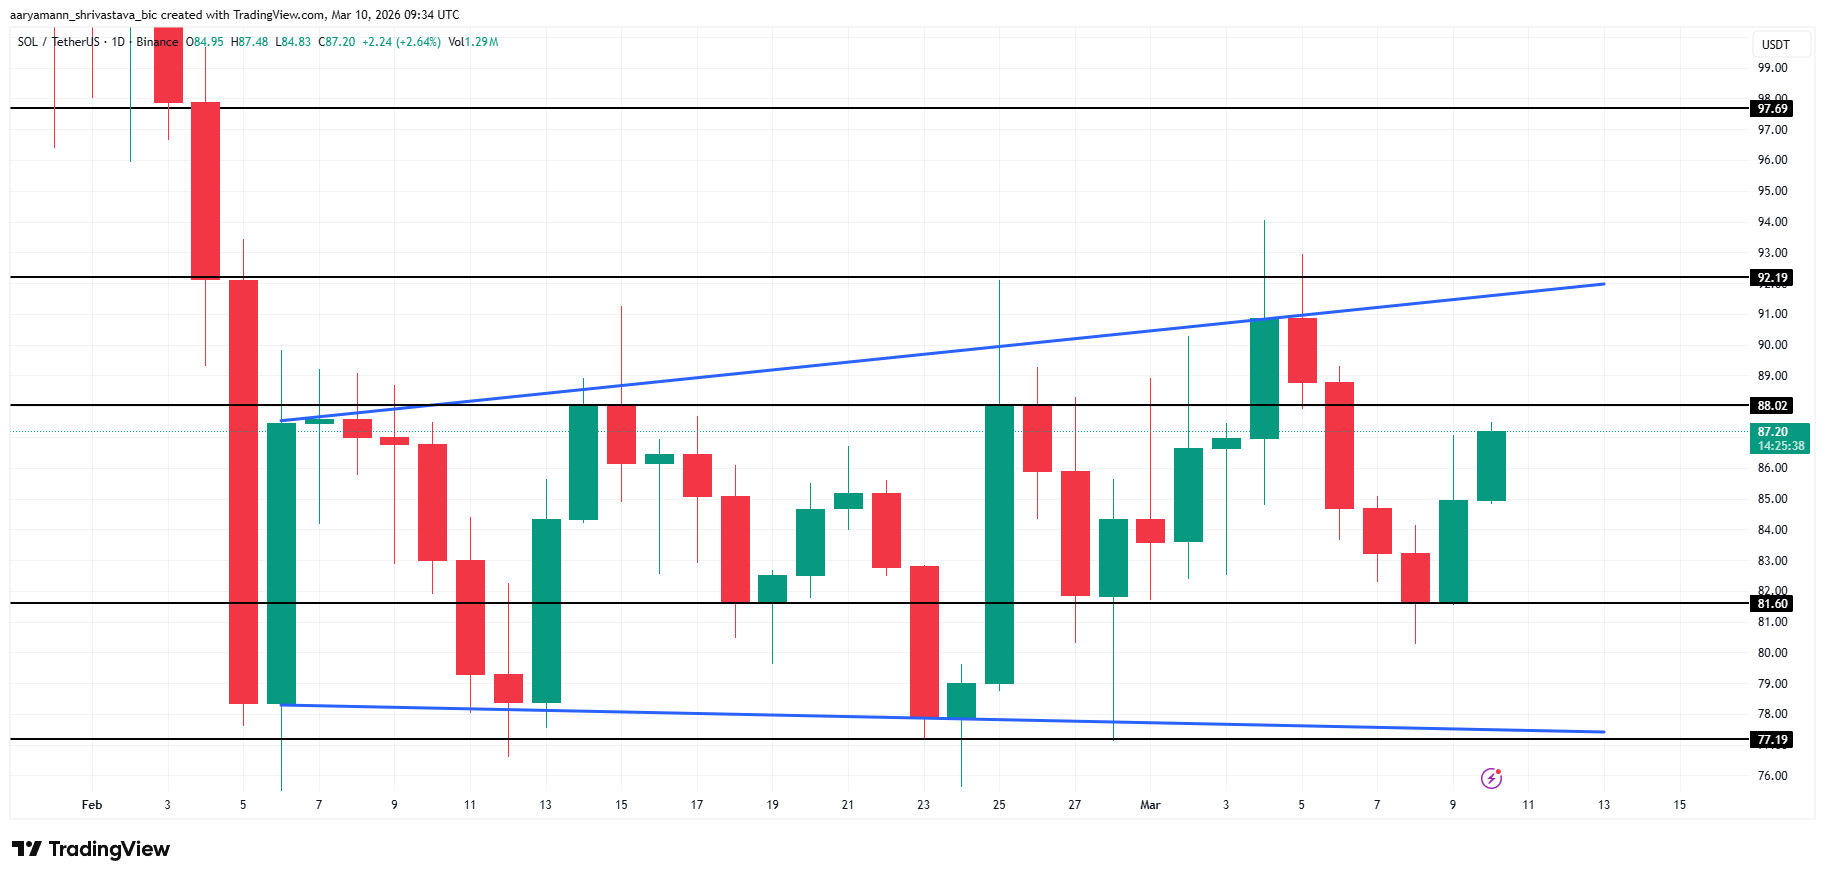 Solana Price Analysis. Source: TradingView
The Chaikin Money Flow indicator remains above zero, confirming active capital inflows into Solana. This bullish signal could push SOL higher from its current $87 level toward $92. A confirmed close above $92 would trigger a broader breakout, opening the path toward the $97 target.
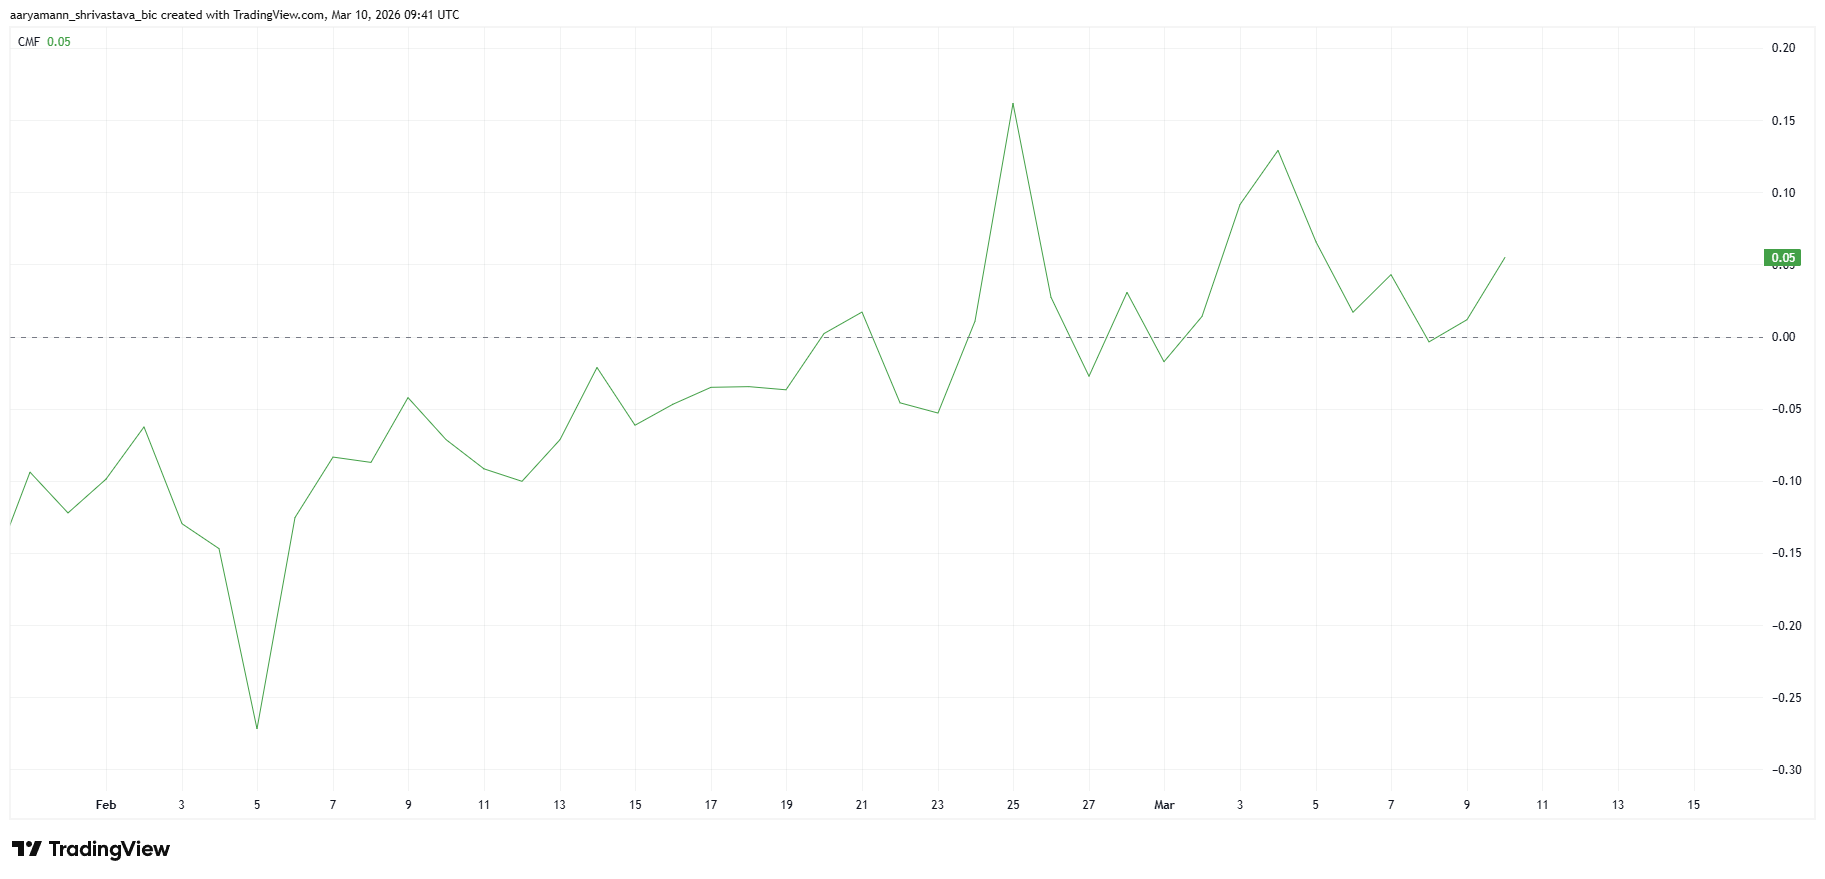 Solana CMF. Source: TradingView
Sustained selling pressure, however, could undermine the bullish setup. Profit-taking or loss-offsetting by holders may drag SOL below the $81 support level, exposing it to further downside at $77. Breaching that floor would invalidate the current bullish thesis and signal a bearish trend resumption.
Recommended Articles


