

Top 3 meme coins Dogecoin, Shiba Inu and Bonk: Recovery likely if Bitcoin freefall ends
- Dogecoin is likely poised to recover after sweeping liquidity at $0.1201.
- Shiba Inu could observe a 17% decline before recovery in the meme coin.
- Bonk holders gear up for nearly 28% gains in uptrend.
Meme coins Dogecoin (DOGE), Shiba Inu (SHIB) and Bonk (BONK) look primed for recovery, according to technical indicators, despite the broader crypto market correction prompted by the sharp drop in Bitcoin (BTC) price.
BTC price has plunged around 11% since April 30. If Bitcoin’s decline grinds to a halt, assets in other crypto sectors including meme coins – which are considered more speculative than most digital assets – could reverse their recent downtrend.
Dogecoin poised for recovery
Dogecoin is currently in a downtrend, forming lower lows and lower highs since March 28 top of $0.2288. The meme coin’s daily chart shows a fair value gap (FVG) extending between $0.13959 and $0.13395. DOGE price could tackle this imbalance and fill the gap before correcting further.
The Relative Strength Index (RSI), a momentum oscillator, is at its lowest since October at 33.04. DOGE’s RSI is likely headed to the oversold zone below 30, and an attempt to recover from the drop into this area could generate a buy signal for Dogecoin.
Sidelined traders could enter a trade in the Shiba-Inu-themed meme coin below the FVG and close to the May 1 low of $0.1201, the February 29 low of $0.1113 and the February 28 low of $0.0947.
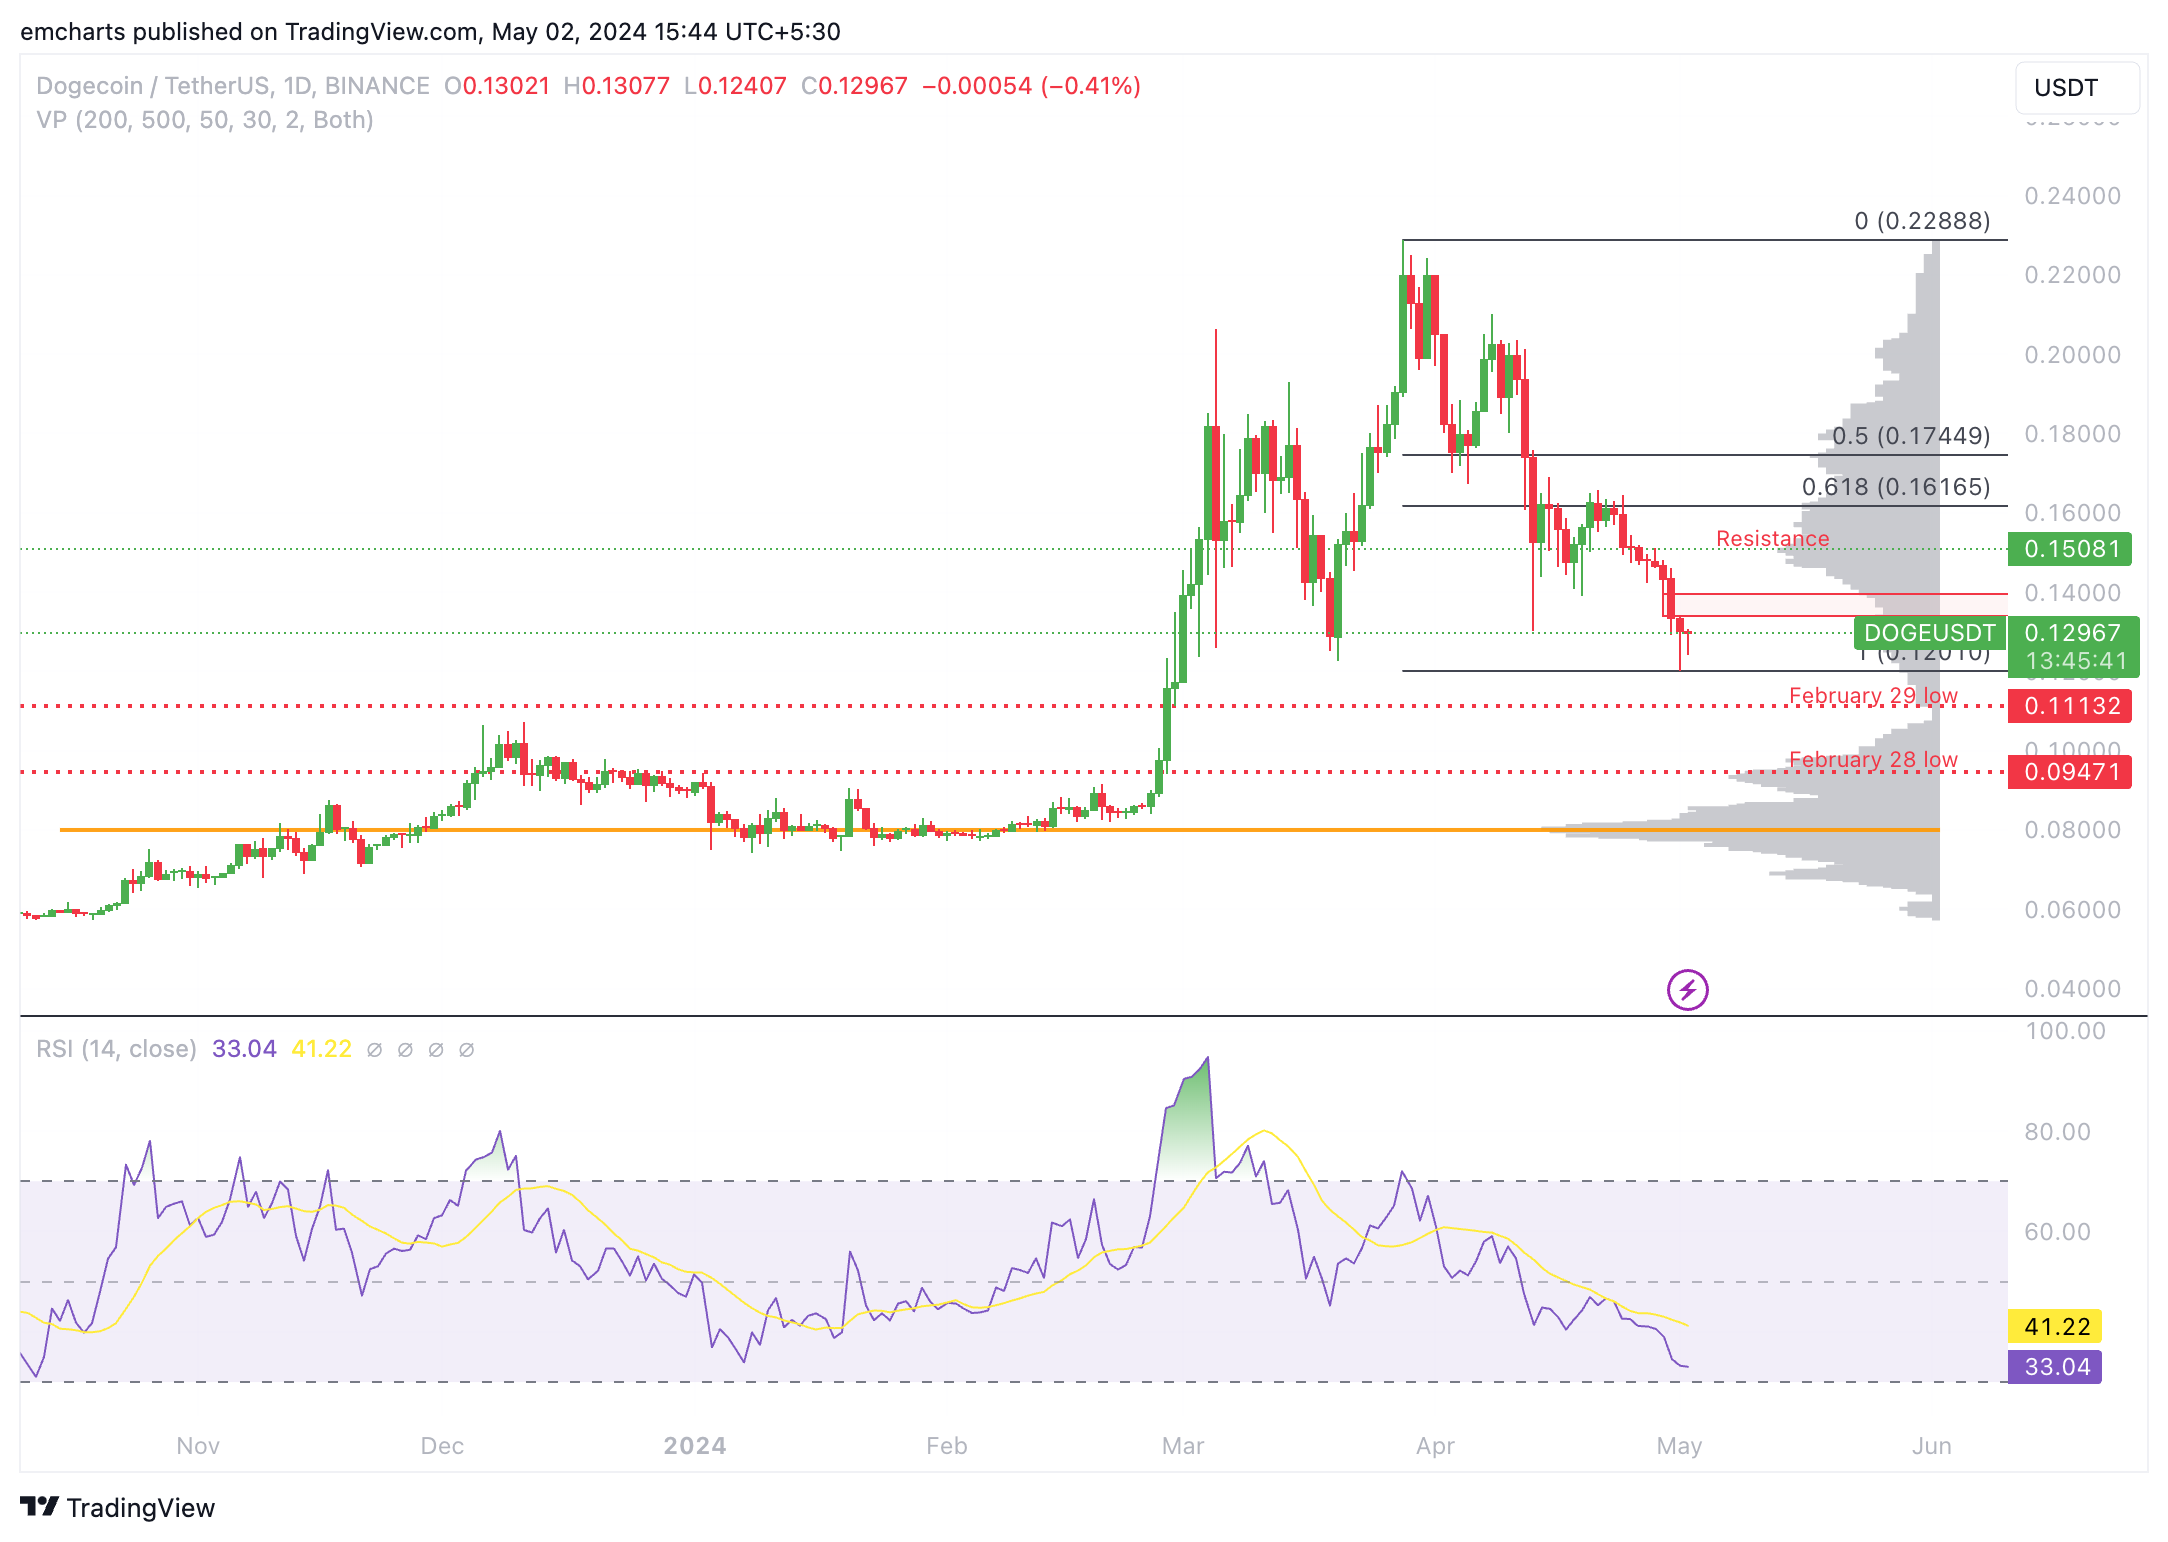
DOGE/USDT 1-day chart
DOGE could find support at the February 28 and 29 lows of $0.0947 and $0.1113, respectively, in the event of a decline.
Shiba Inu could sweep $0.000018 lows before recovery
Shiba Inu is currently exchanging hands at $0.00002210, closer to the midpoint of the Donchian Channel. This volatility indicator helps analysts identify trends in an asset, and also determine optimal points for entry and exit.
There are two entry points for Shiba Inu traders at $0.00002210 and $0.00002057, the first and second entry, with a target of the upper boundary of the channel, or the 20-day high in SHIB price, at $0.00002820.
SHIB price is poised for a nearly 17% decline if it sweeps liquidity at the lower boundary of the channel. The meme coin could offer 27% gains to traders who enter at $0.00002210, with a target of $0.00002820.
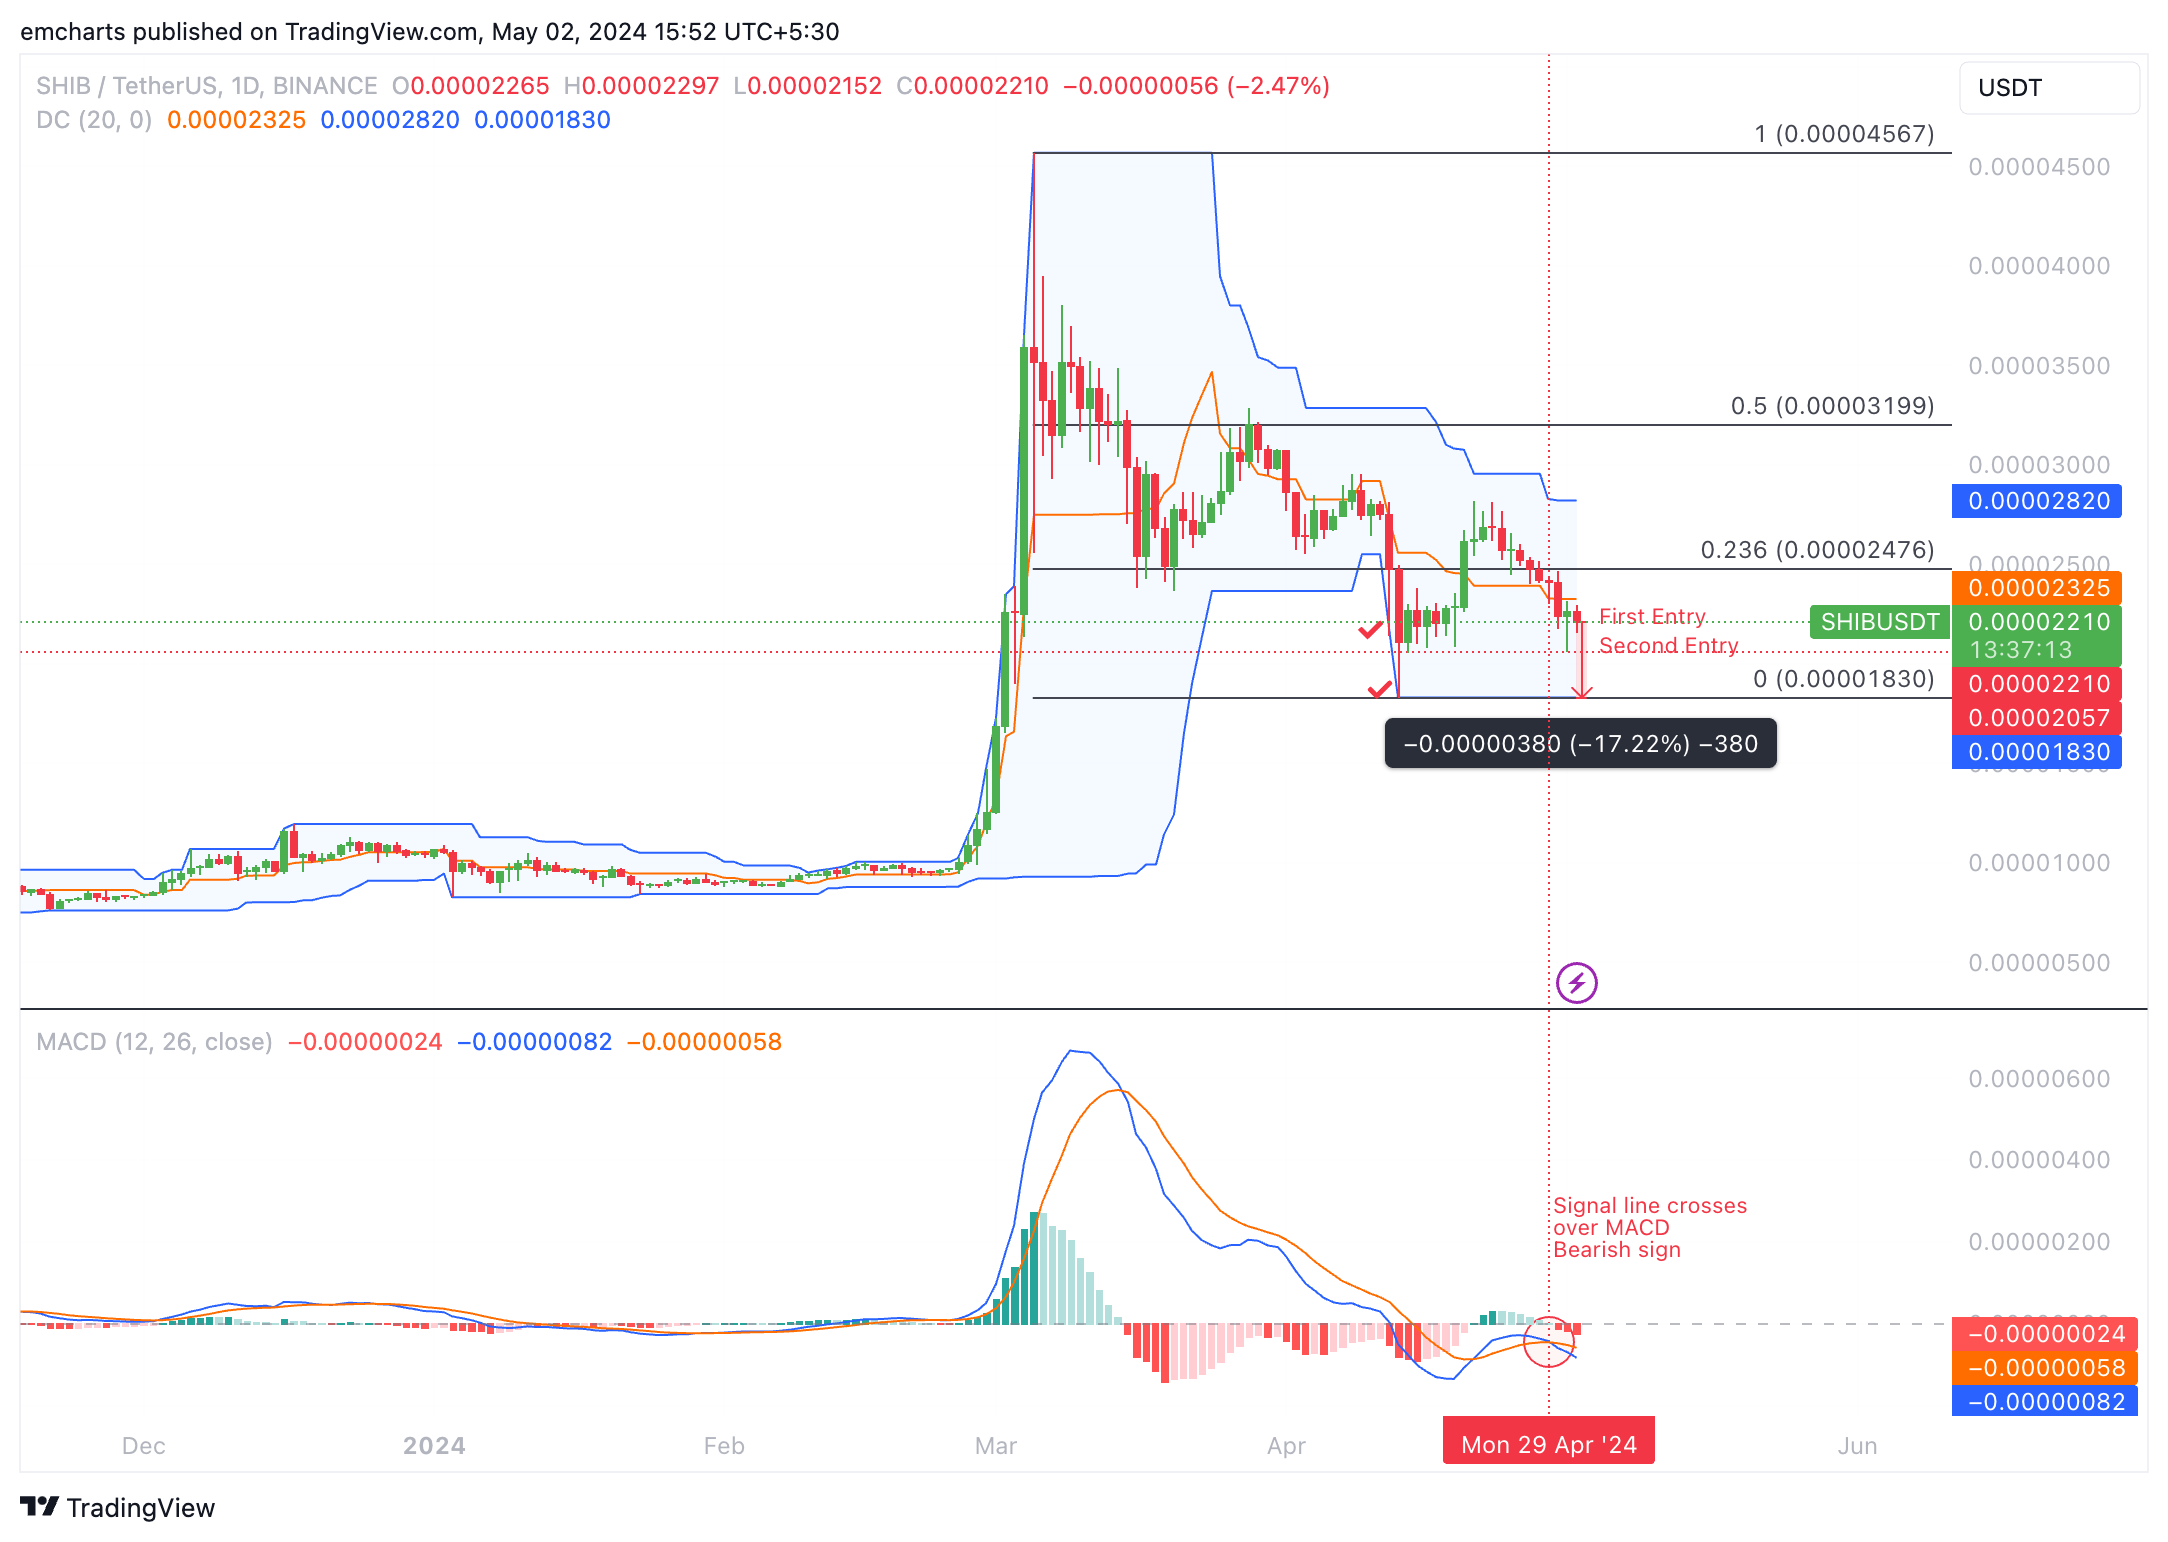
SHIB/USDT 1-day chart
If Shiba Inu sees a daily candlestick close above $0.00002476 (the 23.6% Fibonacci retracement of the decline between March 5 and April 13), it could invalidate the bearish thesis. Immediate support for SHIB is the second entry level at $0.00002057.
Bonk holders gear for 28% gains in uptrend
Bonk broke out from its downward trend on April 20. Since then, the meme coin has formed higher highs and higher lows. The speculative asset looks poised for nearly 28% gains as it continues climbing higher.
BONK price is $0.00002300 at the time of writing. The Moving Average Convergence Divergence indicator saw a crossover of the MACD line above the signal line, a bullish sign for BONK. The on-balance volume indicator is climbing alongside the increase in BONK price, signaling increasing buying pressure.
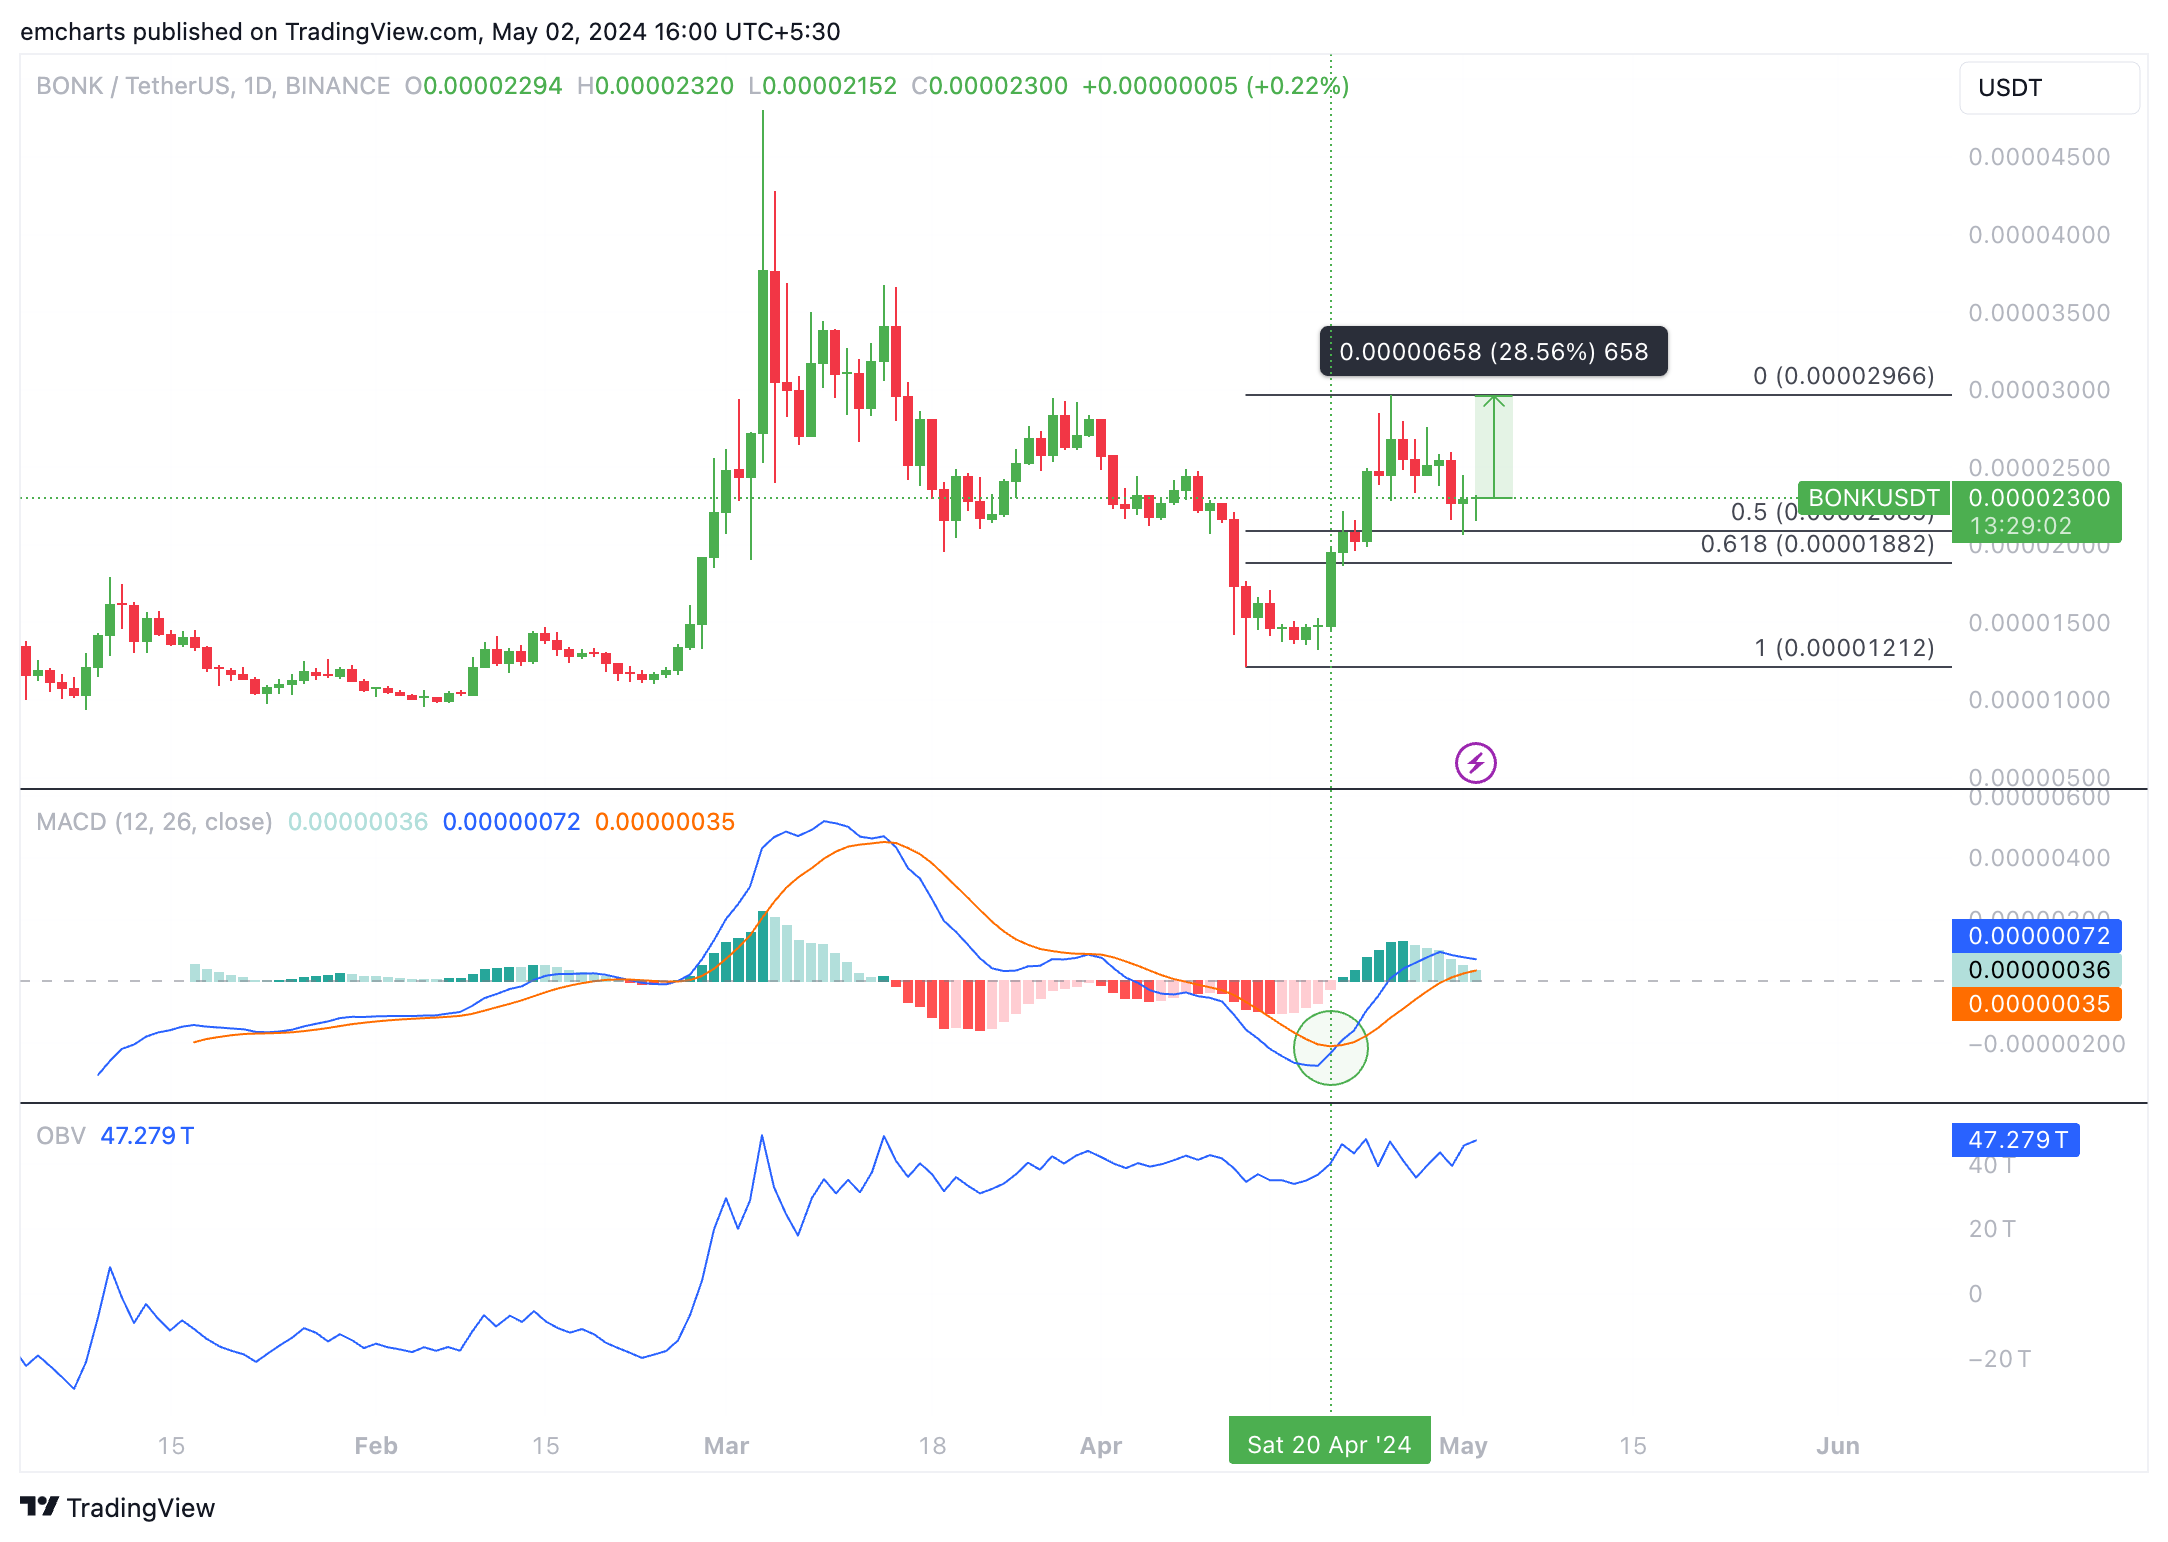
BONK/USDT 1-day chart
A daily candlestick close below $0.00002089 could invalidate the bullish thesis. BONK price could find support at $0.00001882, the 61.8% Fibonacci retracement of its climb from April 13 to April 25 top of $0.00002966.
Recommended Articles


