

Ethereum Price Attempts 3 Rebounds in 10 Days — Charts Explain Why Each Failed
Ethereum price is up about 1% over the past 24 hours, holding near the $2,000 level. But this is not the first time Ethereum has tried to recover. Over the past 10 days (between February 6 and February 15), ETH attempted three separate rebounds. Each one showed early strength but failed to continue higher.
Now, charts explain why each failed. The data also shows what must change for Ethereum price prediction to finally turn bullish.
Ascending Triangle Shows Recovery Attempt — But Resistance Lingers
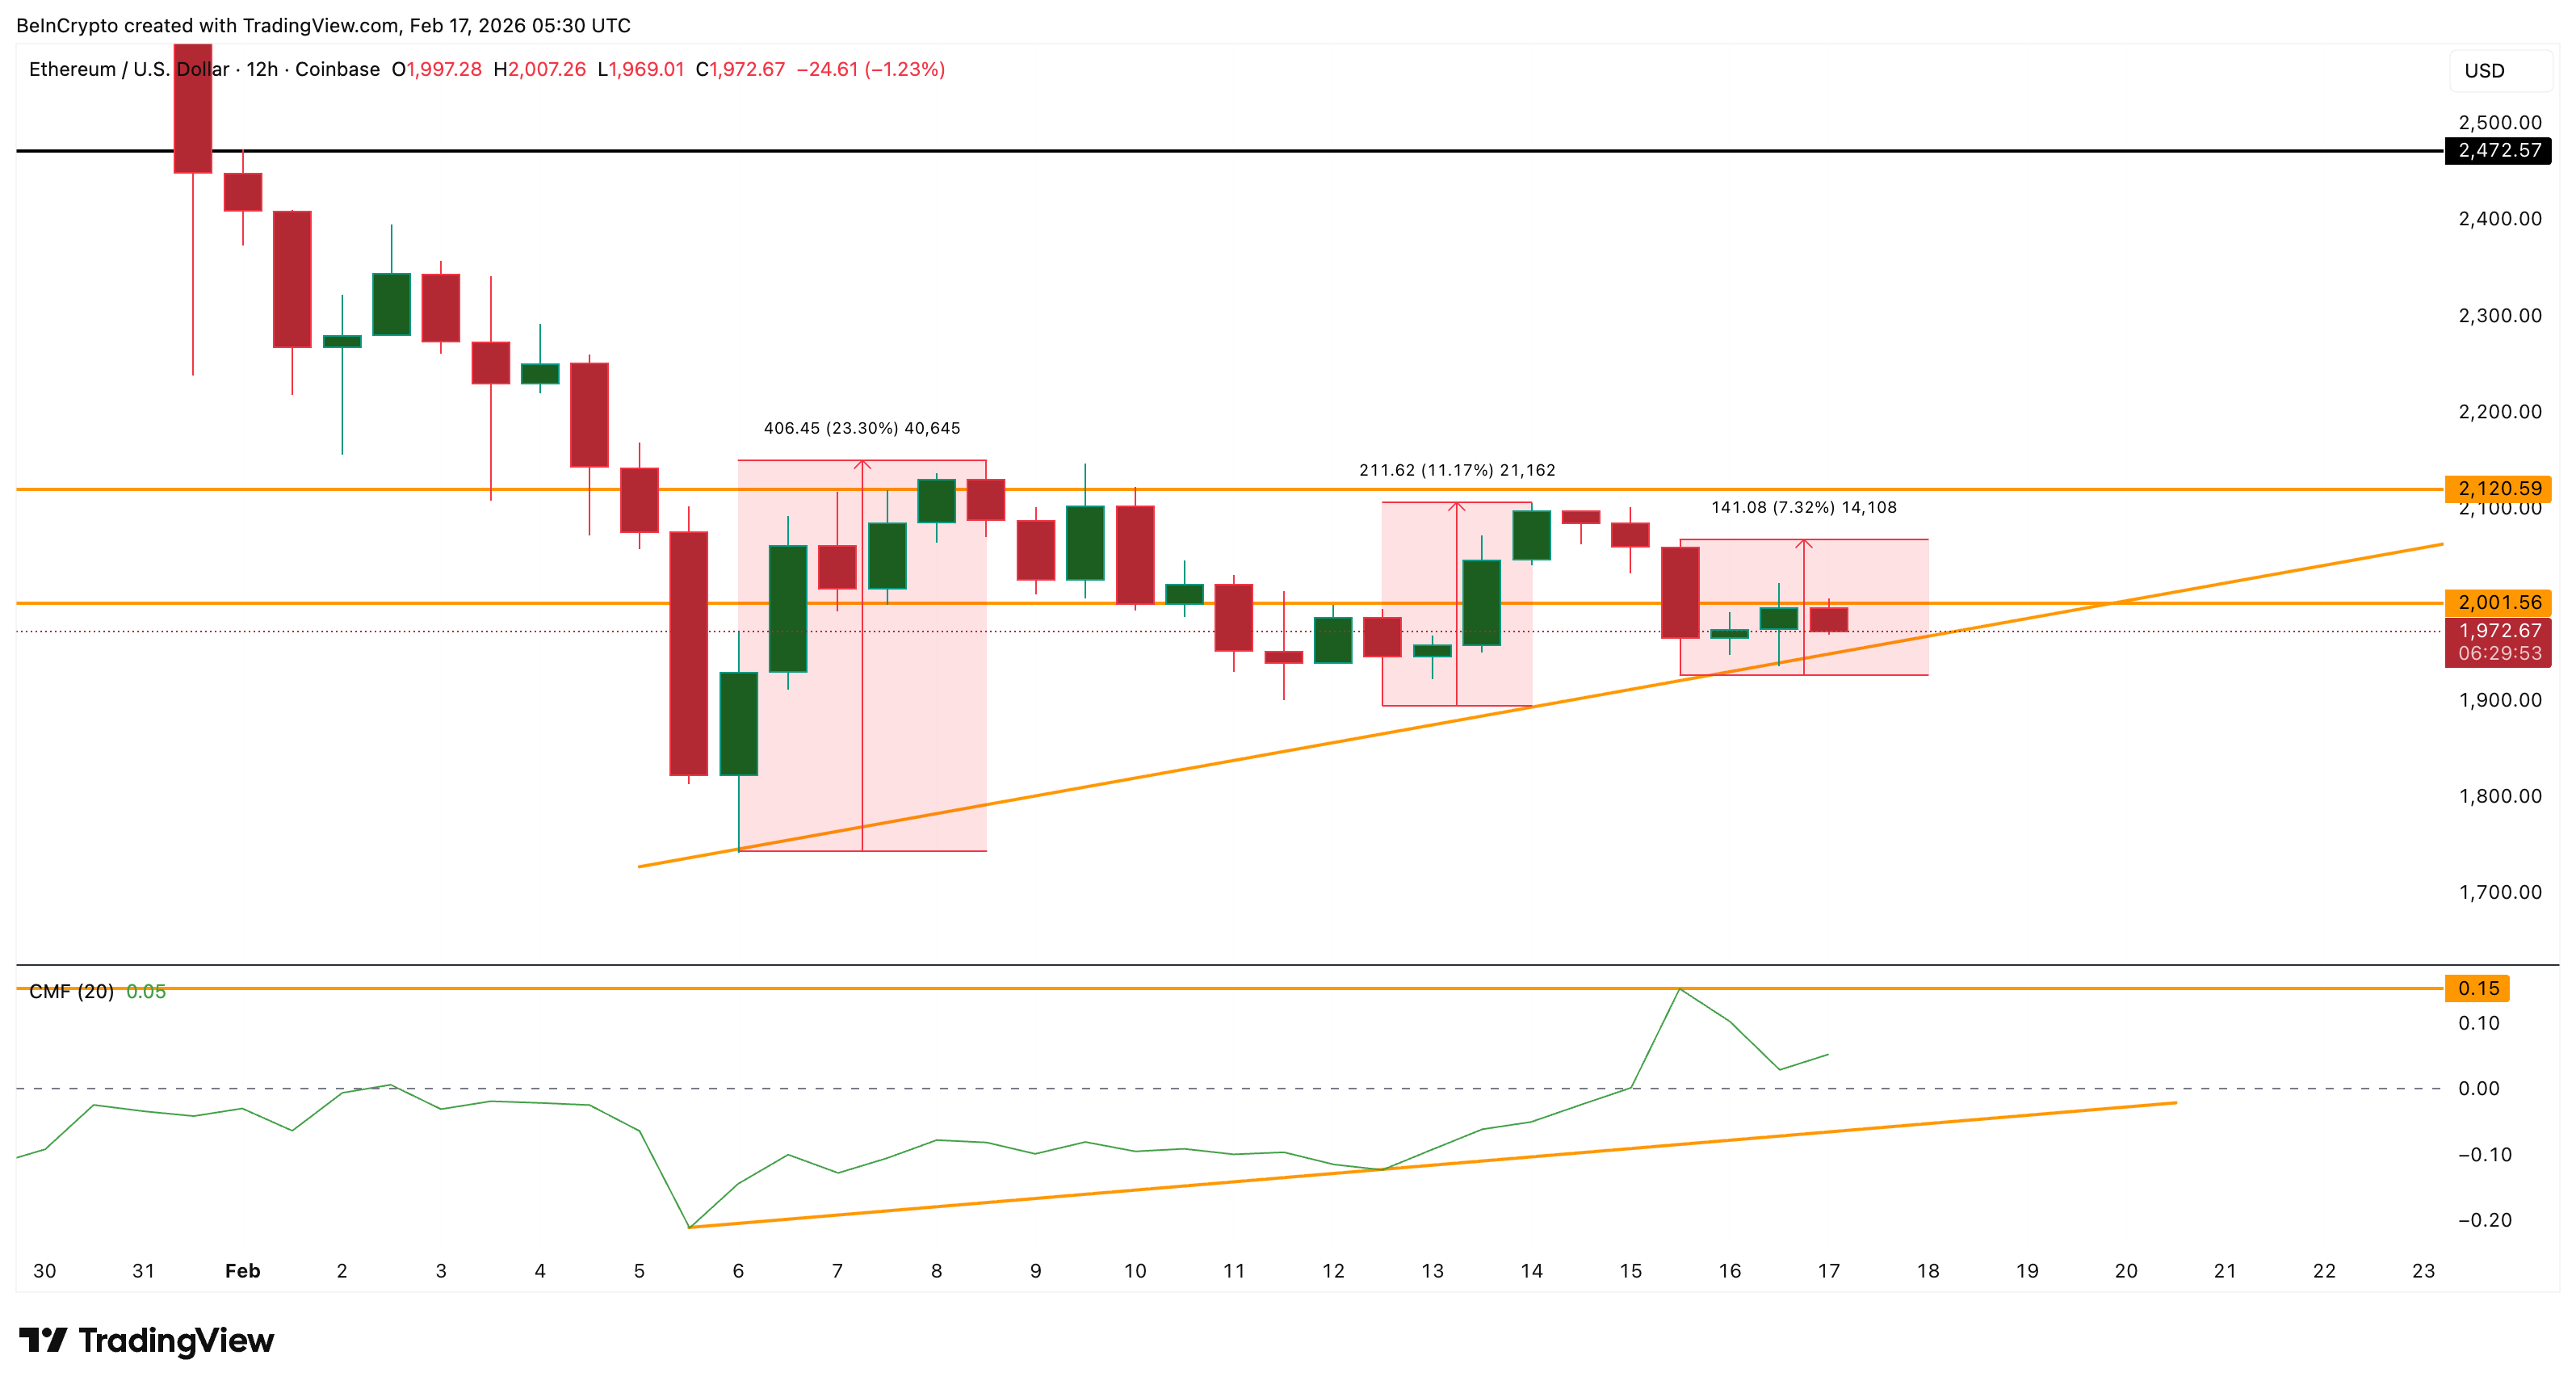
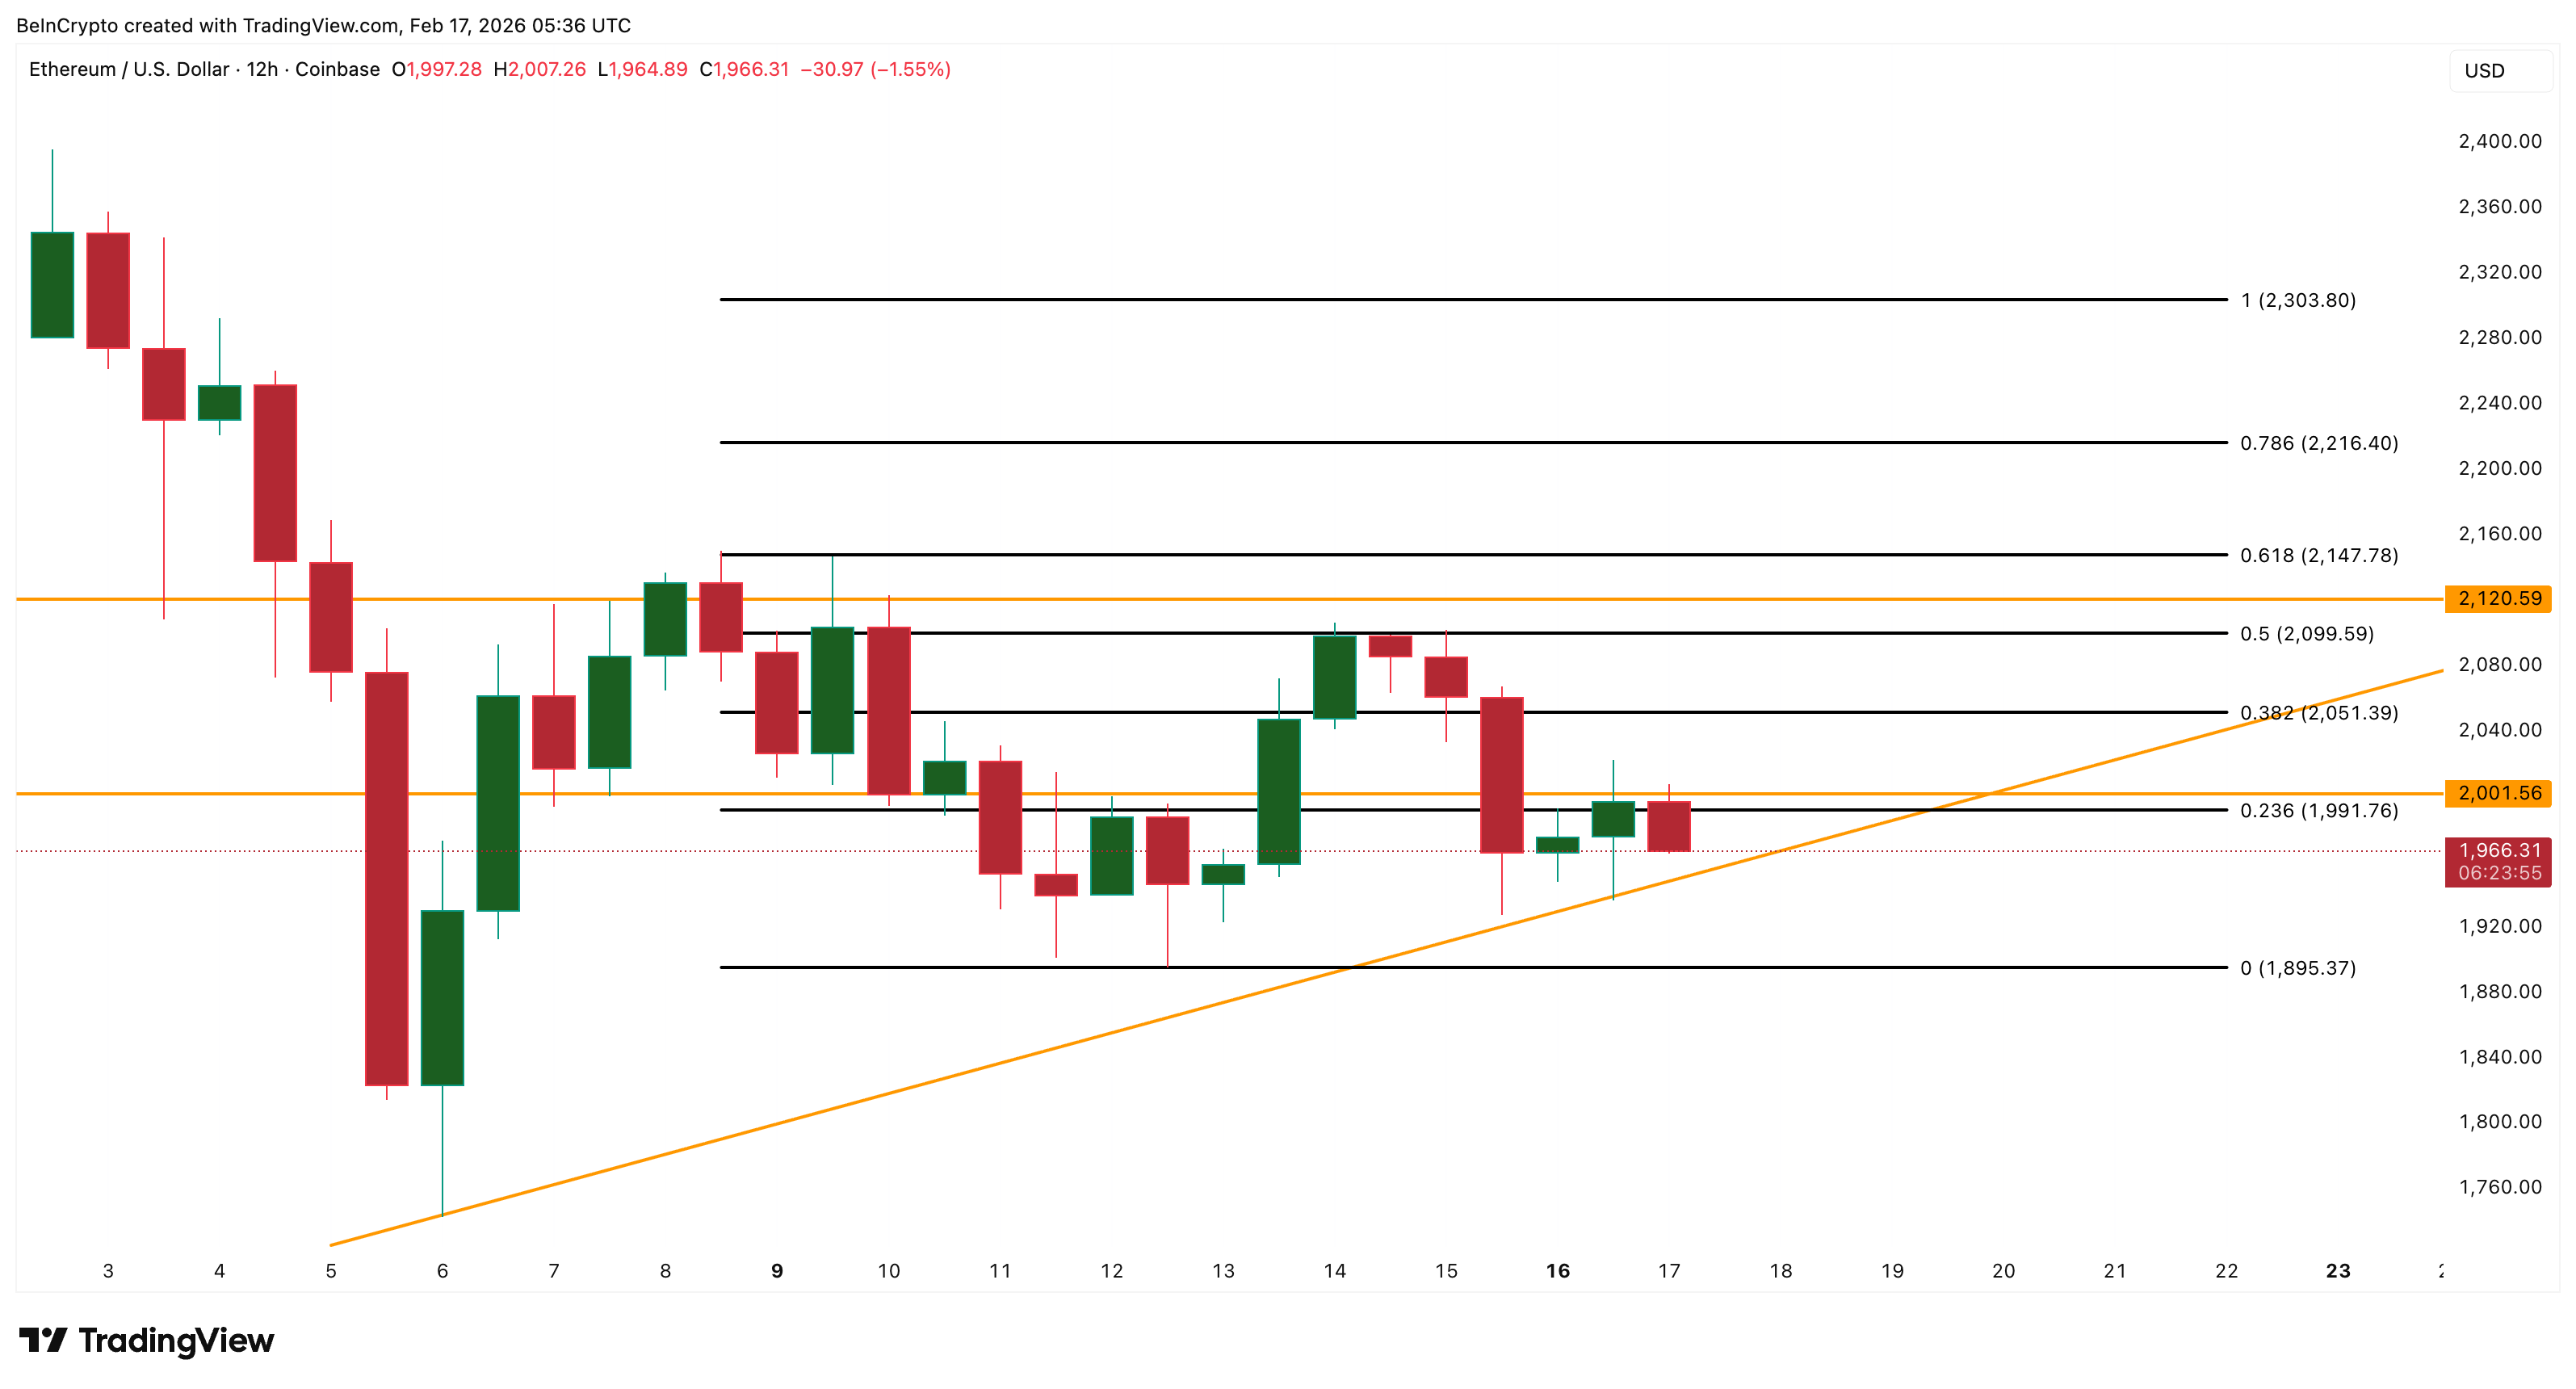
The Ethereum price has been forming an ascending triangle since early February. This pattern forms when buyers push the price gradually higher, while sellers consistently defend the same resistance zone.
The rising trendline shows buyers stepping in earlier during each dip. But the resistance zones near $2,000 and $2,120 have stopped every rebound so far.
Three clear rebound attempts happened. On Feb. 6, the Ethereum price jumped 23% but failed near $2,120. On Feb. 12, the price rose 11% but again failed below resistance. On Feb. 15, the price climbed 7% but eventually stalled under $2,000. Even though buyers returned each time, they could not break through.
One key indicator supporting the recovery attempt is the Chaikin Money Flow (CMF). CMF measures large investor buying and selling by combining price and volume. When CMF rises above zero, it shows more buying than selling.
Ethereum’s CMF crossed above zero on Feb. 15 (during the third rebound attempt) and remains positive near 0.05. This suggests large investors have started buying again. But the buying strength remains limited so far.
 Ethereum Price Rebounds: TradingView
Want more token insights like this? Sign up for Editor Harsh Notariya’s Daily Crypto Newsletter here.
This raises an important question. If buyers are returning, why does the Ethereum price keep failing? The answer becomes clearer by looking at whales and long-term holders.
Whale and Long-Term Holder Selling Increased
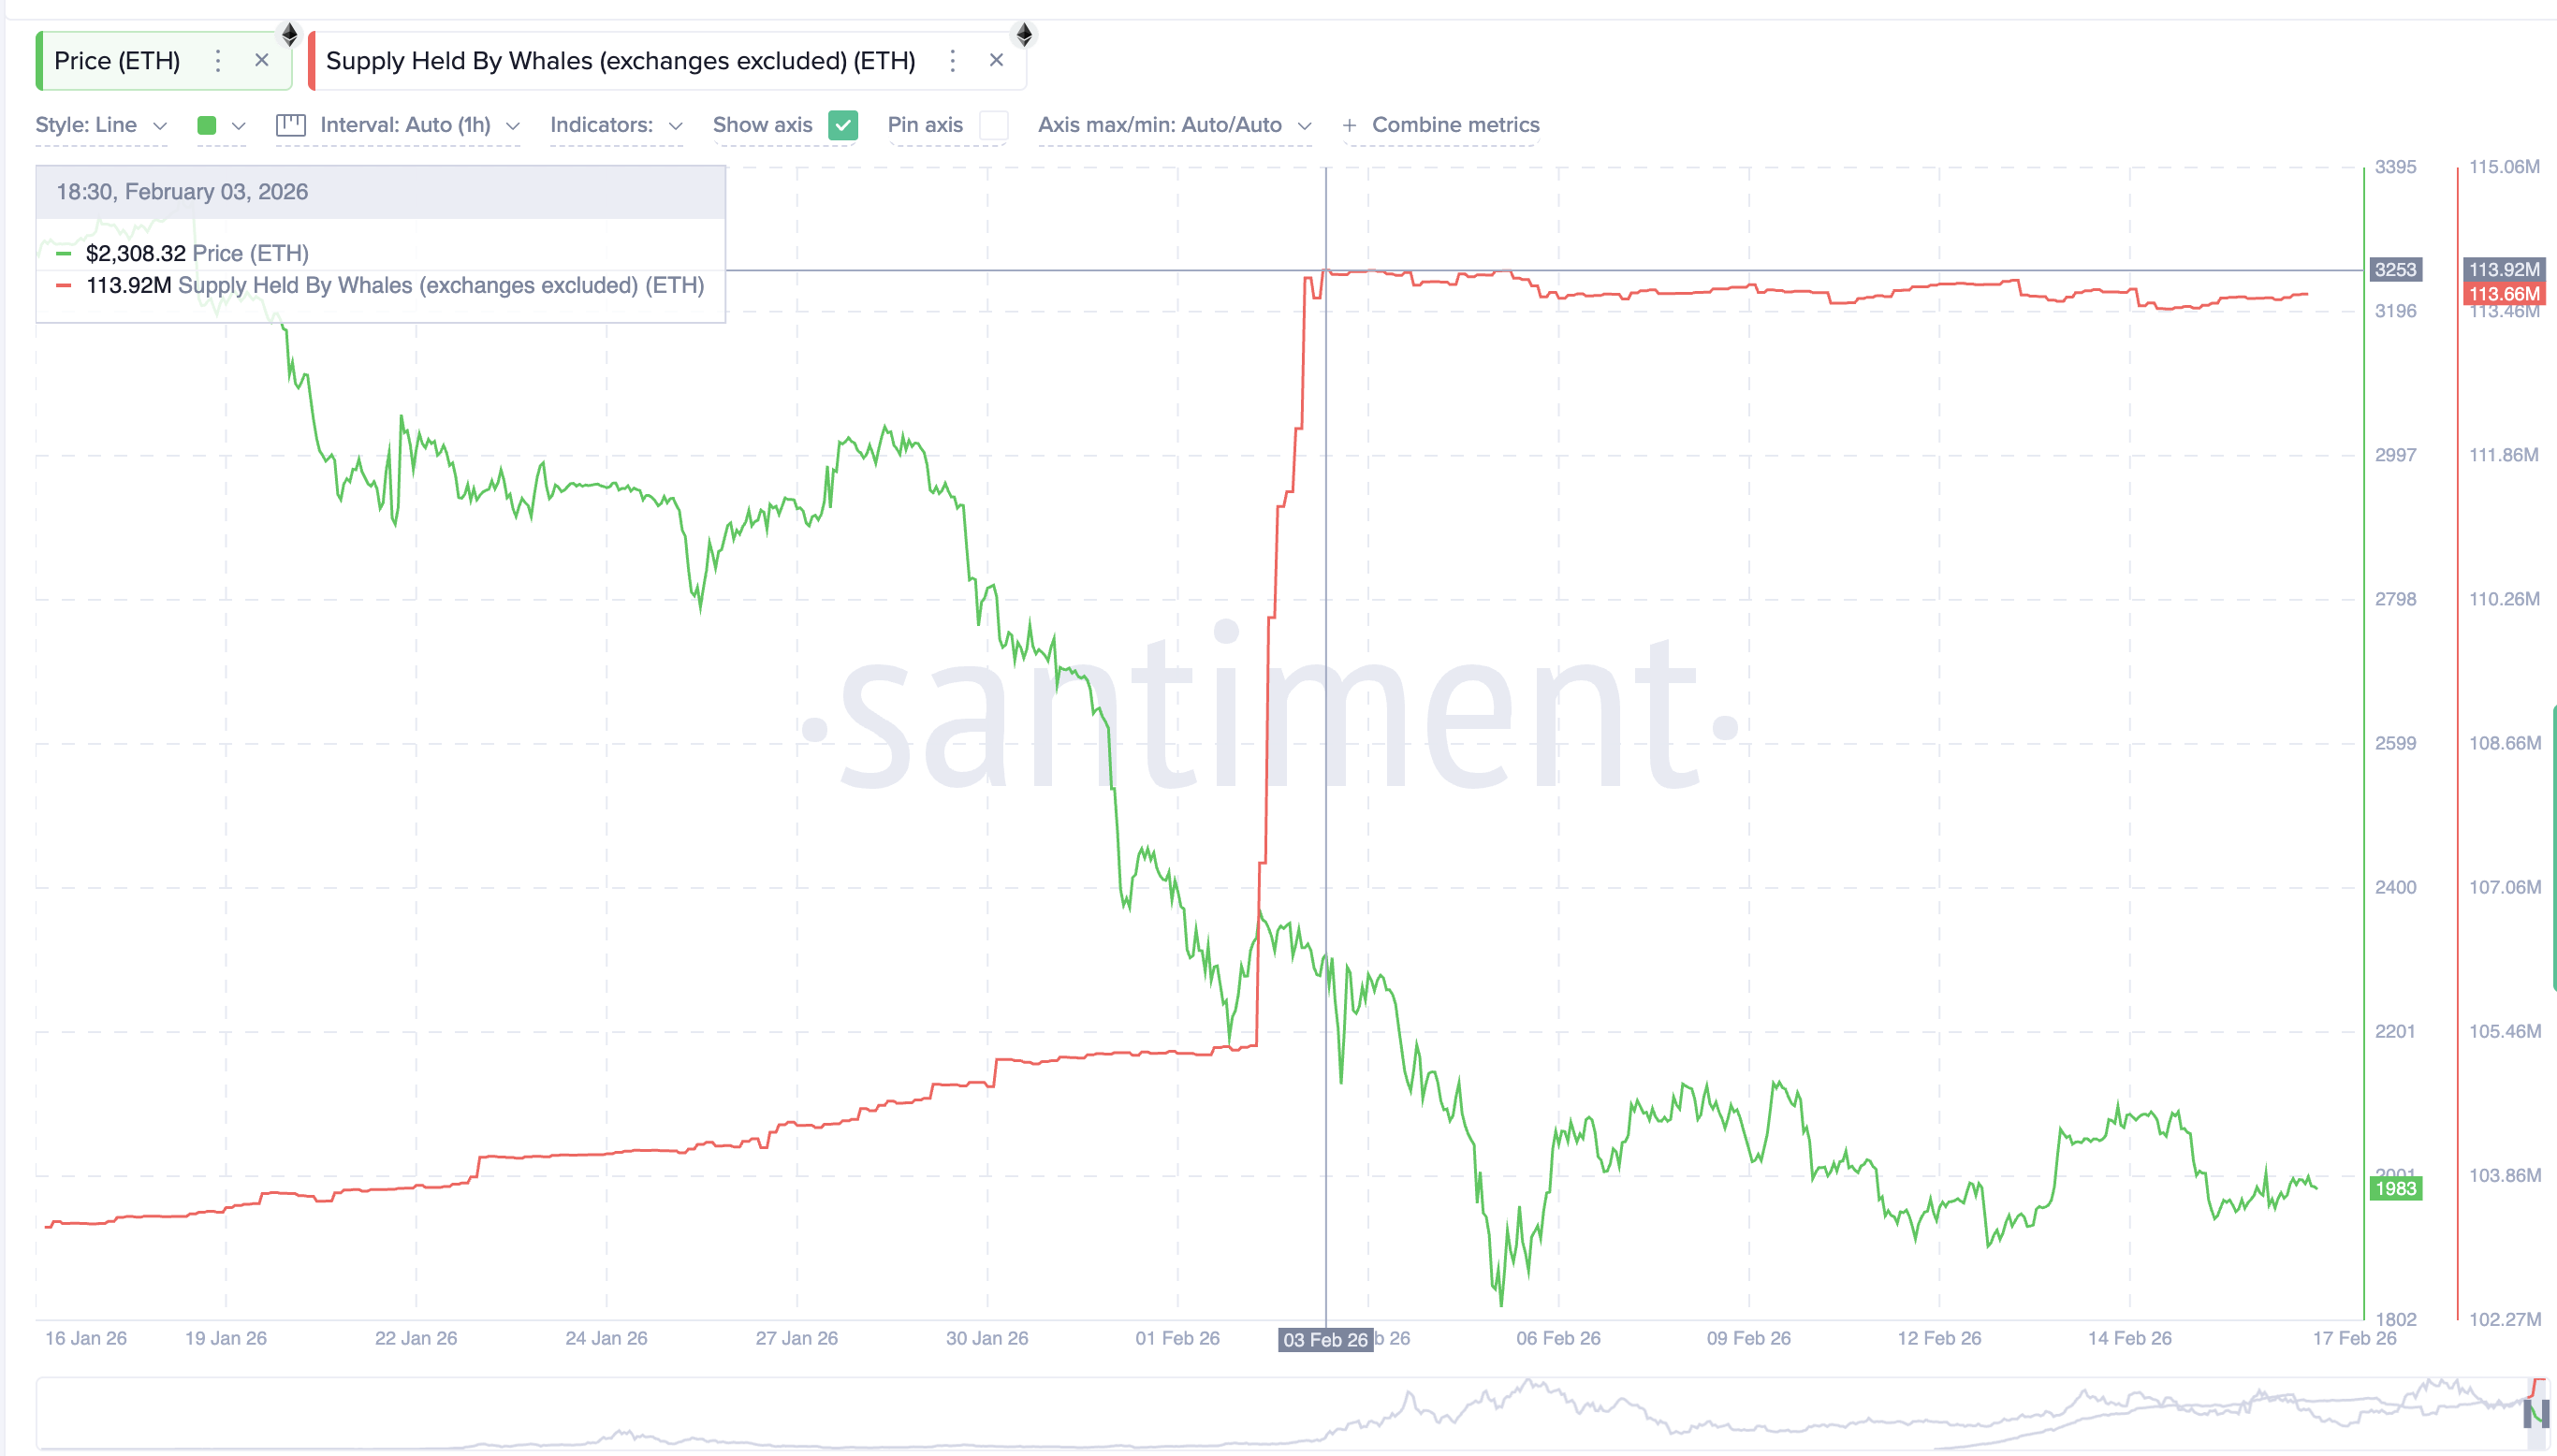
Large investors have been reducing exposure during the same period that Ethereum price tried to recover. Wallets holding large amounts of ETH, known as whales, reduced their holdings from 113.92 million ETH to 113.66 million ETH. This equals a decline of about 260,000 ETH, roughly $500 million.
 Ethereum Whales: Santiment
This shows whales were selling ETH during the recovery attempts instead of supporting the price.
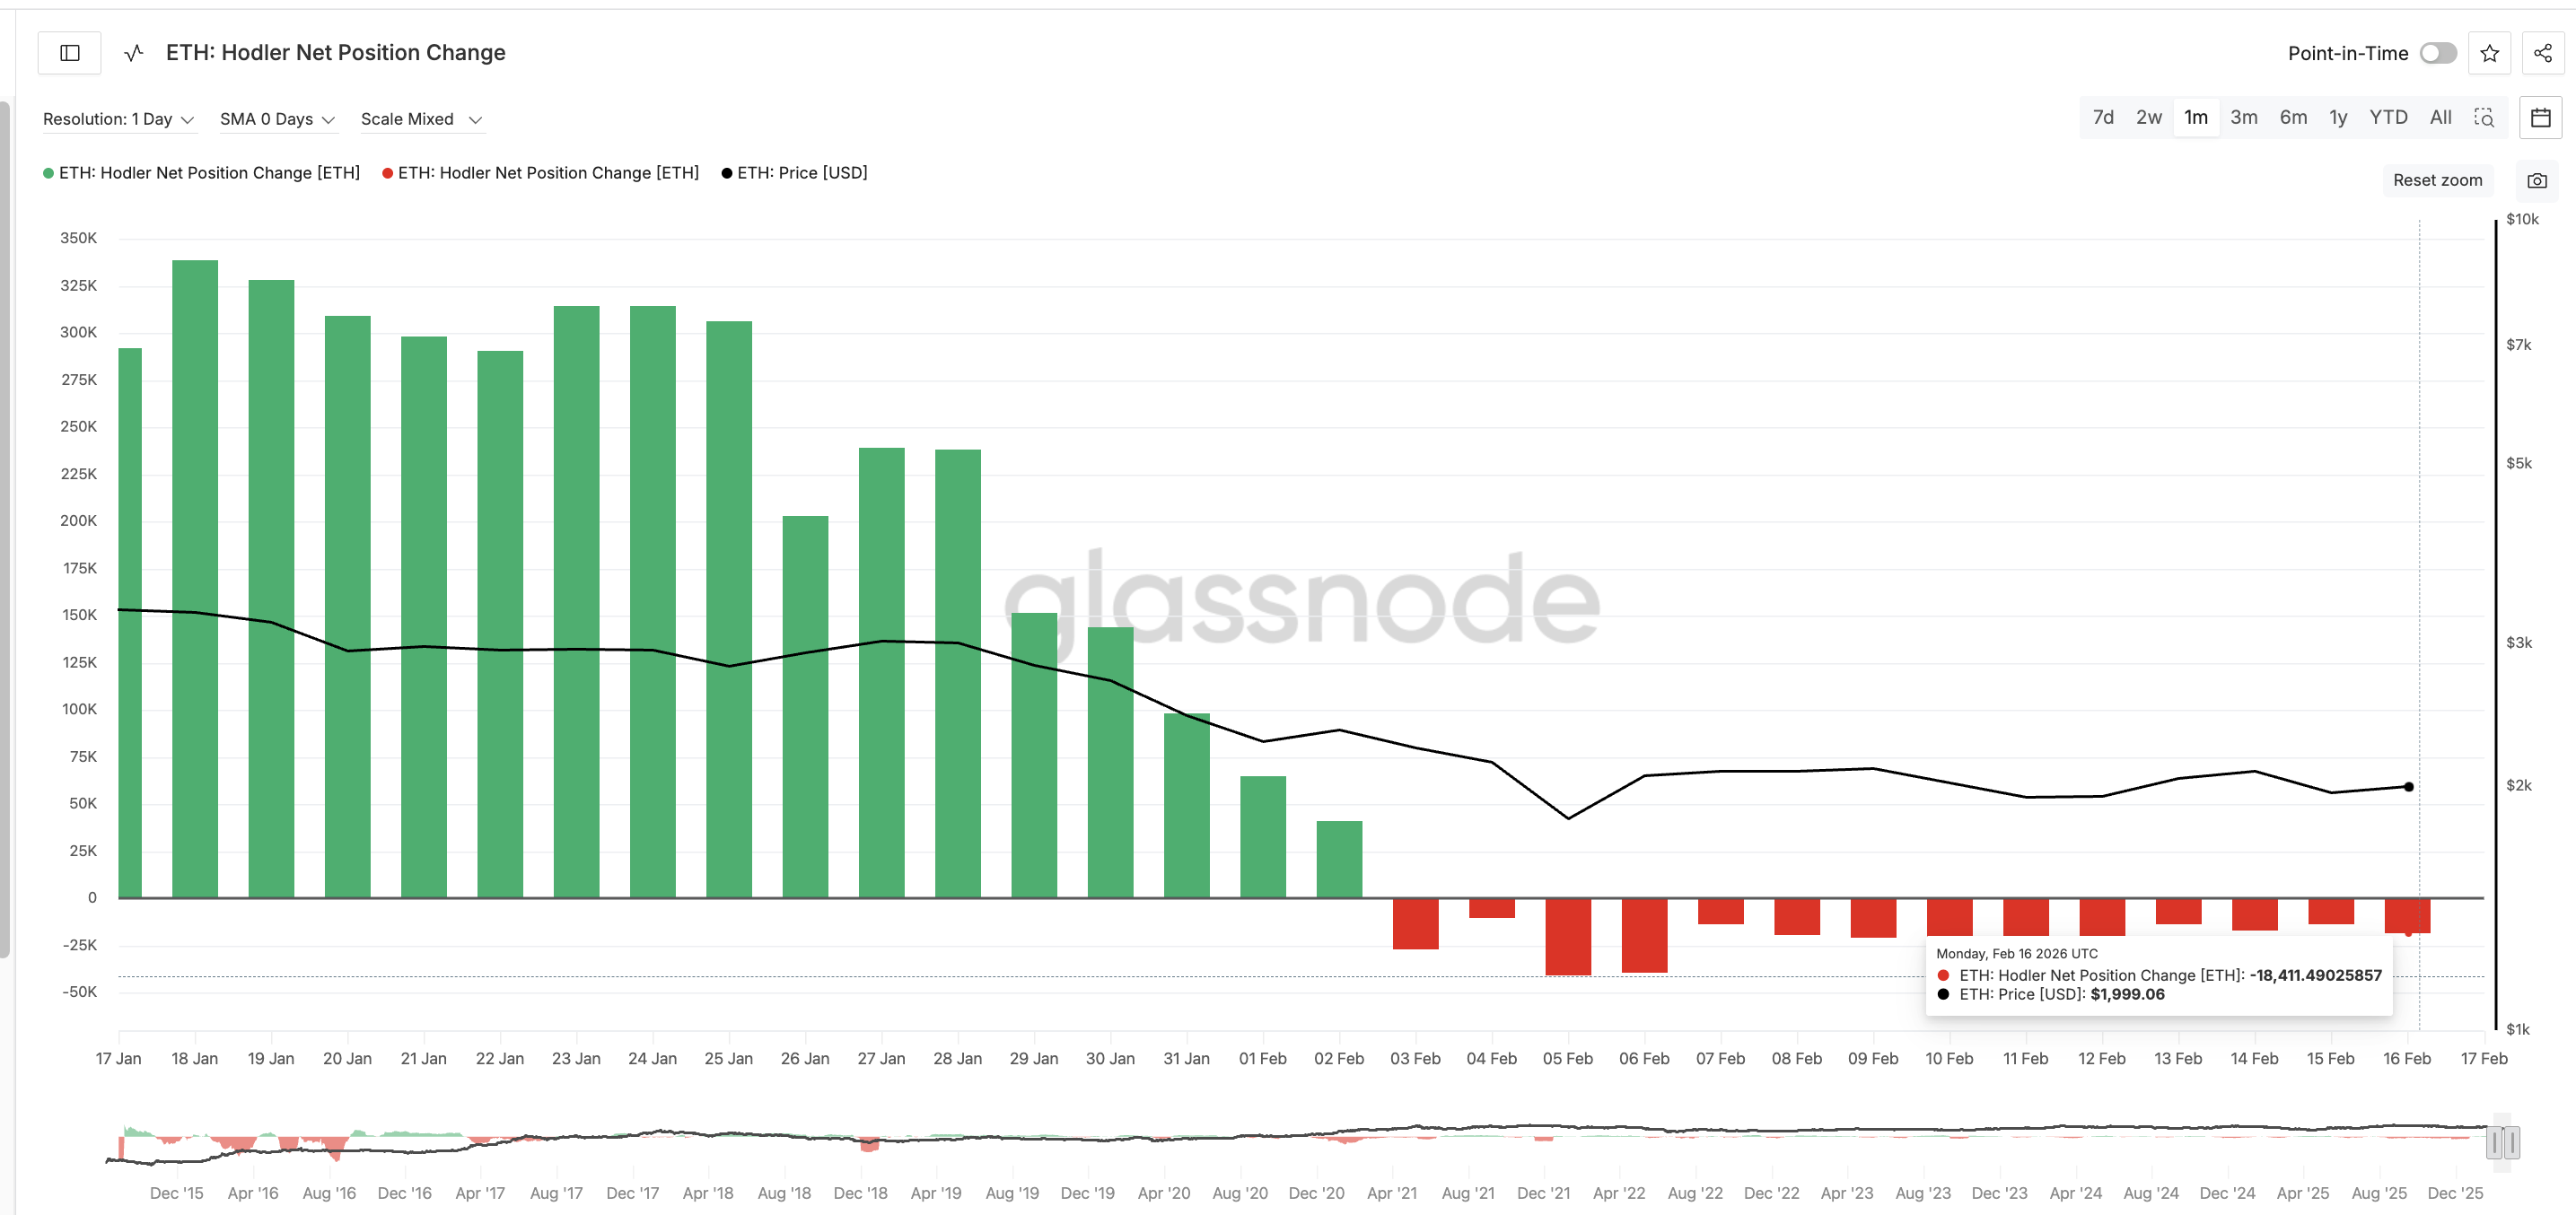
Another key metric confirms this trend. The Hodler Net Position Change metric tracks whether long-term investors are accumulating or selling. When the metric turns negative, it means long-term holders are selling.
Ethereum’s Holder Net Position Change remained negative between Feb. 3 and Feb. 16 (during the rebound phase). Selling also increased from -13,677 ETH to -18,411 ETH. This marks a 34% rise in selling pressure.
 Hodlers Selling: Glassnode
This timing is critical. Each rebound attempt happened during this same period of increased selling.
This explains why the Ethereum price could not sustain its recovery. Even though new buyers entered, long-term holders and whales were exiting. But there is another reason why the $2,000 and $2,120 levels remain difficult to break.
Cost Basis Data Shows Why Ethereum Price Keeps Failing Near $2,000
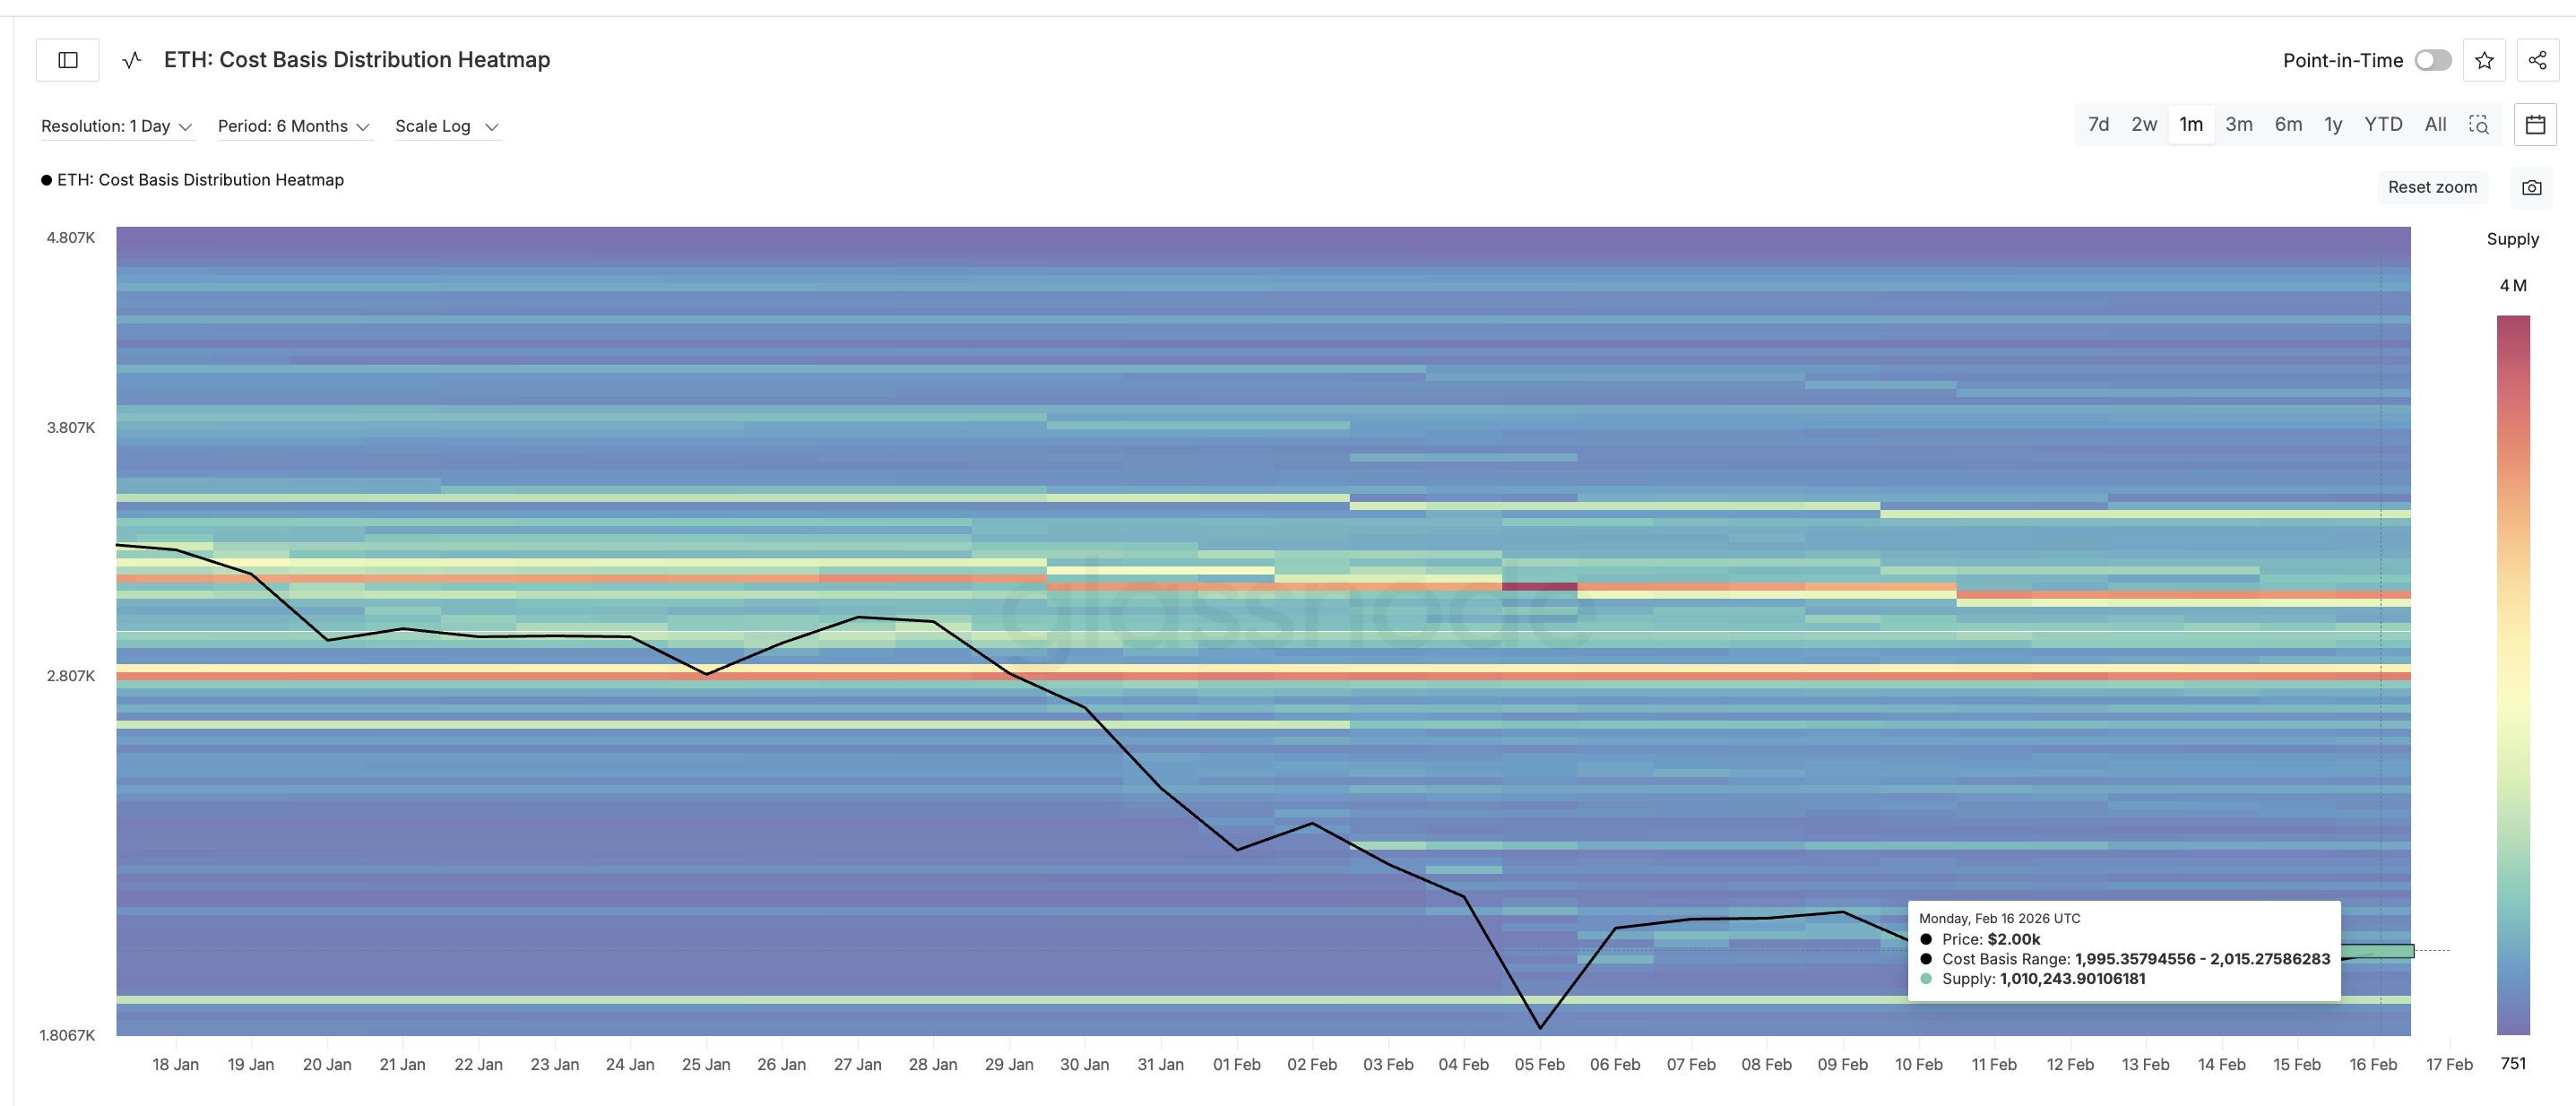
Cost basis data shows where investors originally bought their Ethereum. This level often becomes resistance when the price returns to it.
The largest cost basis cluster currently sits between $1,995 and $2,015. More than 1.01 million ETH were purchased in this range. This creates strong selling pressure.
 Cost Basis Heatmap: Glassnode
When the Ethereum price returns to this level, many investors choose to sell to recover their initial investment. This increases supply and prevents the price from rising further. This pattern matches all three rebound failures.
Each rebound attempt stopped near (or slightly above) this same cost basis zone. This confirms that the Ethereum price must break through this level cleanly to start a stronger recovery. Ethereum price now remains stuck between support and resistance.
Immediate resistance levels are $2,000 (most vital for now) and $2,120, as highlighted earlier. But more detailed levels now come into the picture if we use technical projections. If Ethereum breaks above the $2,120-$2,140 zone, the next upside targets could reach $2,210 and $2,300.
 Ethereum Price Analysis: TradingView
But failure to break resistance could keep the Ethereum price moving sideways. Support remains near $1,895, and a dip under that would invalidate the trendline-led recovery attempt. The charts show recovery attempts are forming. CMF confirms buyers are returning. But whale selling, long-term holder selling, and cost basis resistance continue blocking the rally.
Ethereum price prediction now depends on whether buyers can finally absorb this selling pressure and break above resistance.
Recommended Articles


