

Buy-the-Dip Sentiment Is Returning — How Far Can the Crypto Market Recover?
After falling to nearly $2.0 trillion last Friday, the total crypto market capitalization has rebounded to above $2.3 trillion. Investors appear to be spotting opportunities, and buy-the-dip sentiment is resurfacing.
The key question is whether this rebound is strong enough to form a classic V-shaped recovery. Several market signals offer insight.
Signs of Buy-the-Dip Behavior After the Panic Sell-Off
One of the earliest and most notable signals is the renewed inflow of stablecoins into centralized exchanges. This trend reversed after months of decline, even though selling pressure remains elevated.
Rising stablecoin balances on exchanges reflect investors’ readiness to deploy capital. This signal is particularly relevant to retail traders, who primarily trade on exchanges.
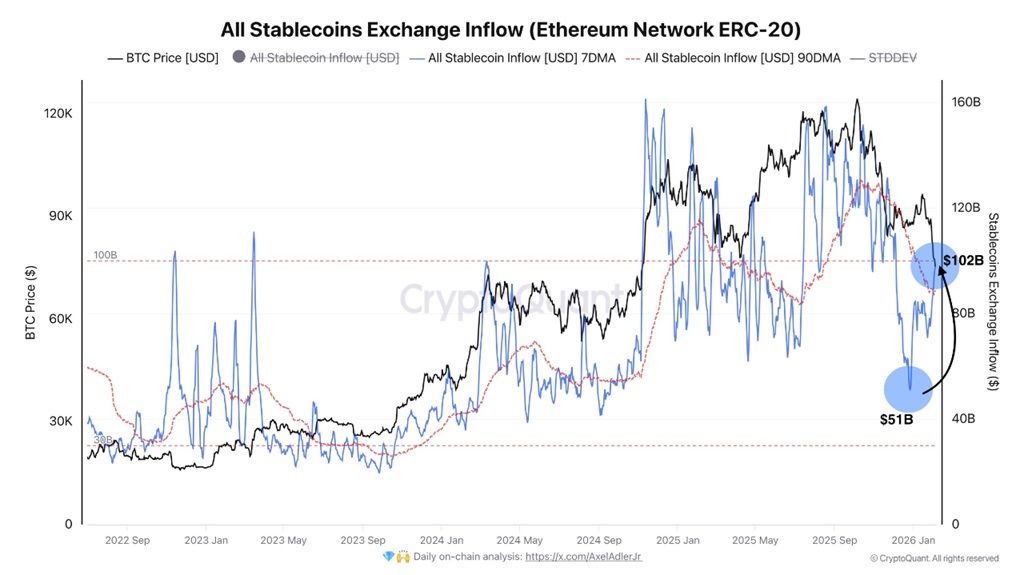 All Stablecoin Exxchange Infflow (ETH-ERC-20). Source: CryptoQuant.
Data from CryptoQuant shows that the 7-day average value of ERC-20 stablecoins flowing into exchanges on Ethereum increased from $51 billion in late December 2025 to $102 billion as of now.
The $102 billion figure also exceeds the 90-day average of $89 billion. This suggests that capital deployment has accelerated over the past few weeks.
Although selling pressure remains significant, the growth in stablecoin inflows indicates renewed investor interest. Some market participants may already be accumulating positions at perceived market bottoms.
Additionally, the Accumulation Trend Score from Glassnode provides further confirmation. Wallets of all sizes, from small holders to large entities, are shifting toward stronger accumulation.
This indicator measures changes in balance across wallet cohorts and assigns a score between 0 and 1. Higher values indicate more aggressive accumulation behavior.
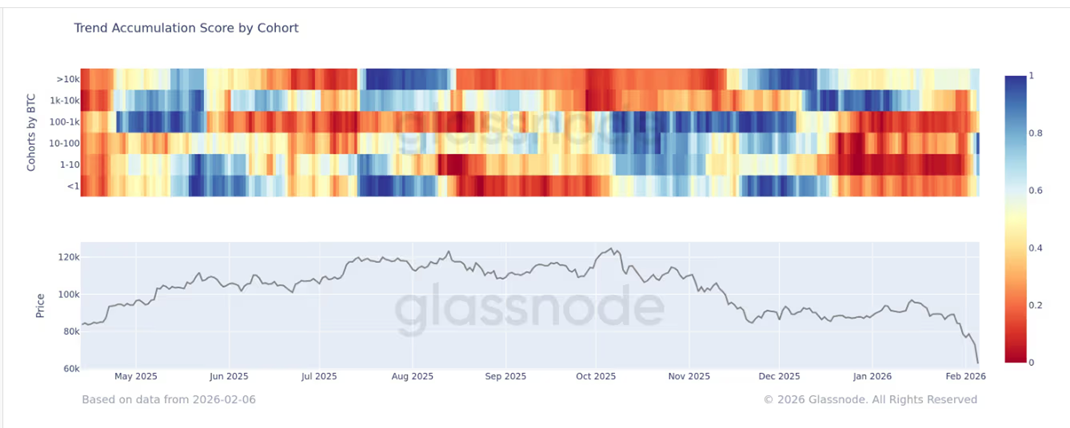 Accumulation Trend Score. Source: Glassnode
Glassnode’s chart shows the score moving from yellow and red zones (below 0.5) over the past two months to blue zones (above 0.5) across multiple wallet categories. Wallets holding 10–100 BTC stand out as the most aggressive buyers, with the indicator turning dark blue and approaching 1.
Observations from Lookonchain, an account that tracks notable on-chain activity, further support this data. The account has repeatedly reported whale accumulation in recent periods, not only in Bitcoin but also in Ethereum.
Overall, these signals suggest that buy-the-dip sentiment is returning among both retail investors, as reflected in rising stablecoin inflows, and whales, as reflected in on-chain accumulation. However, a sustainable recovery still depends on the market’s ability to hold key levels in total capitalization.
According to well-known analyst Daan Crypto Trades, TOTAL swept the April 2025 lows, which were associated with tariff-related news, and then closed back above them. He argues that the market must hold above $2.3 trillion in the coming days to justify expectations of a recovery toward $2.8 trillion.
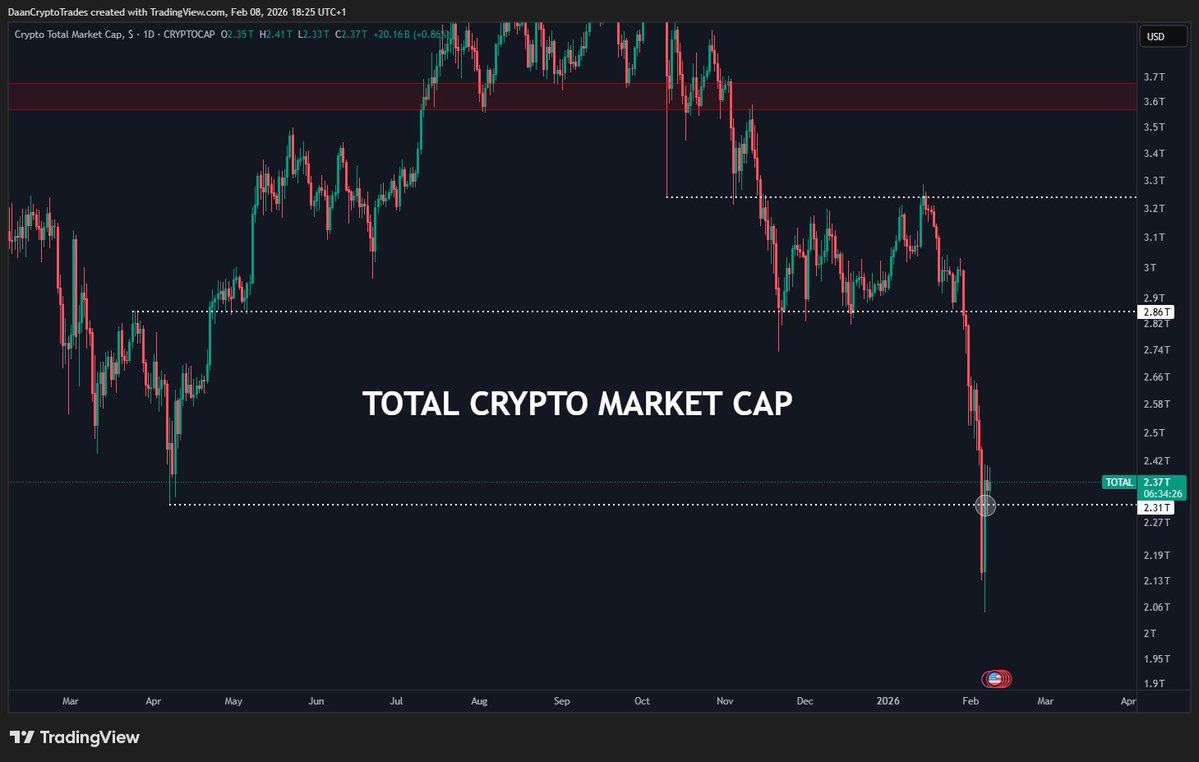 Total Crypto Market Cap. Source: Daan Crypto Trades
“I think this is an important area for the market to hold if it wants to sustain a further relief bounce,” Daan Crypto Trades said.
He also noted that after several weeks of heightened volatility, market volatility could begin to decline. Price action may then stabilize within a defined range, allowing investors to reassess conditions and search for new opportunities.
A recent analysis from BeInCrypto also highlighted the importance of the $71,000 level for Bitcoin. Only if the price stabilizes above this support level can the market reasonably expect a broader, more extended recovery.
Recommended Articles


