

Bitcoin’s 20% Bounce Looks Like a Bull Trap Despite Improving US Demand — Here’s Why
The Bitcoin price has rebounded nearly 20% after slipping close to $60,000 on February 6. The move has revived “buy-the-dip” hopes and fueled talk of a local bottom. At the same time, US demand indicators have started to recover from recent lows.
But beneath the surface, volume signals, on-chain data, and price structure suggest the rally may be fragile. Several warning patterns now resemble setups that preceded major declines in this cycle.
Bear Flag Shows Big Money Is Not Fully Committed
One of the clearest warning signals comes from the Klinger Oscillator, a volume-based indicator that tracks big money flow.
Unlike indicators such as the CMF, which focus mainly on short-term big-money pressure, the Klinger Oscillator measures large-wallet volume intensity across trends. It is designed to highlight how large players position themselves over time, not just day-to-day activity.
In simple terms, it shows whether big money is quietly accumulating or preparing to sell into rallies.
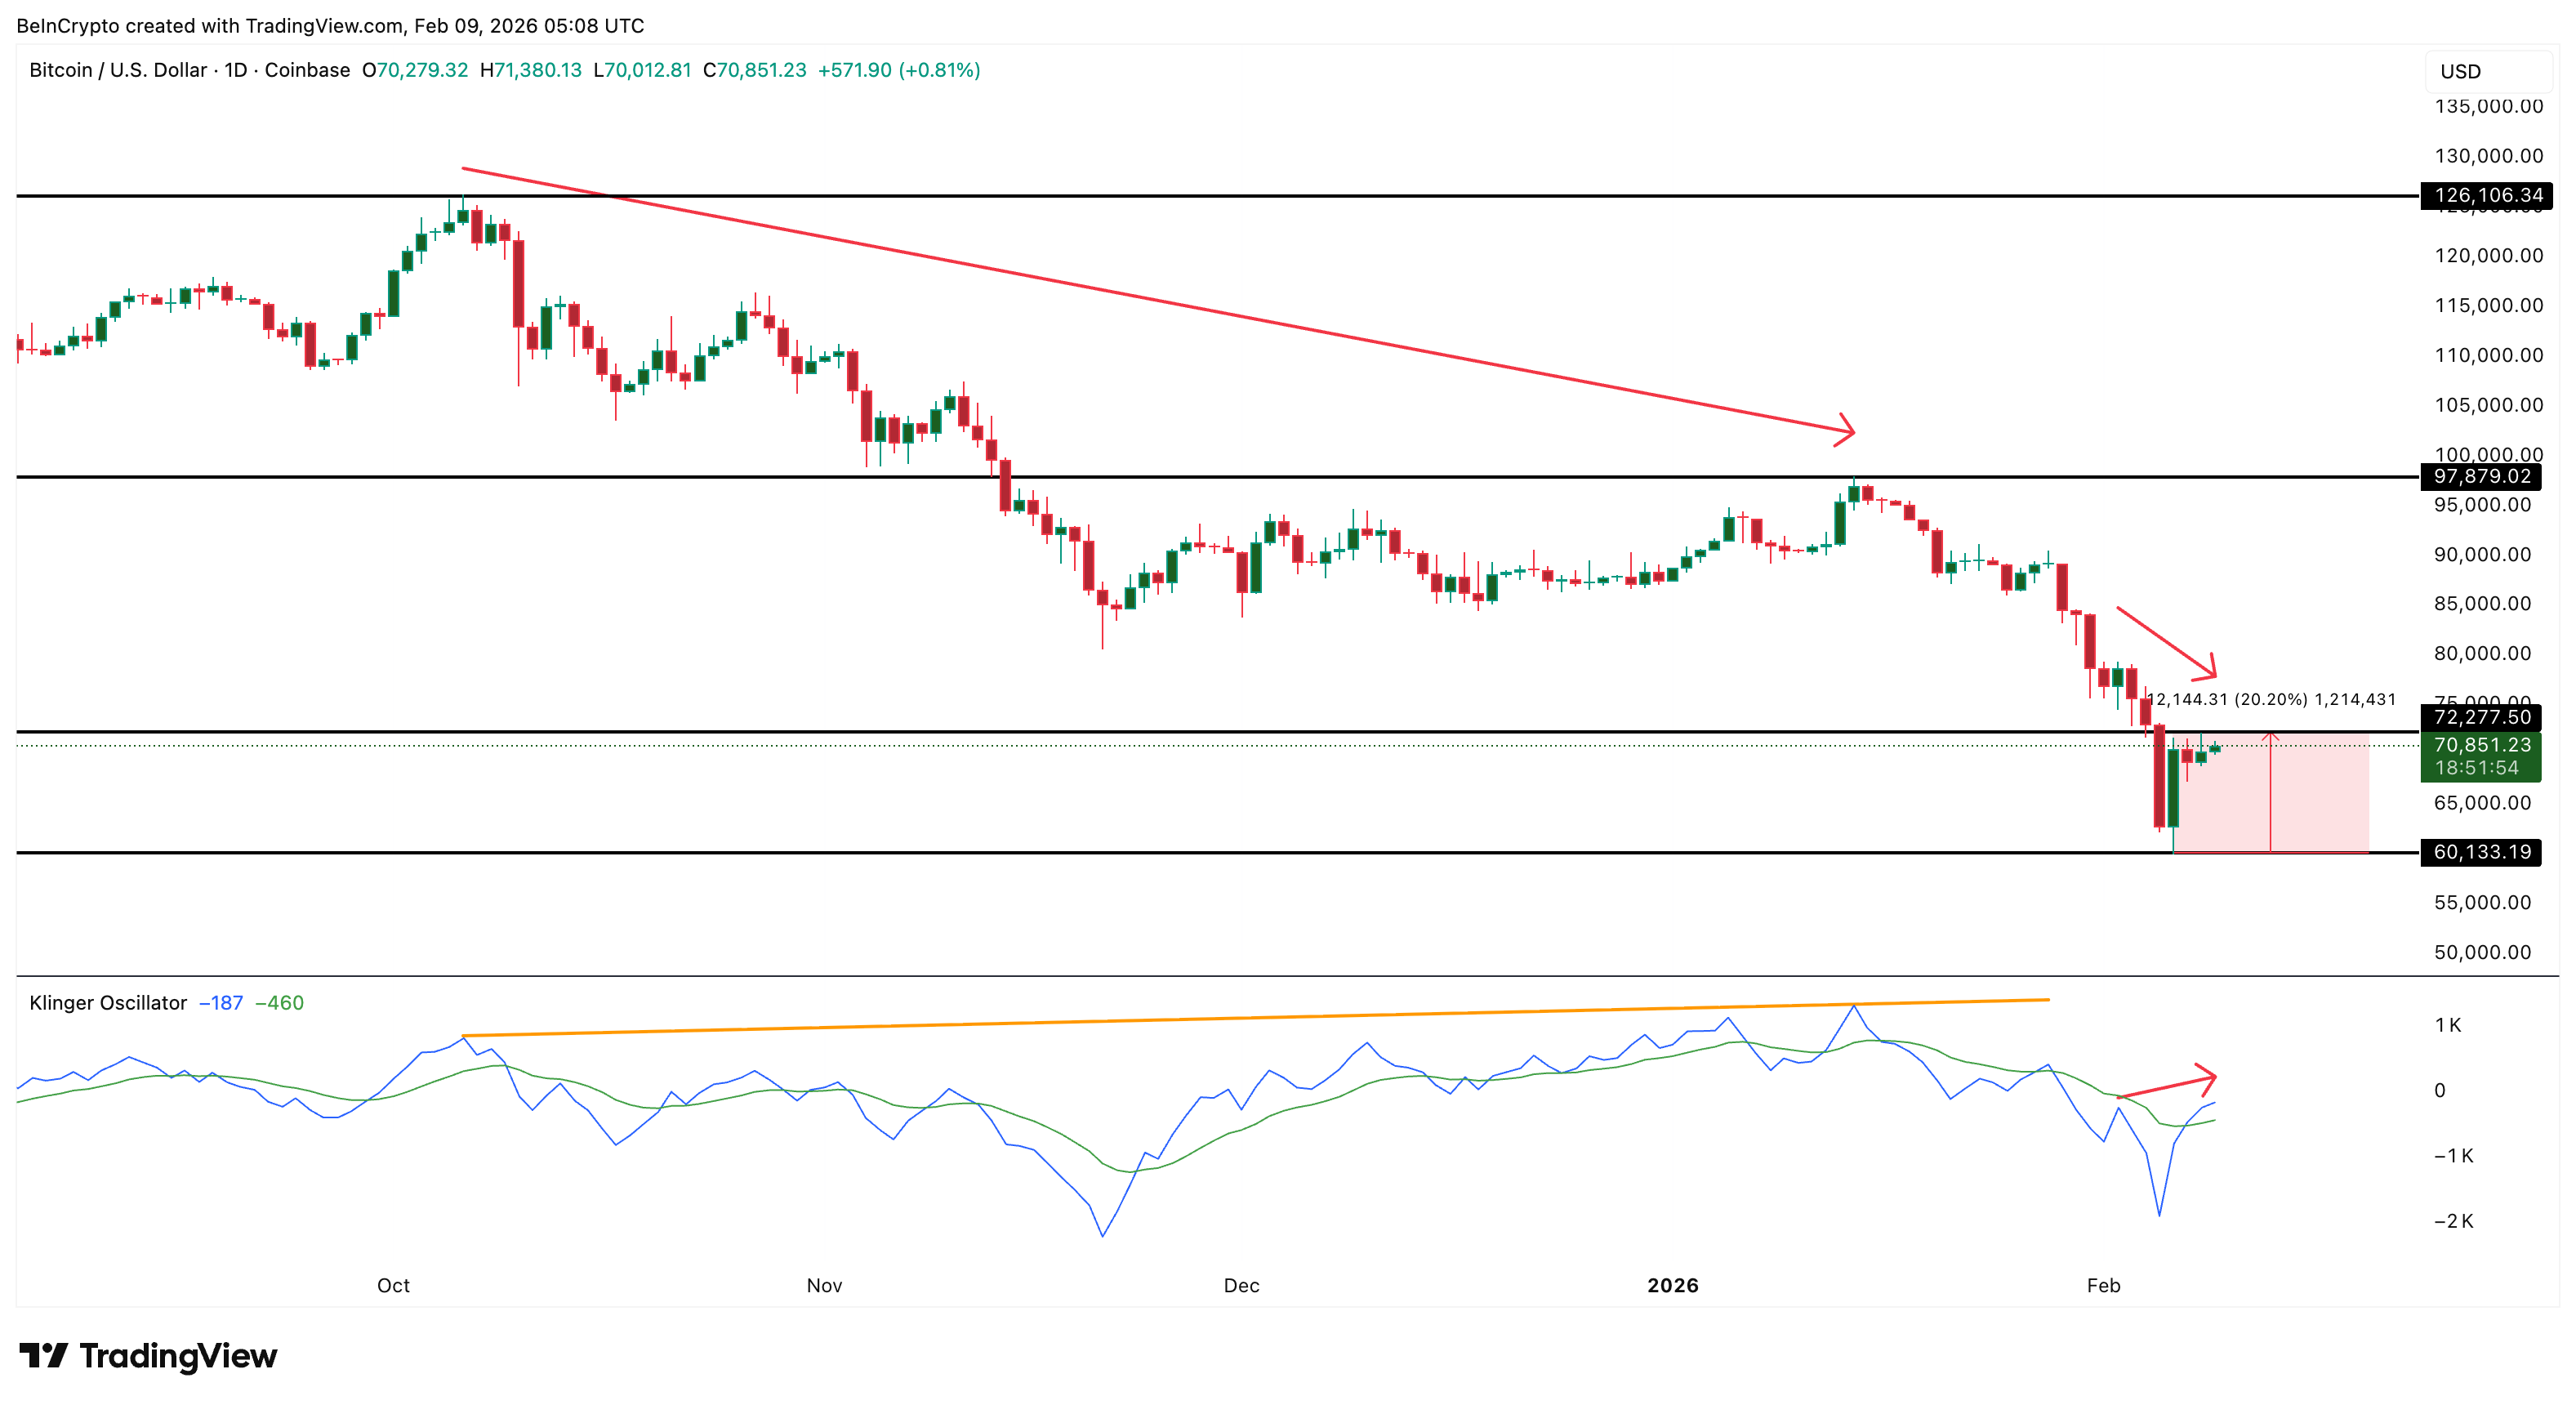
Between October 6 and January 14, Bitcoin fell from around $126,000 to $97,800, a decline of roughly 22%. During that period, the Klinger Oscillator moved higher while the price weakened. This created a bearish divergence.
 Weakening Institutional Flows: TradingView
That divergence warned that volume strength by large wallets (possibly whales and institutions) was not supporting price recovery. Within weeks, Bitcoin extended its decline toward $60,000 as the Klinger reading dropped sharply (possible big money outflows).
A similar pattern is forming again.
Between February 2 and February 9, the price drifted lower while the Klinger Oscillator trended upward. This suggests large players may be positioning (recent buys) to sell into rebounds rather than build long-term exposure.
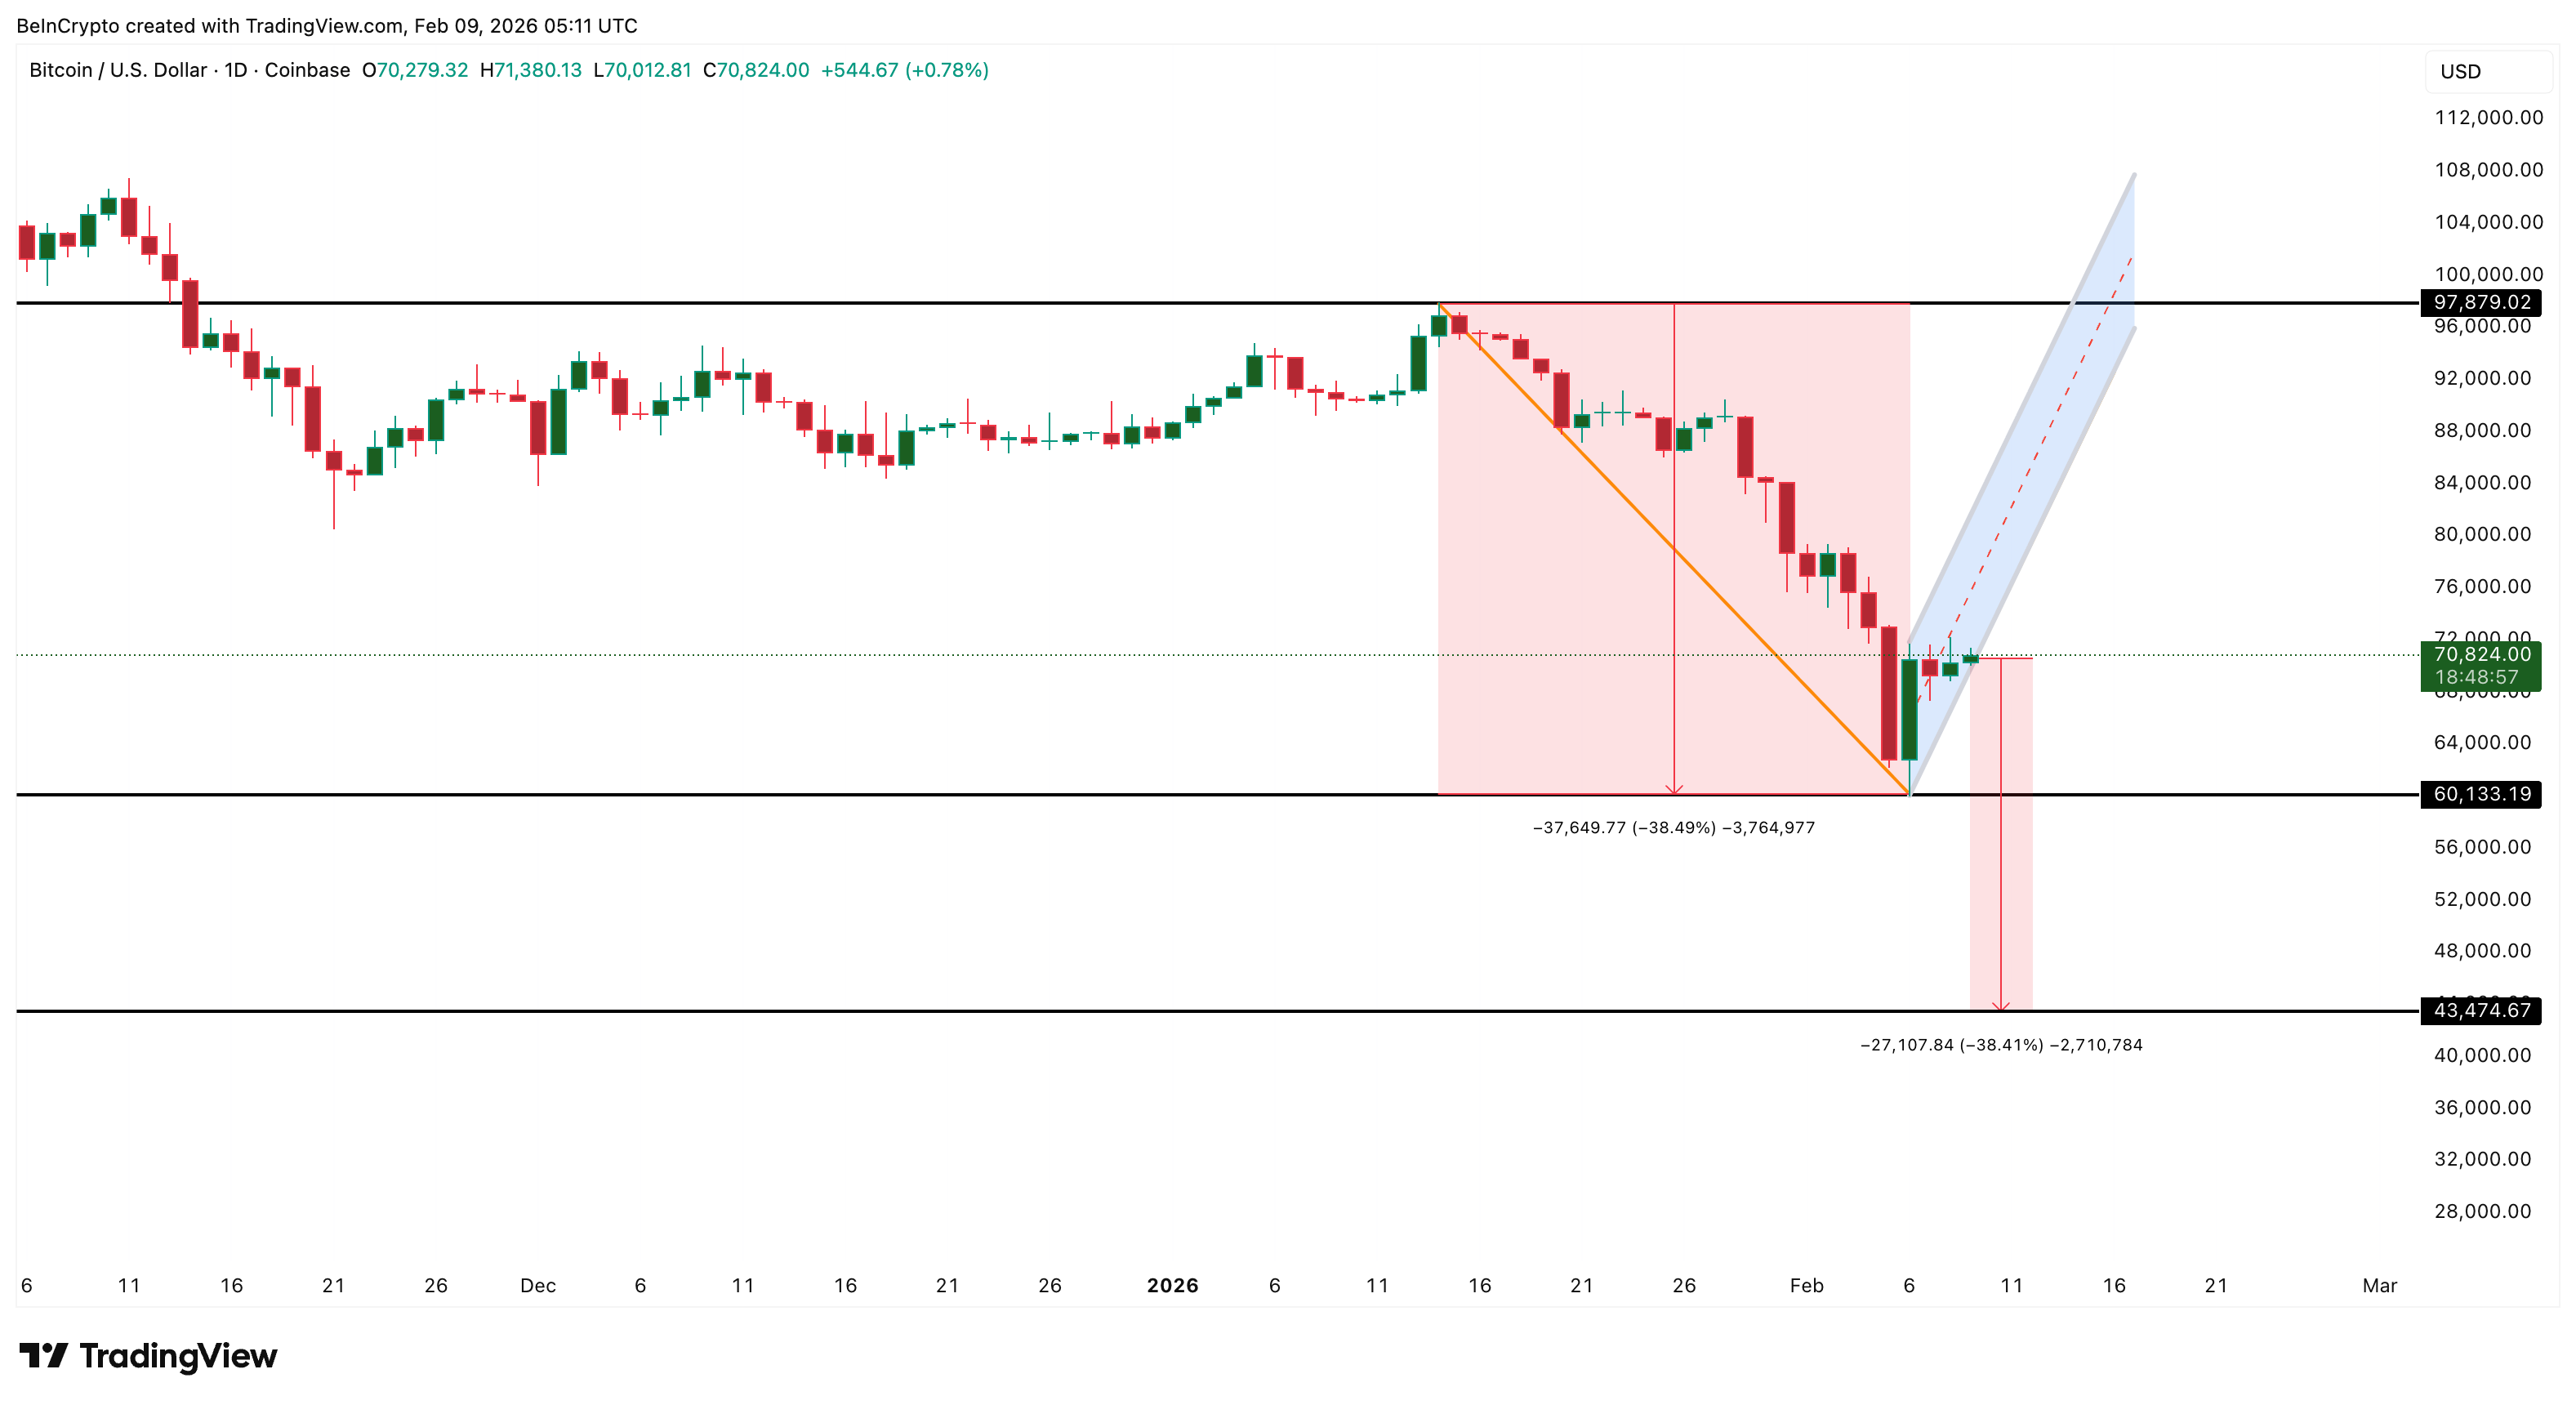
At the same time, Bitcoin’s drop from mid-January to early February formed a sharp downside “pole.” The current price bounce movement resembles a bear flag, a pattern that often signals a continuation of the lower trend, with a near 40% crash possibility if the lower trendline support gives way. That could trap the bulls buying into the bounce.
 BTC Forms A Bull Trap: TradingView
When rising Klinger readings align with a bear flag, it usually means rallies lack deep institutional support. Big players are active, but not in accumulation mode, and might distribute at any given chance. Days of BTC ETF outflows in the near term would validate the Klinger-led hypothesis.
Improving US Demand Has Failed to Mark Bottoms Before
This technical weakness does not exist in isolation. It comes even as US demand has started to improve.
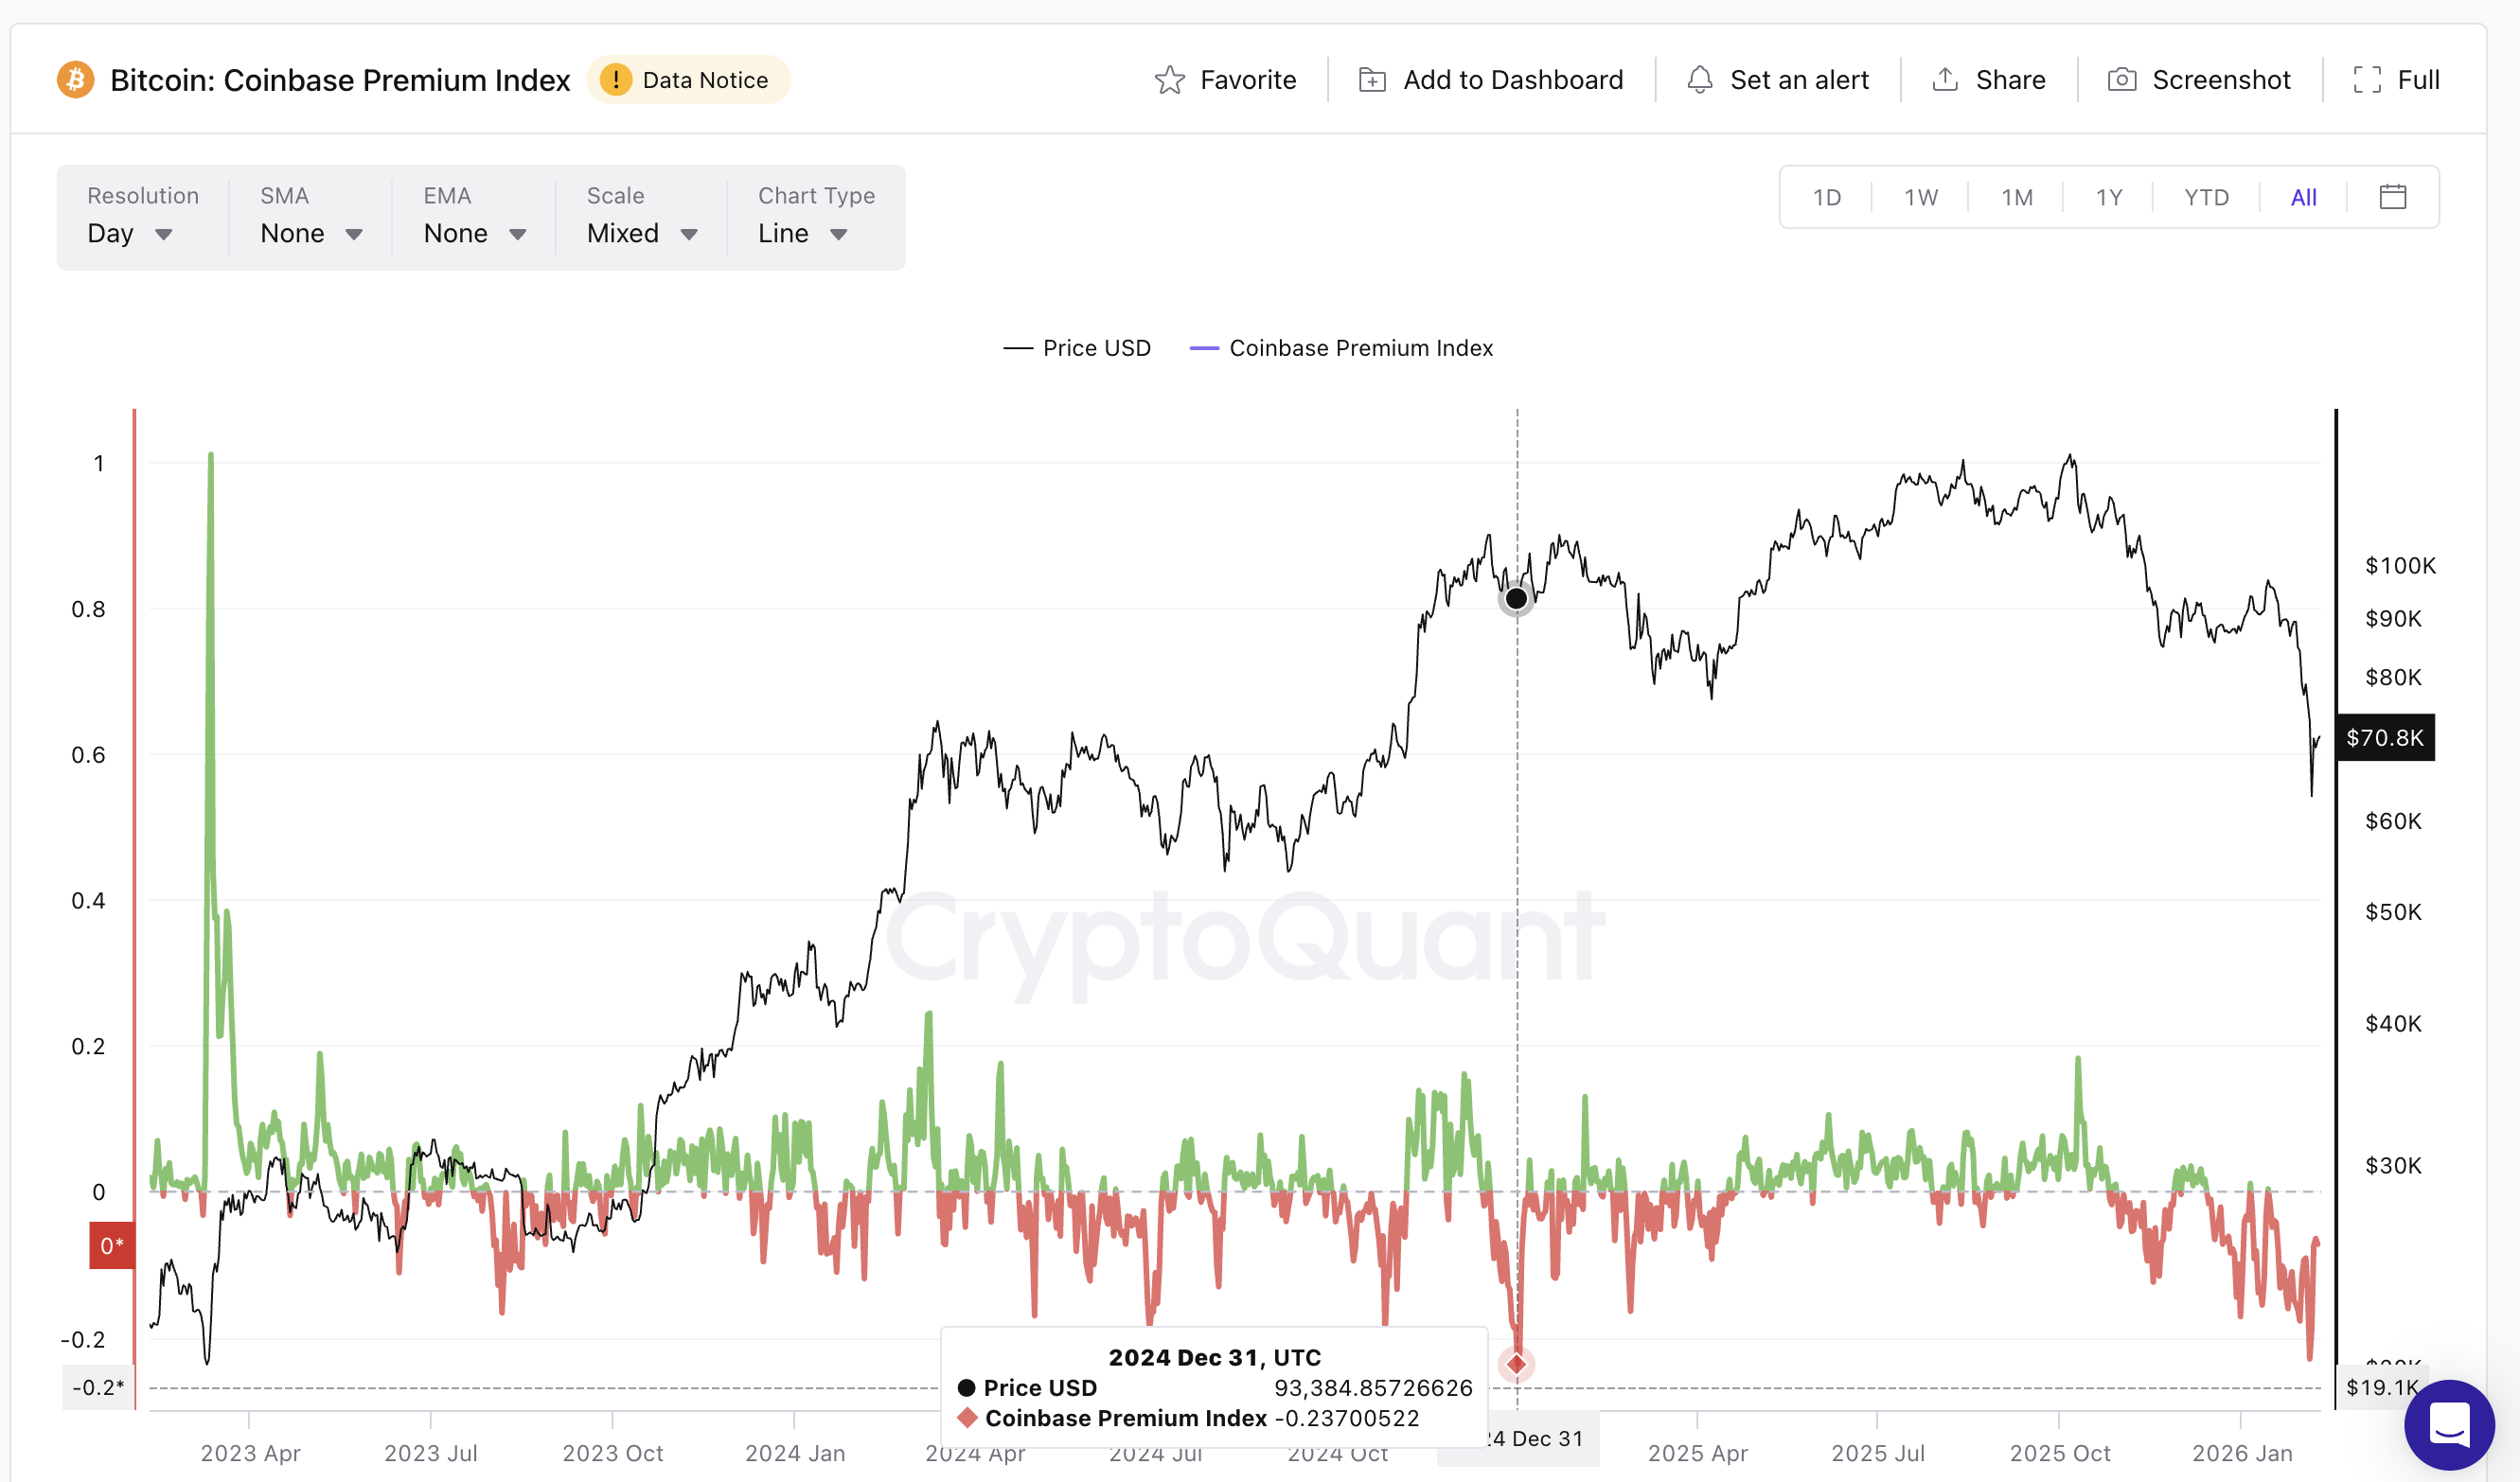
The Coinbase Premium Index tracks whether Bitcoin trades at a premium or discount on US-based Coinbase compared with global exchanges. It primarily reflects American institutional demand.
On February 4, the index fell to around -0.22, showing weak US participation. This level closely matched December 31, 2024, when the index dropped to -0.23. At that time, Bitcoin traded near $93,300.
 Coinbase Premium Index: CryptoQuant
Want more token insights like this? Sign up for Editor Harsh Notariya’s Daily Crypto Newsletter here.
Many traders believed a bottom had formed. Instead, the price later fell to about $76,200, a decline of nearly 18%.
Since early February, the index has recovered to near -0.07, signaling improving US interest and aligning with the Klinger oscillator’s rising reading. However, history shows that demand recovery often comes before price bottoms, not after. In 2024, US demand improved first. The deeper correction came later.
On-chain data adds another layer of risk.
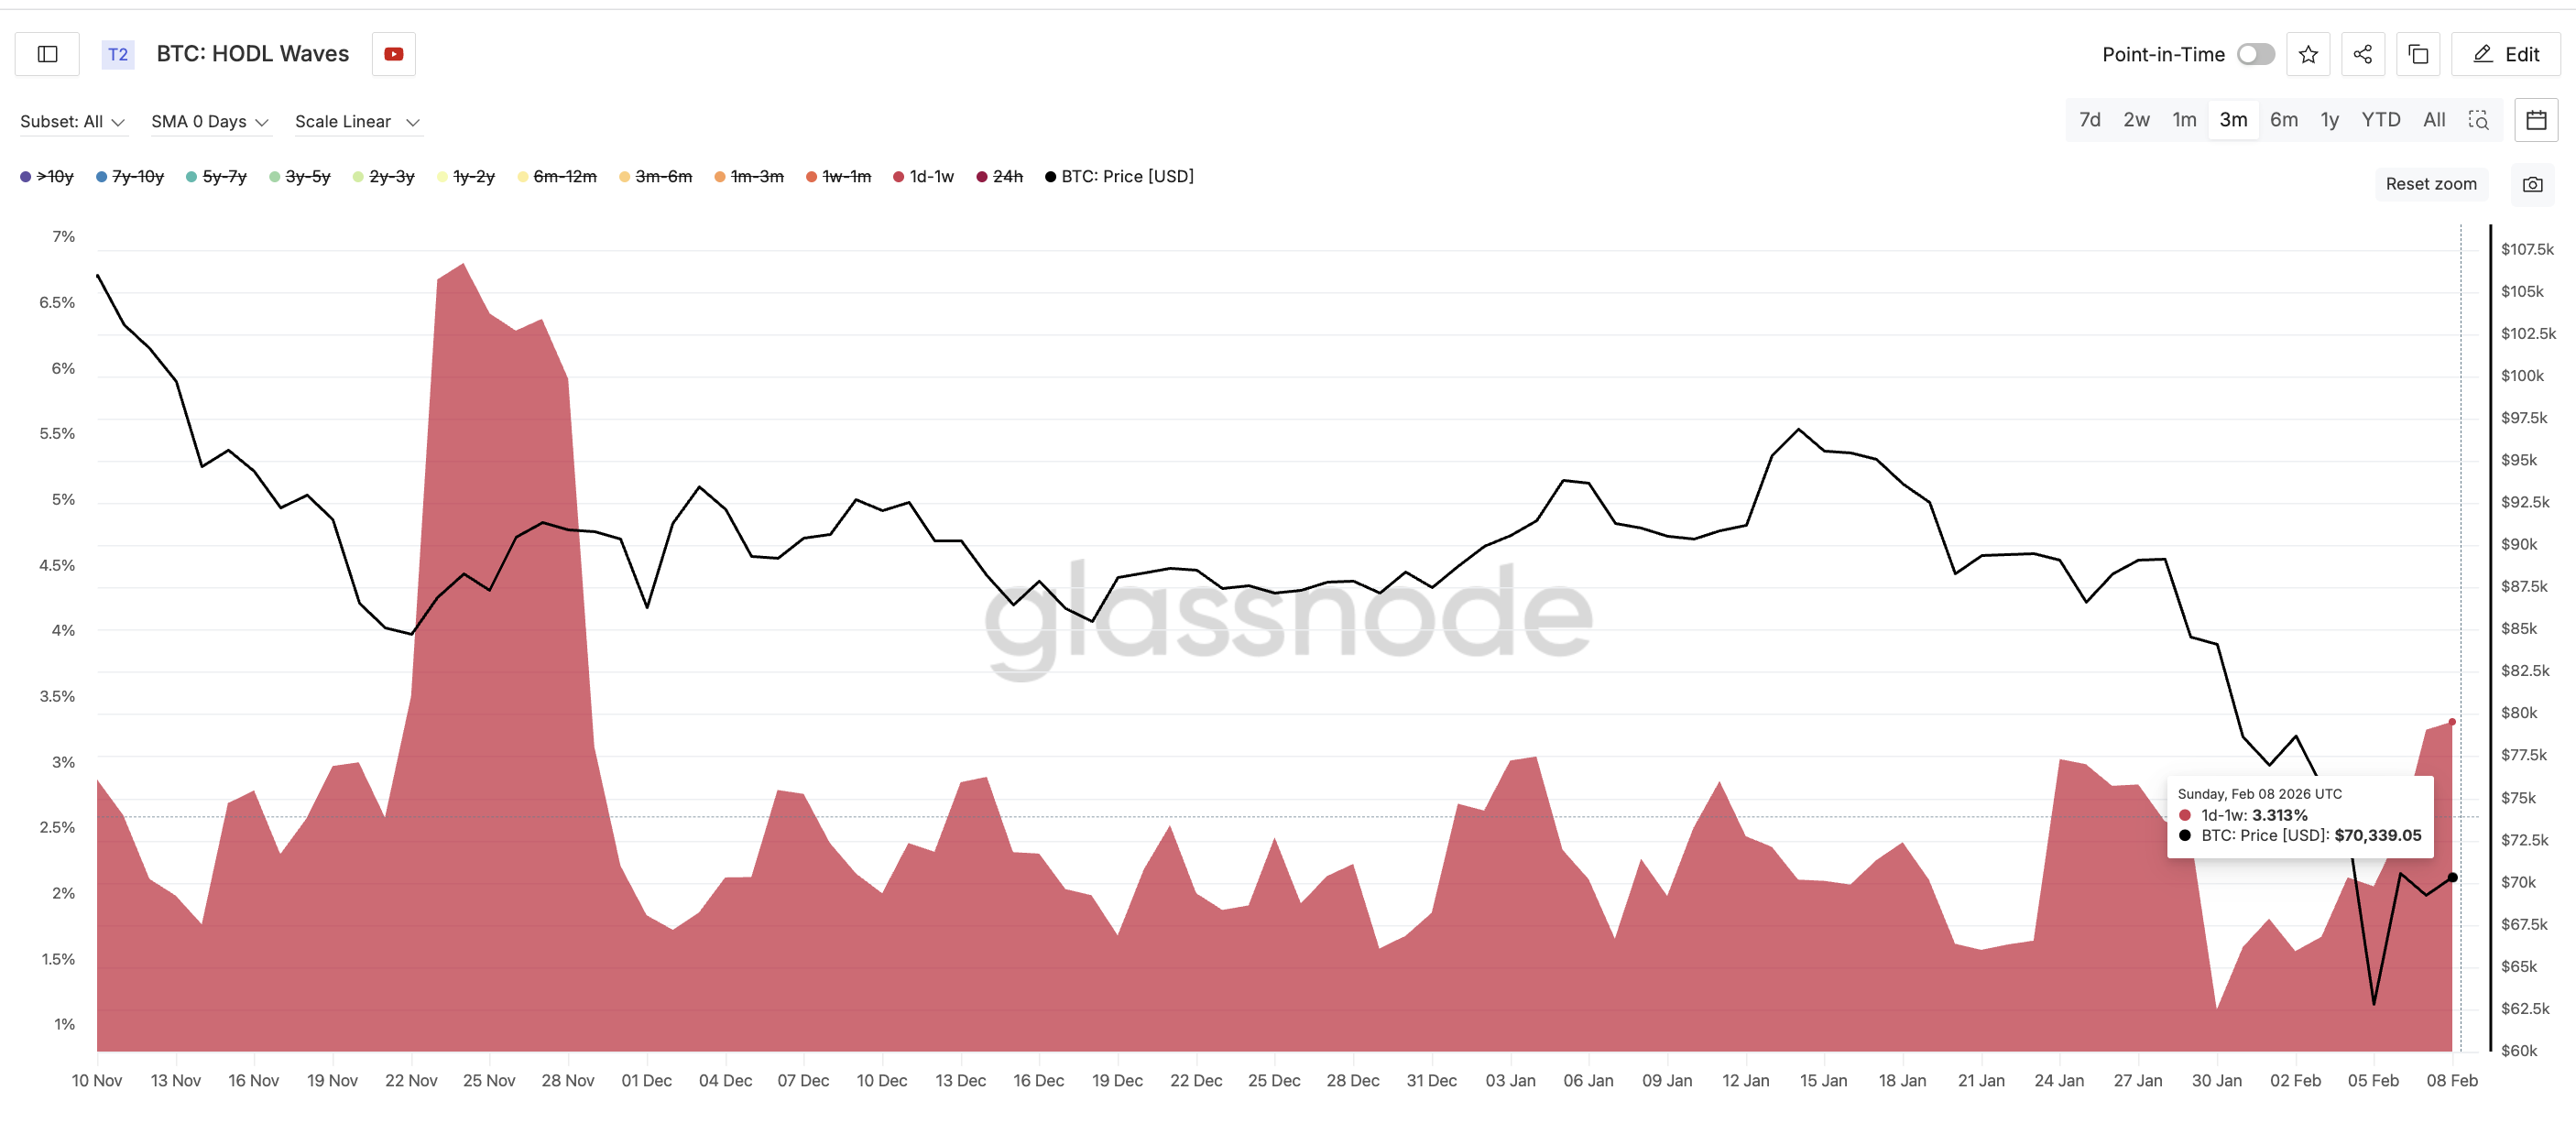
The 1-day to 1-week holder group, made up of short-term traders, increased its share of supply from about 2.05% to over 3.3% since February 5 (during the 20% rebound). That is a rise of more than 60% in just days, as highlighted by HODL Waves, a metric segregating wallets by time.
 Short-Term BTC Cohort Buying The Dip: Glassnode
This cohort tends to sell quickly when prices weaken. Their growing presence makes the market more unstable. A similar surge in short-term holders in late January was followed by a rapid 3% pullback. So far, improving US demand is being matched by rising speculation, not strong conviction.
Key Bitcoin Price Levels Show Where the Bounce Could Fail
All signals now converge around a few critical Bitcoin price zones.
The first major support sits near $67,350. A daily close below this level could restart selling pressure.
If that breaks, the next downside targets are:
- $60,130, the recent low
- $57,900 (a key Fibonacci support and a mear 18% correction zone from the current levels)
- $53,450 a major retracement zone
- $43,470, the bear flag projection
A move from current levels to $43,400 would represent a further decline of roughly 35%. On the upside, Bitcoin must reclaim $72,330 to stabilize and get out of the possible bull trap. This level capped recent rallies.
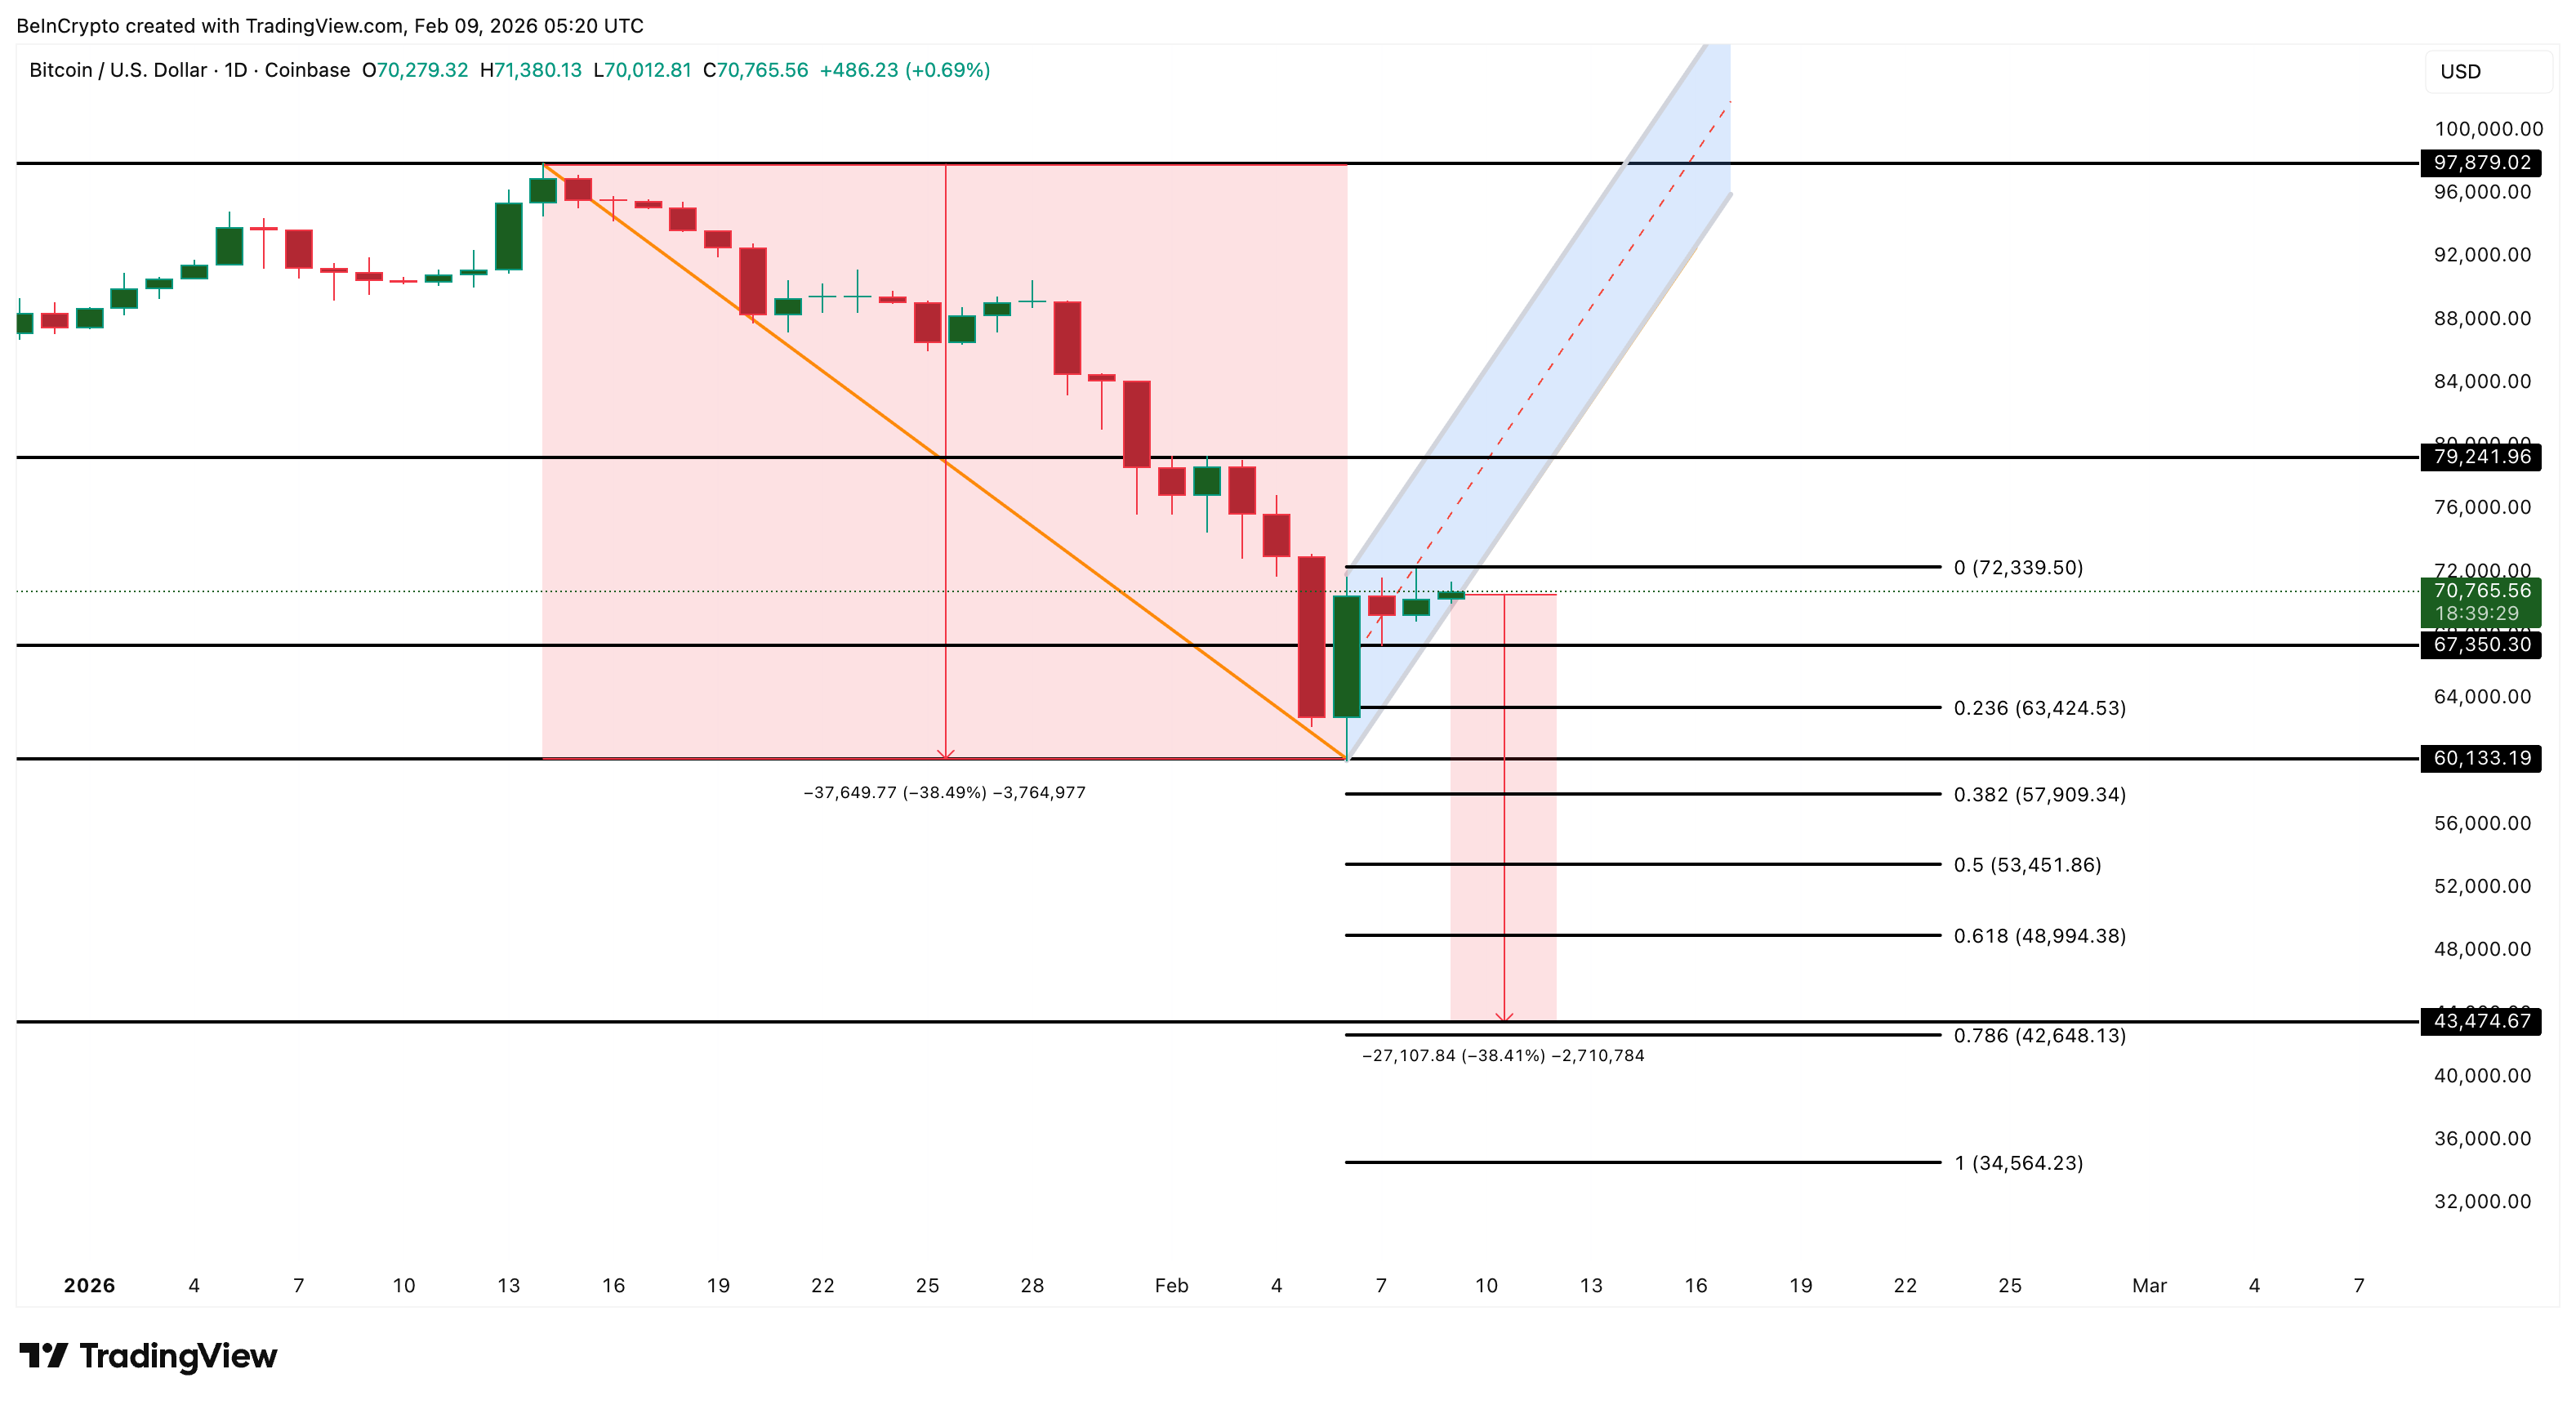 Bitcoin Price Analysis: TradingView
Above that, $79,240 remains decisive. Recovering this zone would retrace about half of the prior fall and likely invalidate the bearish structure. Only then would the path toward $97,870 reopen. Until that happens, all Bitcoin price rallies remain vulnerable.
Recommended Articles


