

Expert Says Bitcoin Price Has Topped And Is In Exponential Decay, Why This Is Not A Bad Thing

Source Newsbtc

Crypto expert Peter Brandt has boldly claimed that the Bitcoin top for this market cycle may already be in. He made this conclusion based on his “exponential decay” thesis, which he noted may actually be good for the Bitcoin ecosystem.

Why Bitcoin’s Price Has Topped

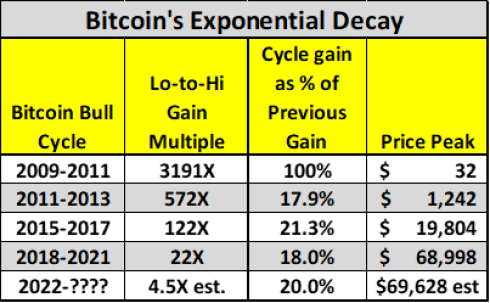
Brandt explained that historical data suggests that Bitcoin’s price has topped. He further alluded to an “exponential decay,” which he noted could be used to describe Bitcoin. Brandt’s exponential decay thesis is based on the fact that Bitcoin’s percentage gain has significantly reduced in every subsequent bull cycle. 

For context, Bitcoin, according to the crypto expert, recorded a 122x increase from its market low to market high between 2015 and 2017. However, that was only 21.3% of Bitcoin’s price gain in the previous cycle (between 2011 and 2013).
Bitcoin price

Source: X

Brandt further noted that the same thing happened between 2018 and 2021. Despite a 22x increase from its market low to market high, Bitcoin only recorded 18% of the price increase it saw in the previous cycle. Having laid this premise, the crypto expert concluded that this market cycle shouldn’t be any different as Bitcoin will likely see about 20% of the price gain recorded in the previous cycle. 

Taking $15,473 as the market low for this cycle, he noted that 20% of the previous cycle’s gain would mean that the market high for this cycle was supposed to be $72,723, a price level that Bitcoin already hit on its way to a new all-time high (ATH) of $73,750. 

Meanwhile, the crypto expert acknowledged that Bitcoin historically records its most price gains after the Bitcoin halving, which just recently occurred. However, he added that the crypto community has to deal with the fact of the exponential decay, which has made him believe there is a 25% chance that Bitcoin has already topped this cycle.”

Why The Exponential Decay Might Be Bullish For Bitcoin

Brandt mentioned that Bitcoin would likely drop to the mid $30,000 or its 2021 lows if it has indeed topped. He, however, added that this decline could be the “most bullish thing that could happen from a long-term view.”

Related Reading: Brace For Price Impact: Dogecoin Whales Move Massive 456 Million DOGE To Exchanges

From a “classical charting point of view,” the crypto expert hinted that Bitcoin was still primed for major parabolic moves to the upside, even though it doesn’t happen now. 

He also shared an example of what Bitcoin’s chart could look like when this move happens with the crypto token rallying above $100,000. Brandt also alluded to Gold’s chart from August 2020 to March 2024 as an example of what Bitcoin’s price action could look like soon enough. Interestingly, he recently predicted that Bitcoin will soon be “King over Gold.”

Bitcoin price chart from Tradingview.com

Disclaimer: For information purposes only. Past performance is not indicative of future results.
placeholder
Gold Price Forecast: PPI and Oil Prices Fuel Inflation Concerns, Can CPI Change Gold's Direction?As of the Asian session on September 11, gold prices (XAUUSD) remained in weak consolidation today after dropping sharply to near $4,300 on Thursday, with the latest price trading around
Author  TradingKey
Sep 11, Fri
As of the Asian session on September 11, gold prices (XAUUSD) remained in weak consolidation today after dropping sharply to near $4,300 on Thursday, with the latest price trading around
placeholder
US August CPI lands tonight: after a 5.4% PPI shock, will the Fed hike on September 16?US August PPI came in at 5.4% year-on-year, above the 5.3% consensus, with core PPI at 4.6%. Traders have pushed the odds of a 25bp Fed hike on September 15-16 to around 70%. Tonight's CPI is the last major inflation print before the decision — here is the full calendar, the consensus numbers, and what a hot versus cool reading would mean for the dollar, yields, gold and stocks.
Author  Irene Q.
Sep 11, Fri
US August PPI came in at 5.4% year-on-year, above the 5.3% consensus, with core PPI at 4.6%. Traders have pushed the odds of a 25bp Fed hike on September 15-16 to around 70%. Tonight's CPI is the last major inflation print before the decision — here is the full calendar, the consensus numbers, and what a hot versus cool reading would mean for the dollar, yields, gold and stocks.
placeholder
US-Iran Conflict Drives Oil Surge as WTI Tops $100 and Brent Nears $110International oil prices continued to advance rapidly this week. On Thursday Eastern Time, WTI crude (USOIL) broke through the $100/barrel mark, closing at $103.94, up 7.51%; Brent crude
Author  TradingKey
Sep 11, Fri
International oil prices continued to advance rapidly this week. On Thursday Eastern Time, WTI crude (USOIL) broke through the $100/barrel mark, closing at $103.94, up 7.51%; Brent crude
placeholder
TradingKey Daily Market Briefing: WTI Oil Tops $100, US Stocks Fall for 4th Day, Apple Bucks Trend, CPI AheadTracking Market TrendsTradingKey - On September 10 Eastern Time, the three major US stock indices fell for the fourth consecutive trading day. US August PPI showed upstream price pressures continued t
Author  TradingKey
Sep 11, Fri
Tracking Market TrendsTradingKey - On September 10 Eastern Time, the three major US stock indices fell for the fourth consecutive trading day. US August PPI showed upstream price pressures continued t
placeholder
US August CPI Preview: Will Inflation Reaccelerate? US Stocks, Dollar and Gold Face Key Test On Friday, September 11 (ET), the U.S. Bureau of Labor Statistics will release the Consumer Price Index (CPI) for August, the final major inflation report before the Federal Reserve's Sep
Author  TradingKey
Sep 10, Thu
On Friday, September 11 (ET), the U.S. Bureau of Labor Statistics will release the Consumer Price Index (CPI) for August, the final major inflation report before the Federal Reserve's Sep
goTop
quote