


Zcash Loses 70% of Trading Activity in Three Weeks as $200 Slide Accelerates
Zcash price is sinking deeper into bearish territory as both price and trading activity continue to weaken. The privacy-focused token is down nearly 5% over the past 24 hours and has now fallen more than 44% over the past month.
Zcash still shows year-on-year gains of nearly 700%. Today, that rally feels distant. Selling pressure is building, trader interest is fading, and price is steadily moving toward its next major downside target near $200. With momentum weakening across multiple indicators, the market is now questioning whether a deeper decline is becoming unavoidable.
Head-and-Shoulders Breakdown and Volume Crash Put Zcash’s $200 Target in Focus
Zcash’s current decline began with a clear technical breakdown in late January. On January 31, the token completed a head-and-shoulders pattern, a classic bearish formation that often signals trend reversals. Since then, the ZEC price has consistently respected the breakdown structure.
Want more token insights like this? Sign up for Editor Harsh Notariya’s Daily Crypto Newsletter here.
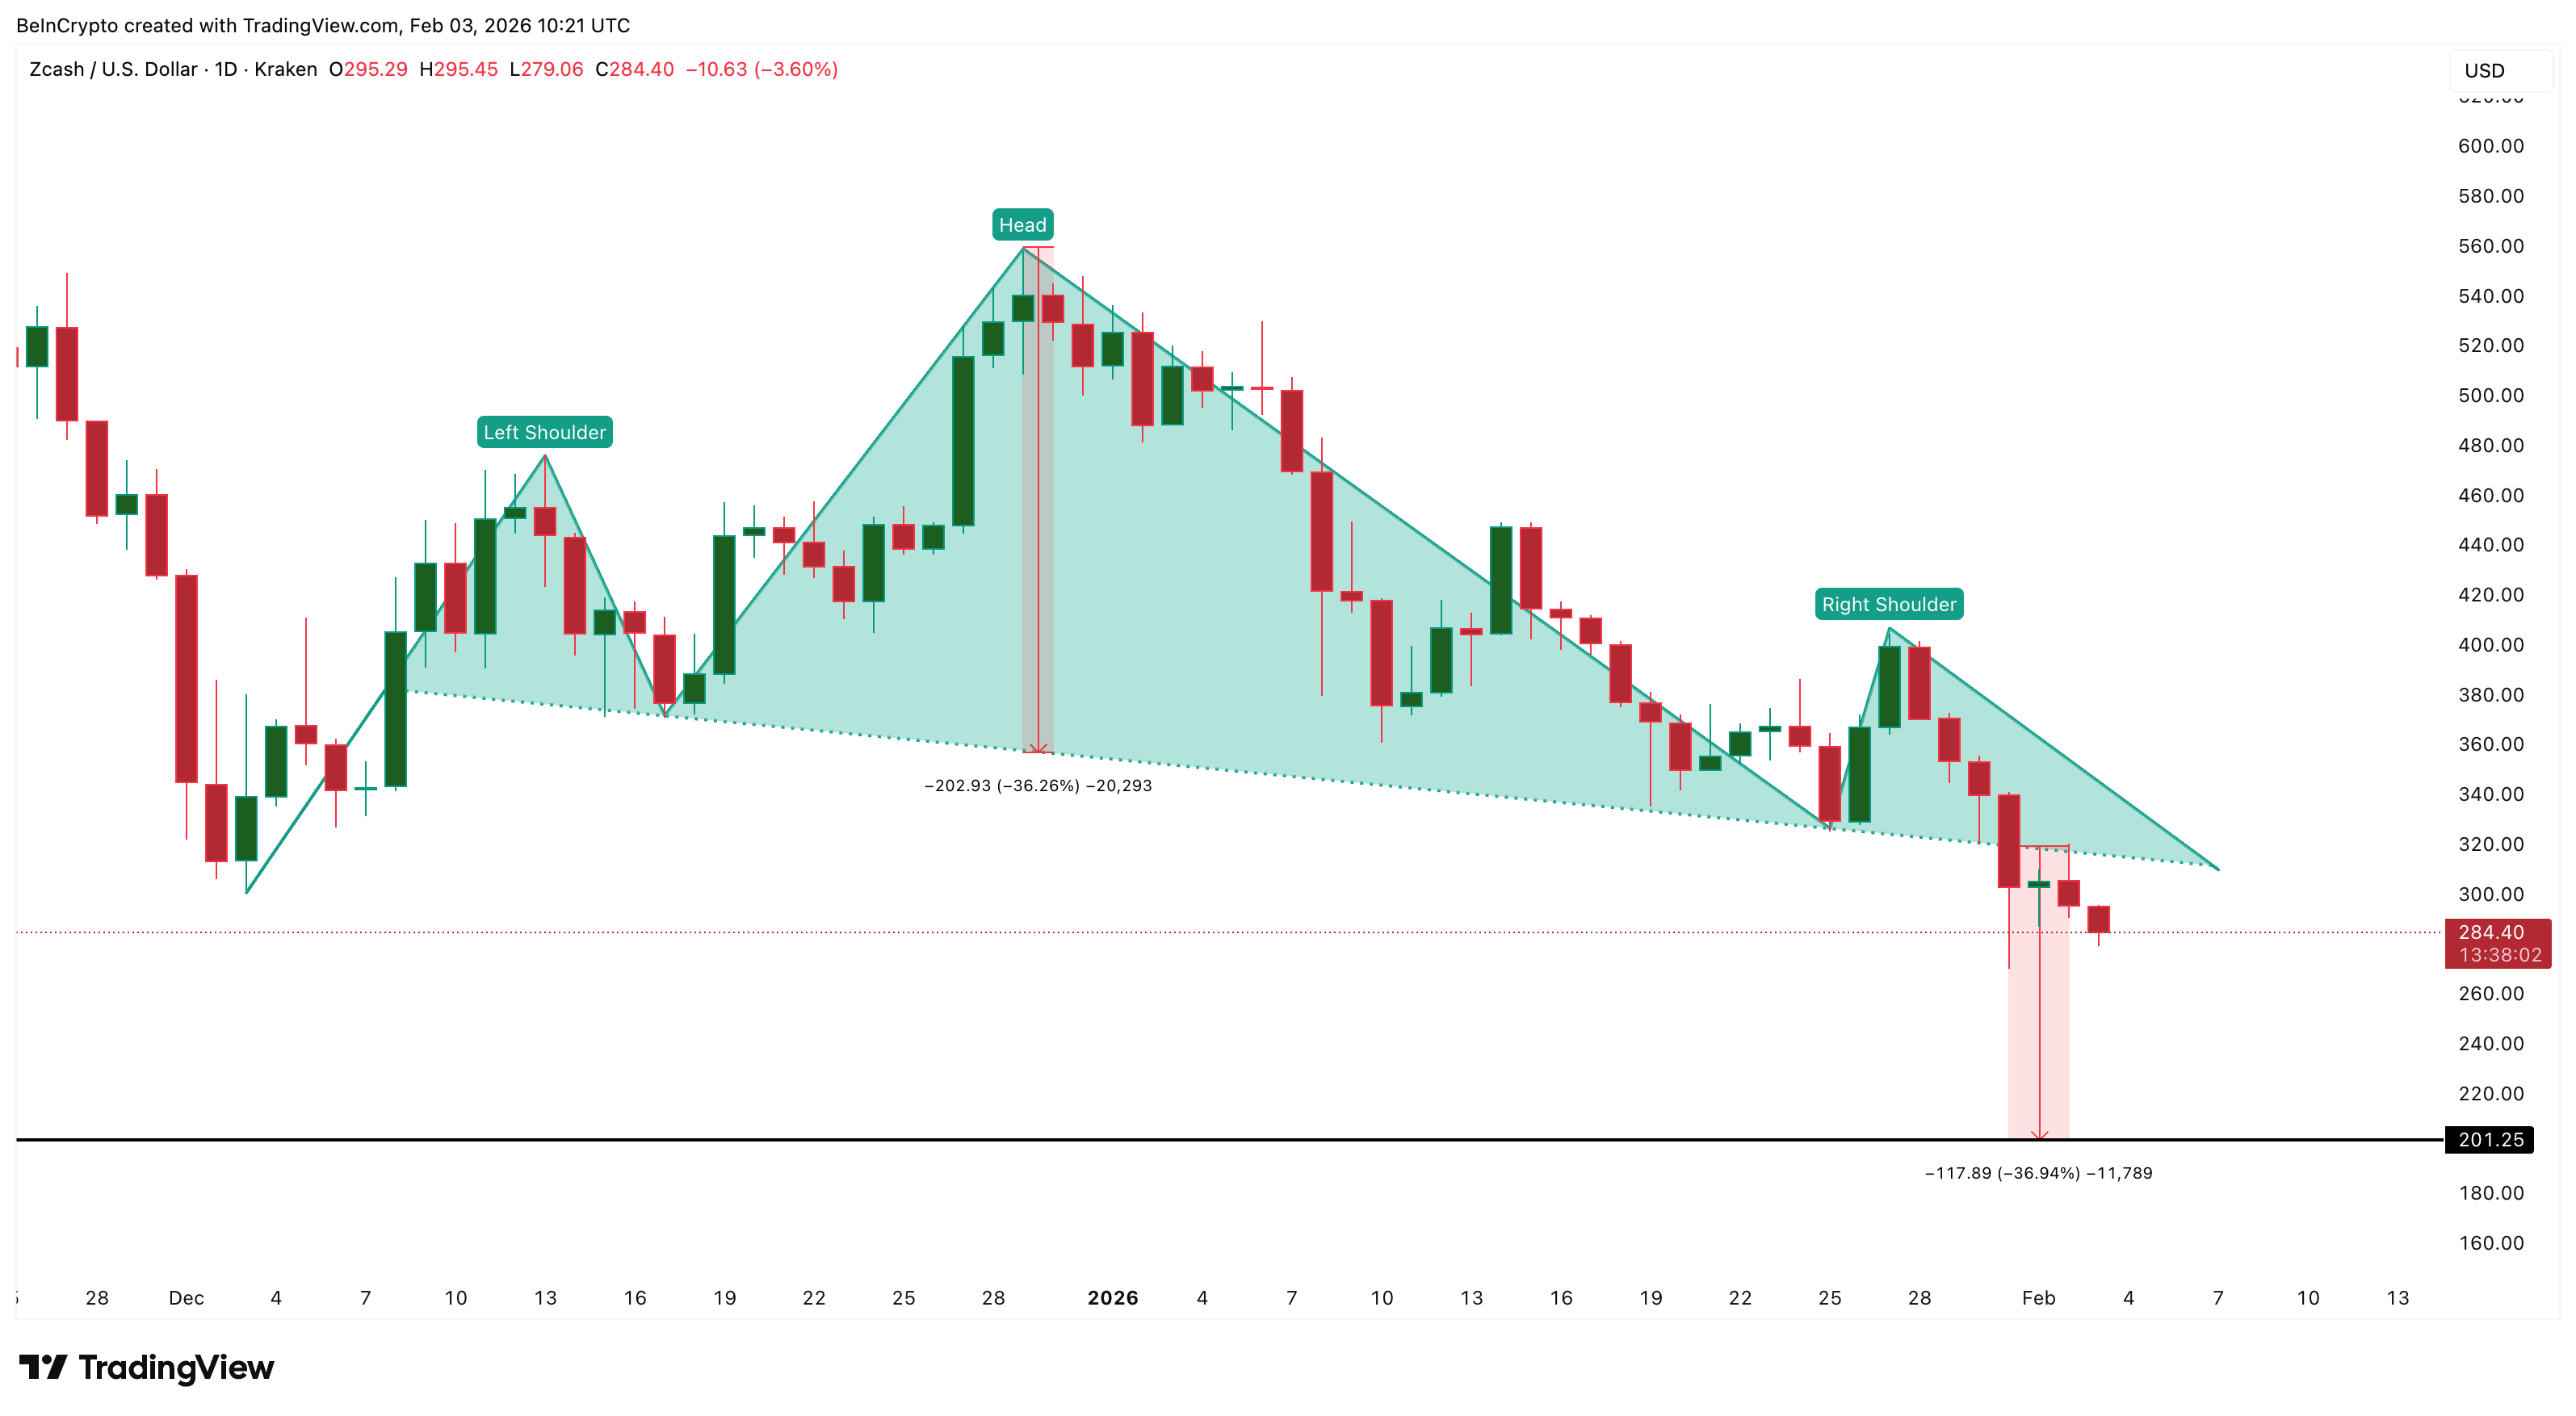 ZEC Price Structure: TradingView
At the same time, trading activity has collapsed. Dune data shows that Zcash’s total centralized exchange volume peaked on January 9. On that day, the combined daily volume crossed $1.5 billion. By February 2, daily volume had dropped to around $450 million. This represents a decline of roughly 70% in just three weeks.
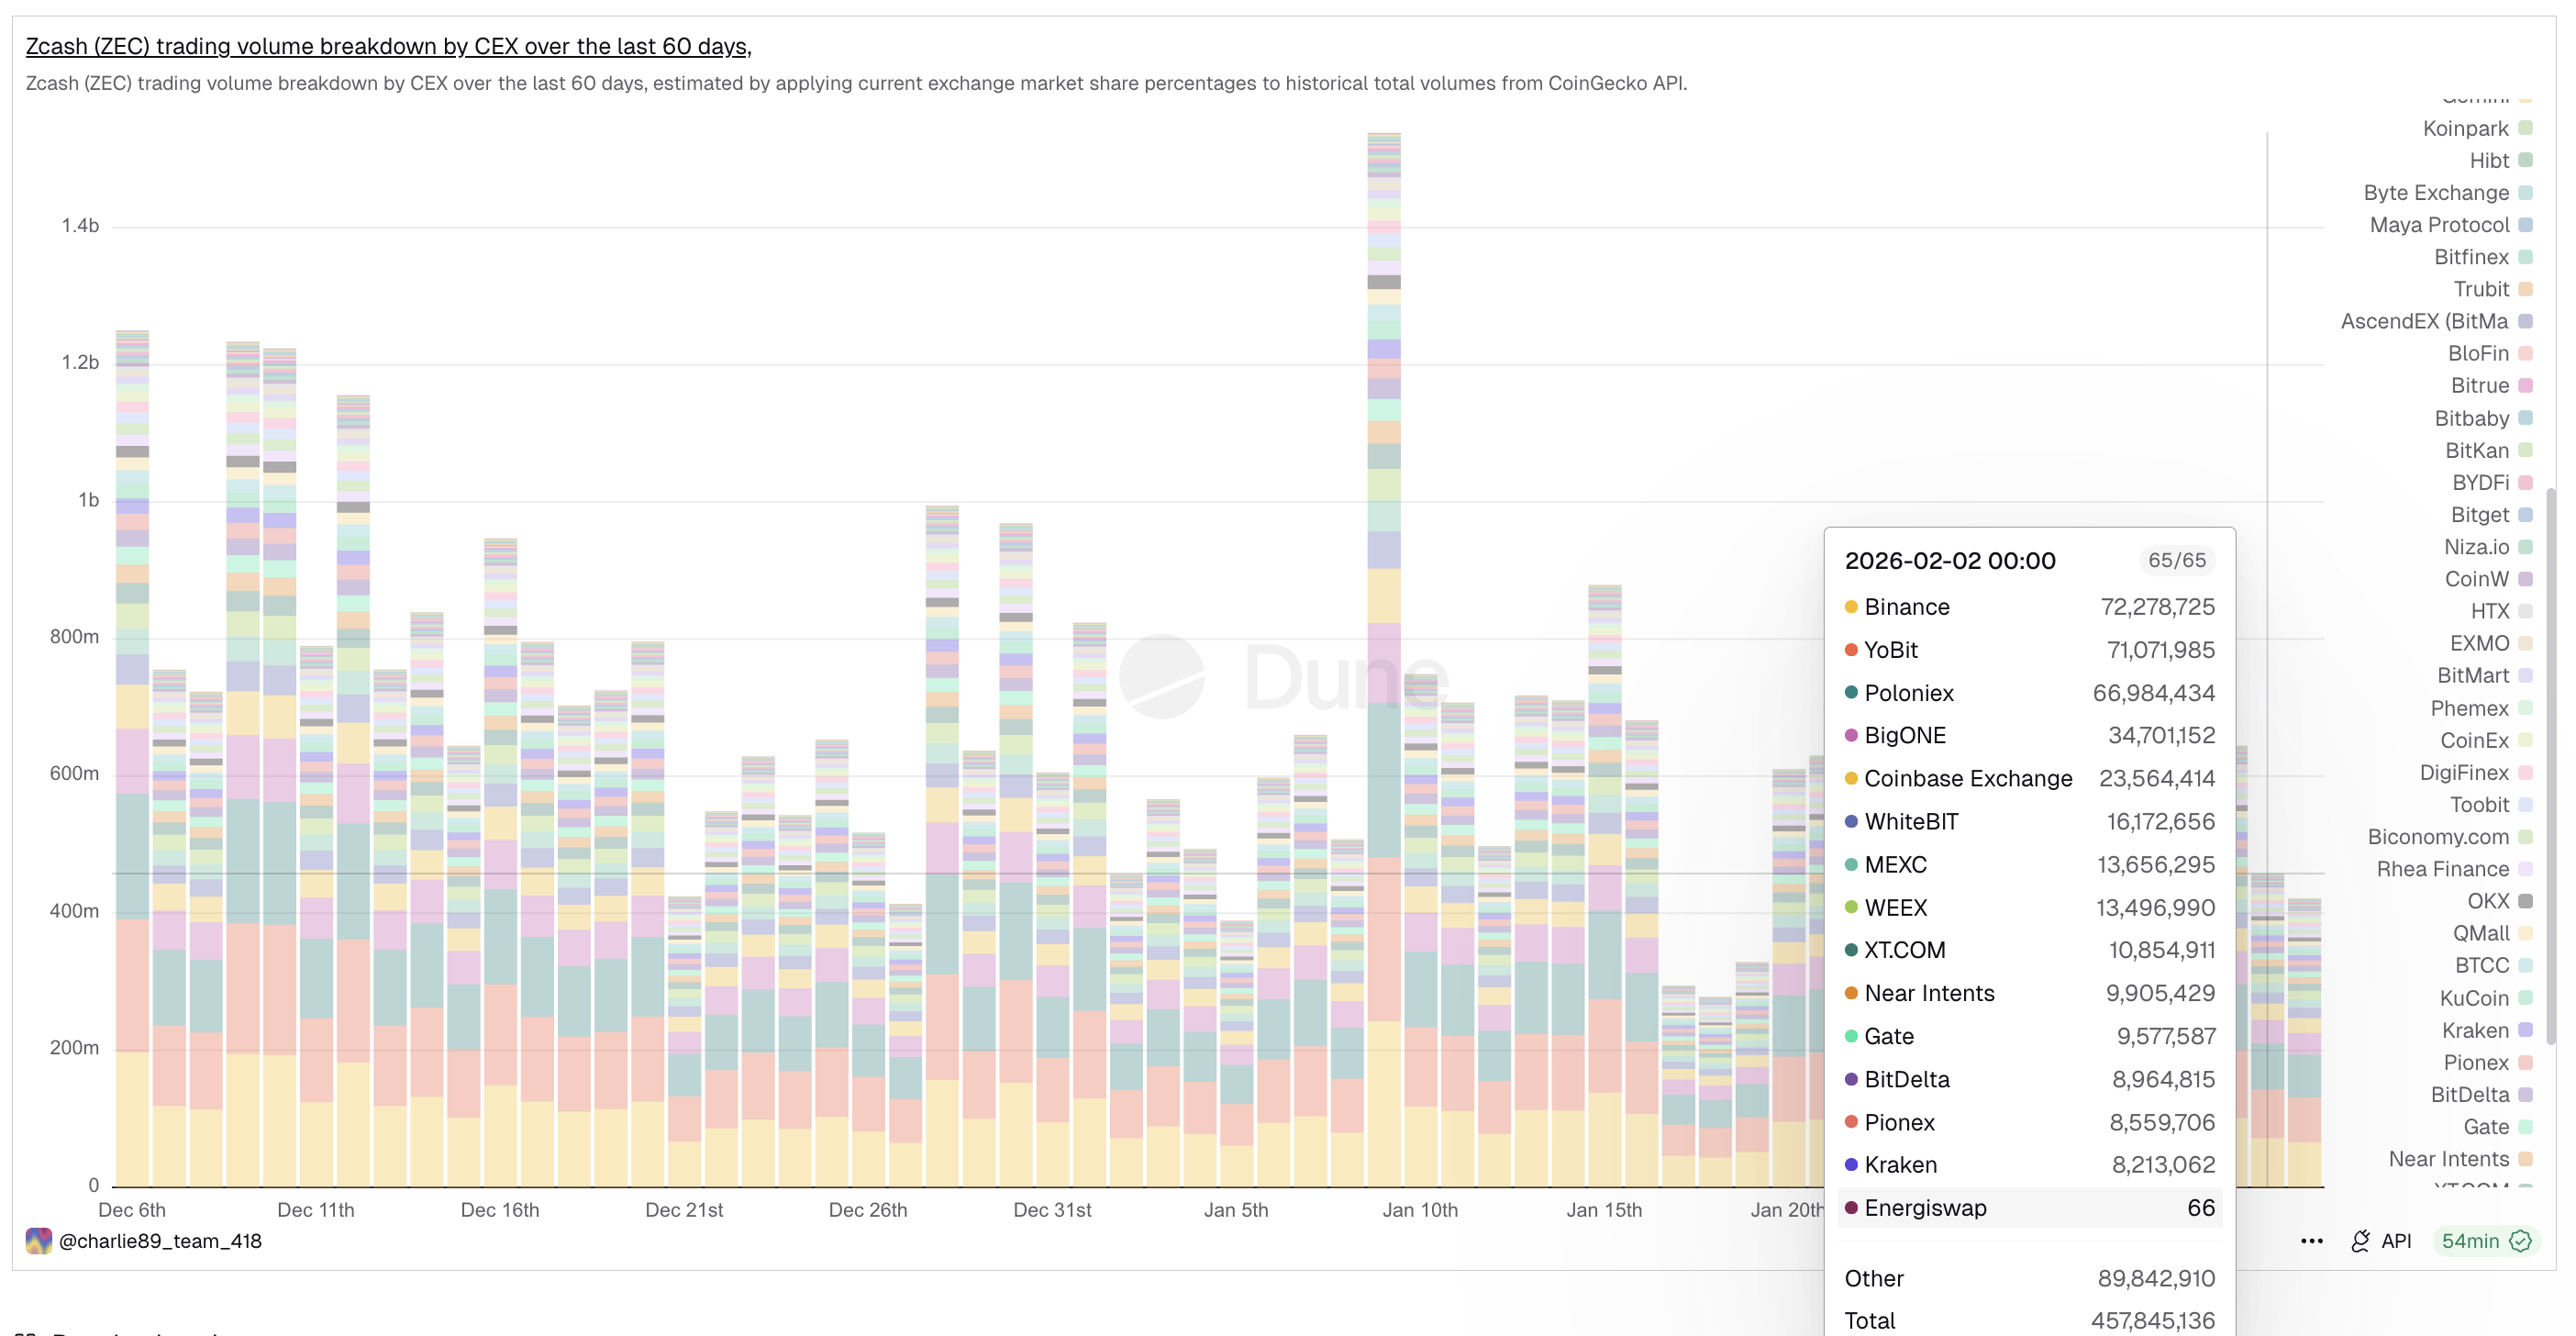 Zcash Trading Volume Dips: Dune
Such a sharp fall in activity signals fading trader interest. Fewer participants mean weaker liquidity and less support during sell-offs. In practice, this makes price declines easier to sustain.
Capital Flows Turn Negative as Whale Selling Overwhelms Smart Money Buying
Capital flow indicators confirm that selling pressure remains dominant. The Chaikin Money Flow (CMF), which tracks whether money is entering or leaving an asset using price and volume, has been trending lower since late December.
CMF peaked around December 27, when Zcash was forming the “head” of its pattern. Since then, it has failed to break above its downward trendline. In early February, CMF finally slipped below the zero line, signaling that outflows are now outweighing inflows.
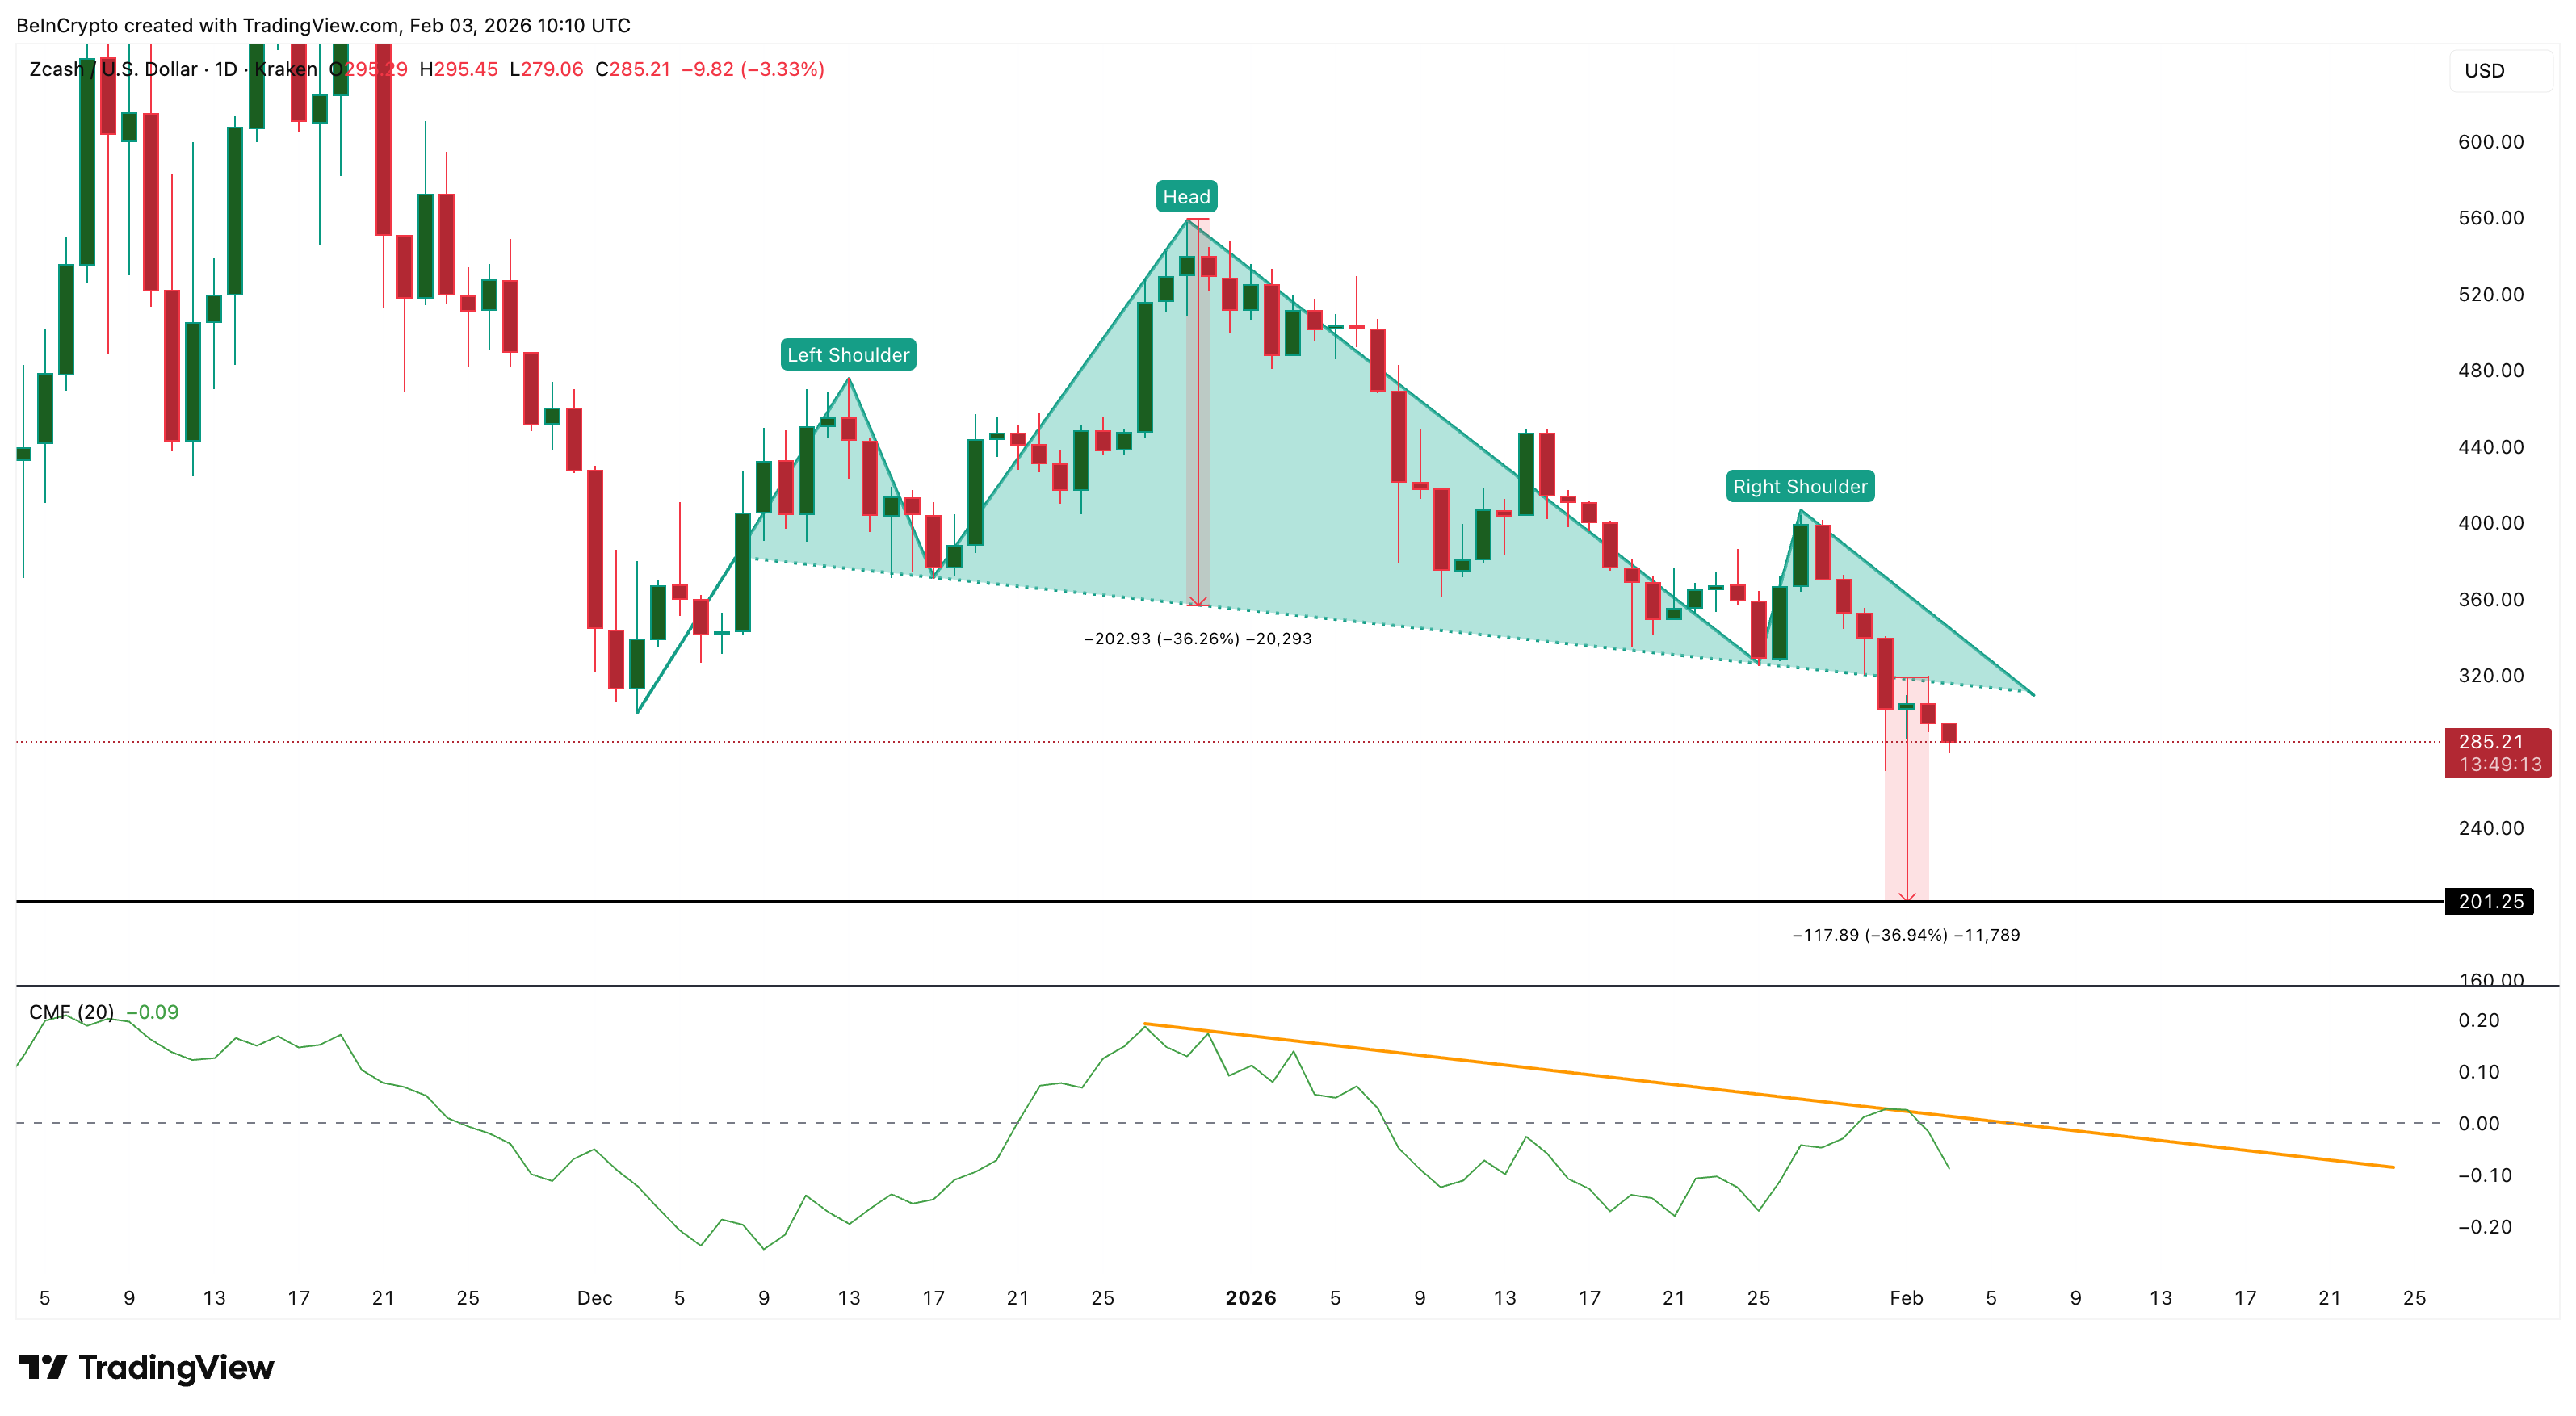 Capital Flows Weaken: TradingView
In other words, more capital is leaving Zcash than entering it.
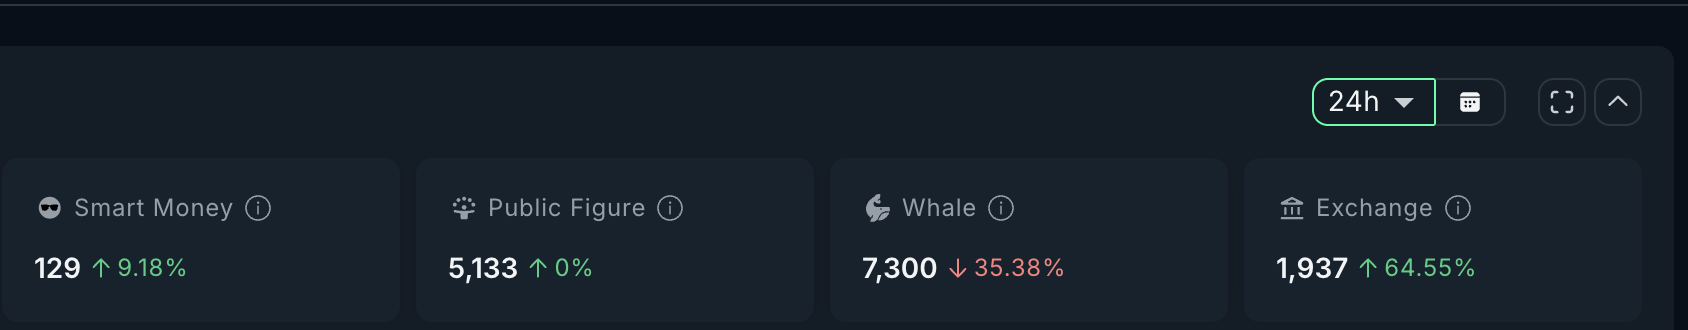
Exchange data and whale positioning reinforce this view. Over the past 24 hours, Zcash exchange reserves have surged by more than 64%.
Rising reserves usually mean that holders are moving coins to exchanges in preparation to sell. Additionally, large holders have reduced exposure by more than 35% in recent sessions. This aligns with the declining CMF and points to increasing supply pressure.
 Key Zcash Holders: Nansen
Against this backdrop, only one data point offers limited optimism. “Smart money” wallets increased their Zcash holdings by around 9% over the past 24 hours. While these traders are often well-timed, their activity remains small compared with the broader outflows.
For now, selective accumulation is being overwhelmed by widespread selling.
Zcash Price Action Shows Why Smart Money’s Bet Still Looks Risky
The Zcash price structure reflects this imbalance clearly. Zcash has now broken below the $289 support zone.
The next meaningful support sits near $262. Below that, the primary technical target from the head-and-shoulders pattern lies around $200. From current levels near $284, this implies a potential downside of nearly 30%.
So far, price action shows little sign of stabilizing.
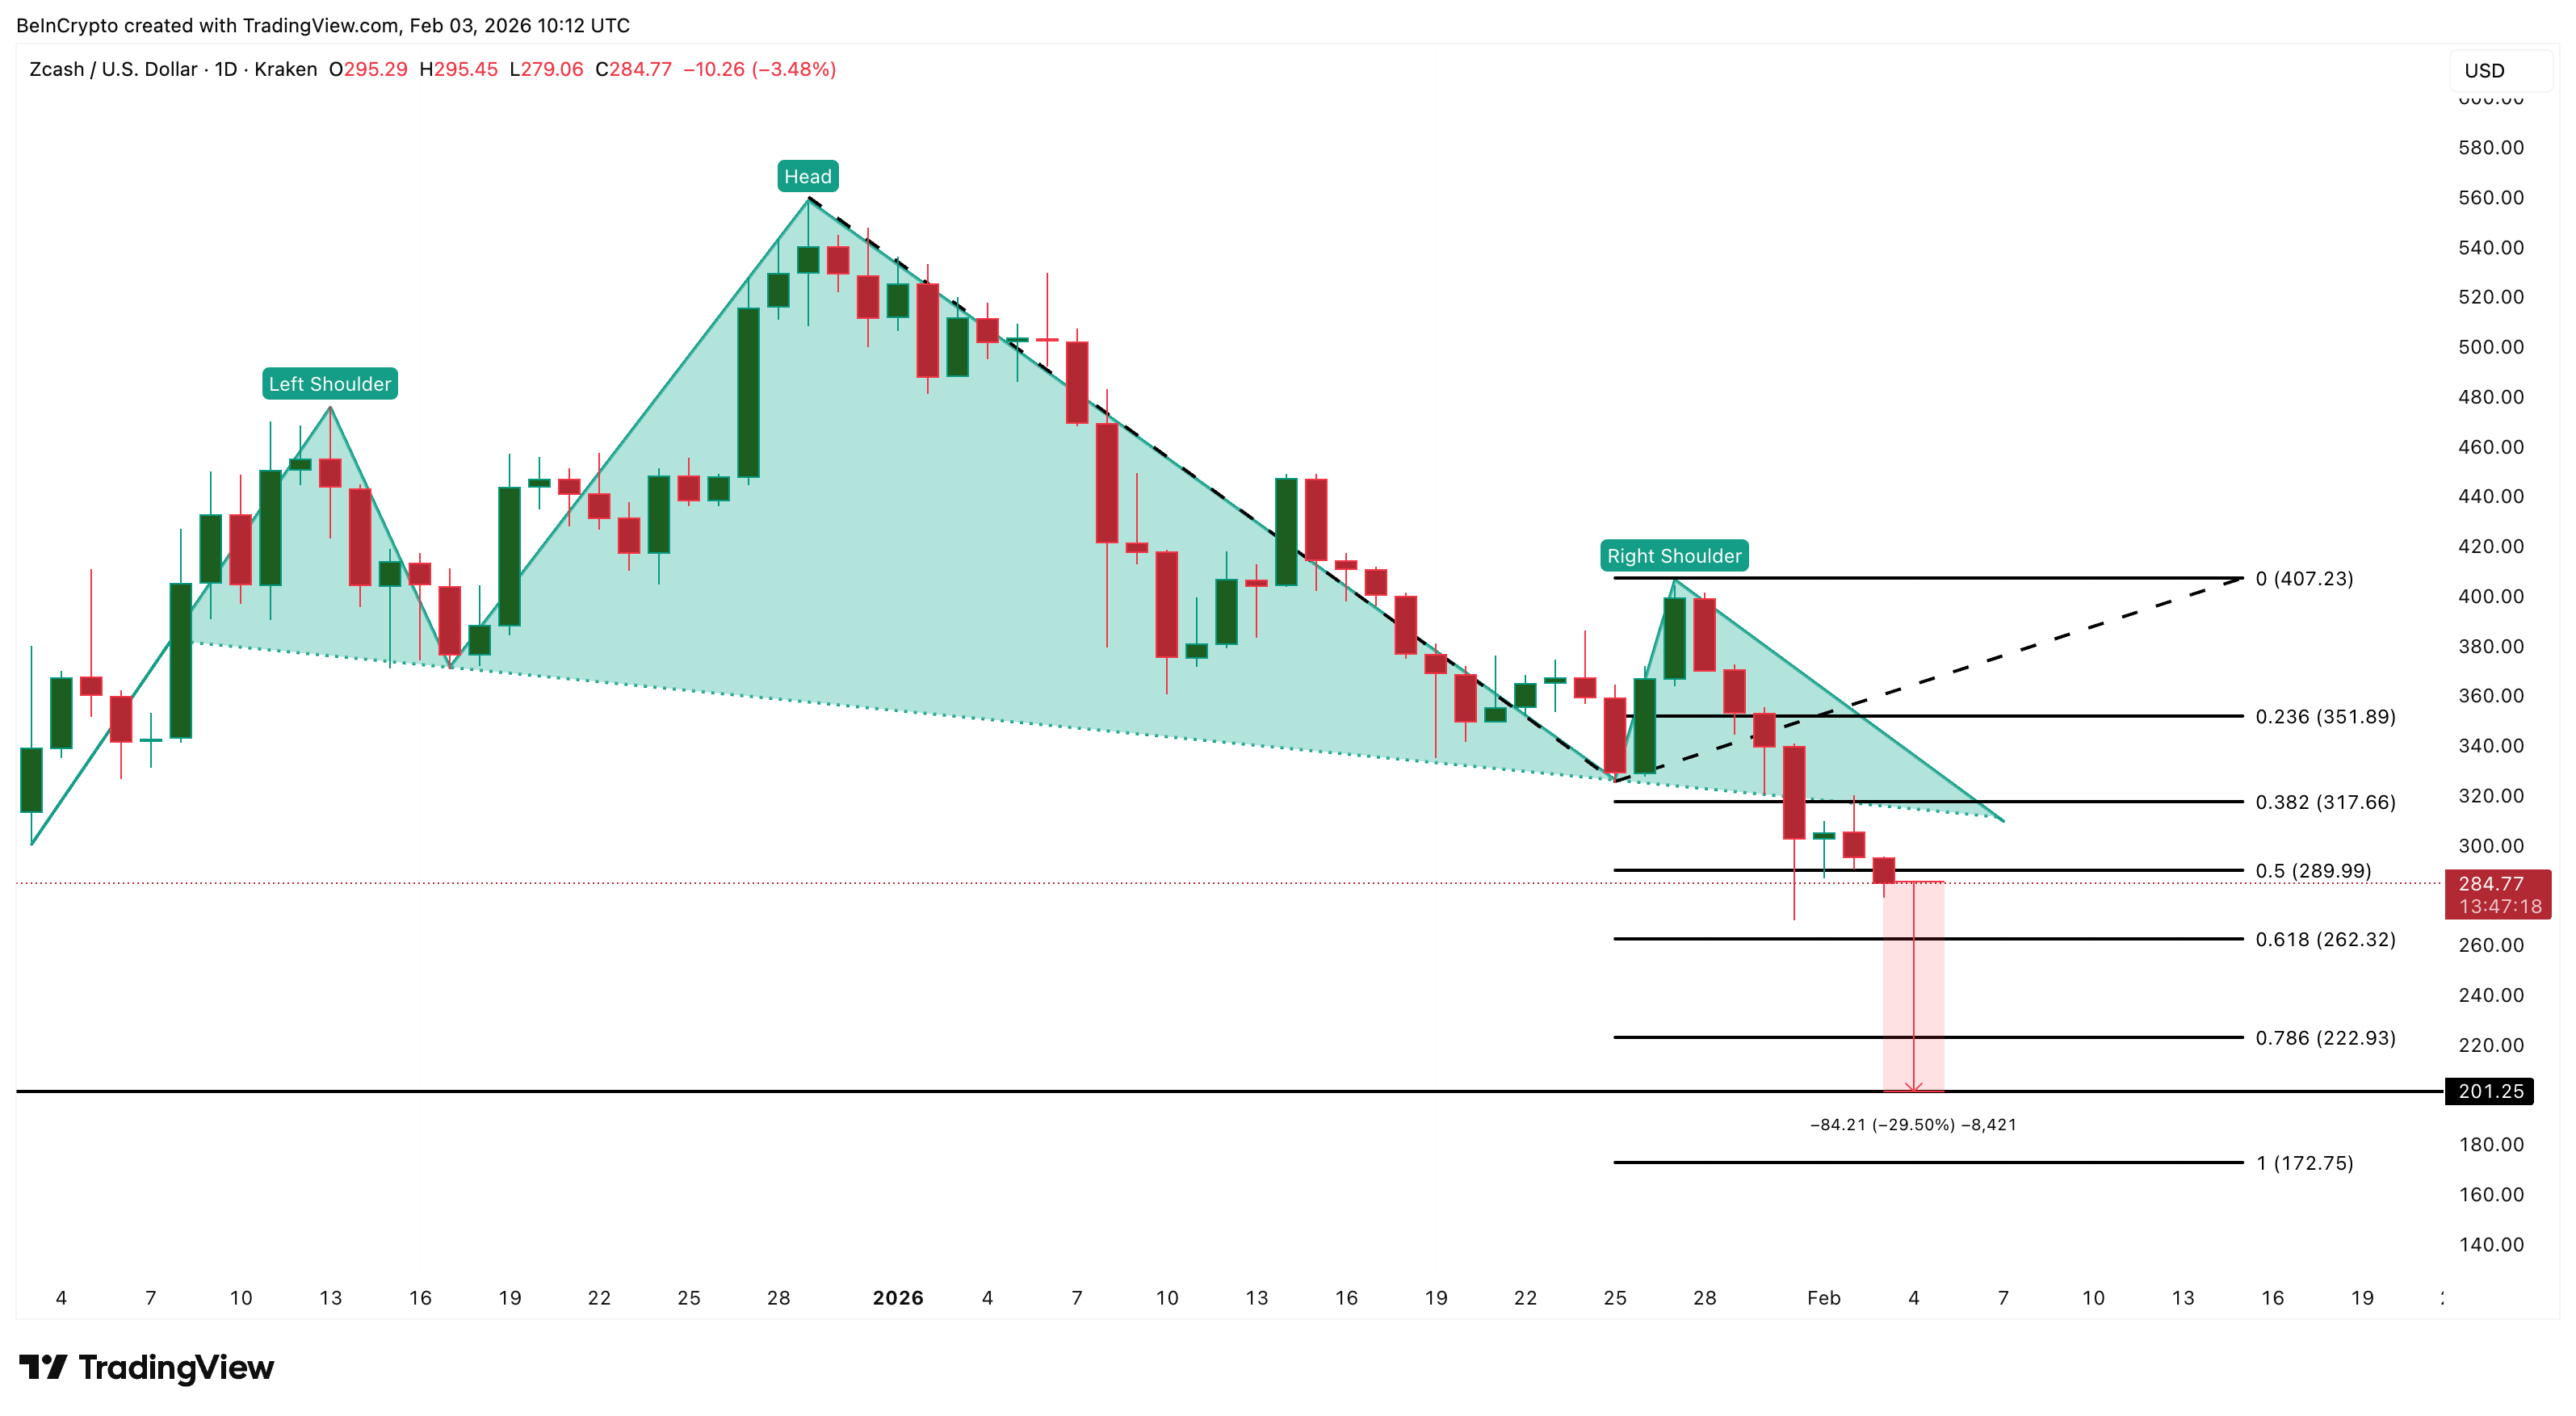 Zcash Price Analysis: TradingView
If smart money accumulation leads to a short-term bounce, Zcash would first need to reclaim $289 cleanly. A move above this level could open a path toward $317, which aligns with Fibonacci resistance and prior consolidation zones. However, even such a rebound would likely remain corrective rather than structural.
In many cases, rallies inside confirmed downtrends serve mainly to flush out short positions before declines resume. Without strong volume and capital inflows, these moves tend to fade. For the broader bearish structure to weaken meaningfully, Zcash would need to reclaim the $407 area near the right shoulder of the pattern. Until that happens, the head-and-shoulders formation remains intact.
Recommended Articles


