


The Real Story Behind Bitcoin’s 10% Crash — Why Liquidations Came Later
Bitcoin price fell more than 10% from its late-January highs, briefly dropping below $81,000 before stabilizing above $82,300. In just 24 hours, the market recorded over $1.7 billion in liquidations, with Bitcoin accounting for nearly $800 million in long liquidations. BTC price is still down over 6%, day-on-day.
Most traders blamed leverage. But the data shows that derivatives did not start this crash. They only accelerated it. The real breakdown began earlier, near a critical on-chain and structural zone.
Heavy Volume, Broken Support, and the $84,600 Trap
The first warning came from the daily chart. Bitcoin printed its largest red volume candle since early December. A red volume candle means aggressive selling pressure, where sellers overpower buyers.
The last time volume reached this level, in early December, Bitcoin dropped nearly 9%.
Back then, buyers stepped in immediately. This time, they did not. Instead, the BTC price slipped below $84,600, a key support level, and continued falling toward $81,000.
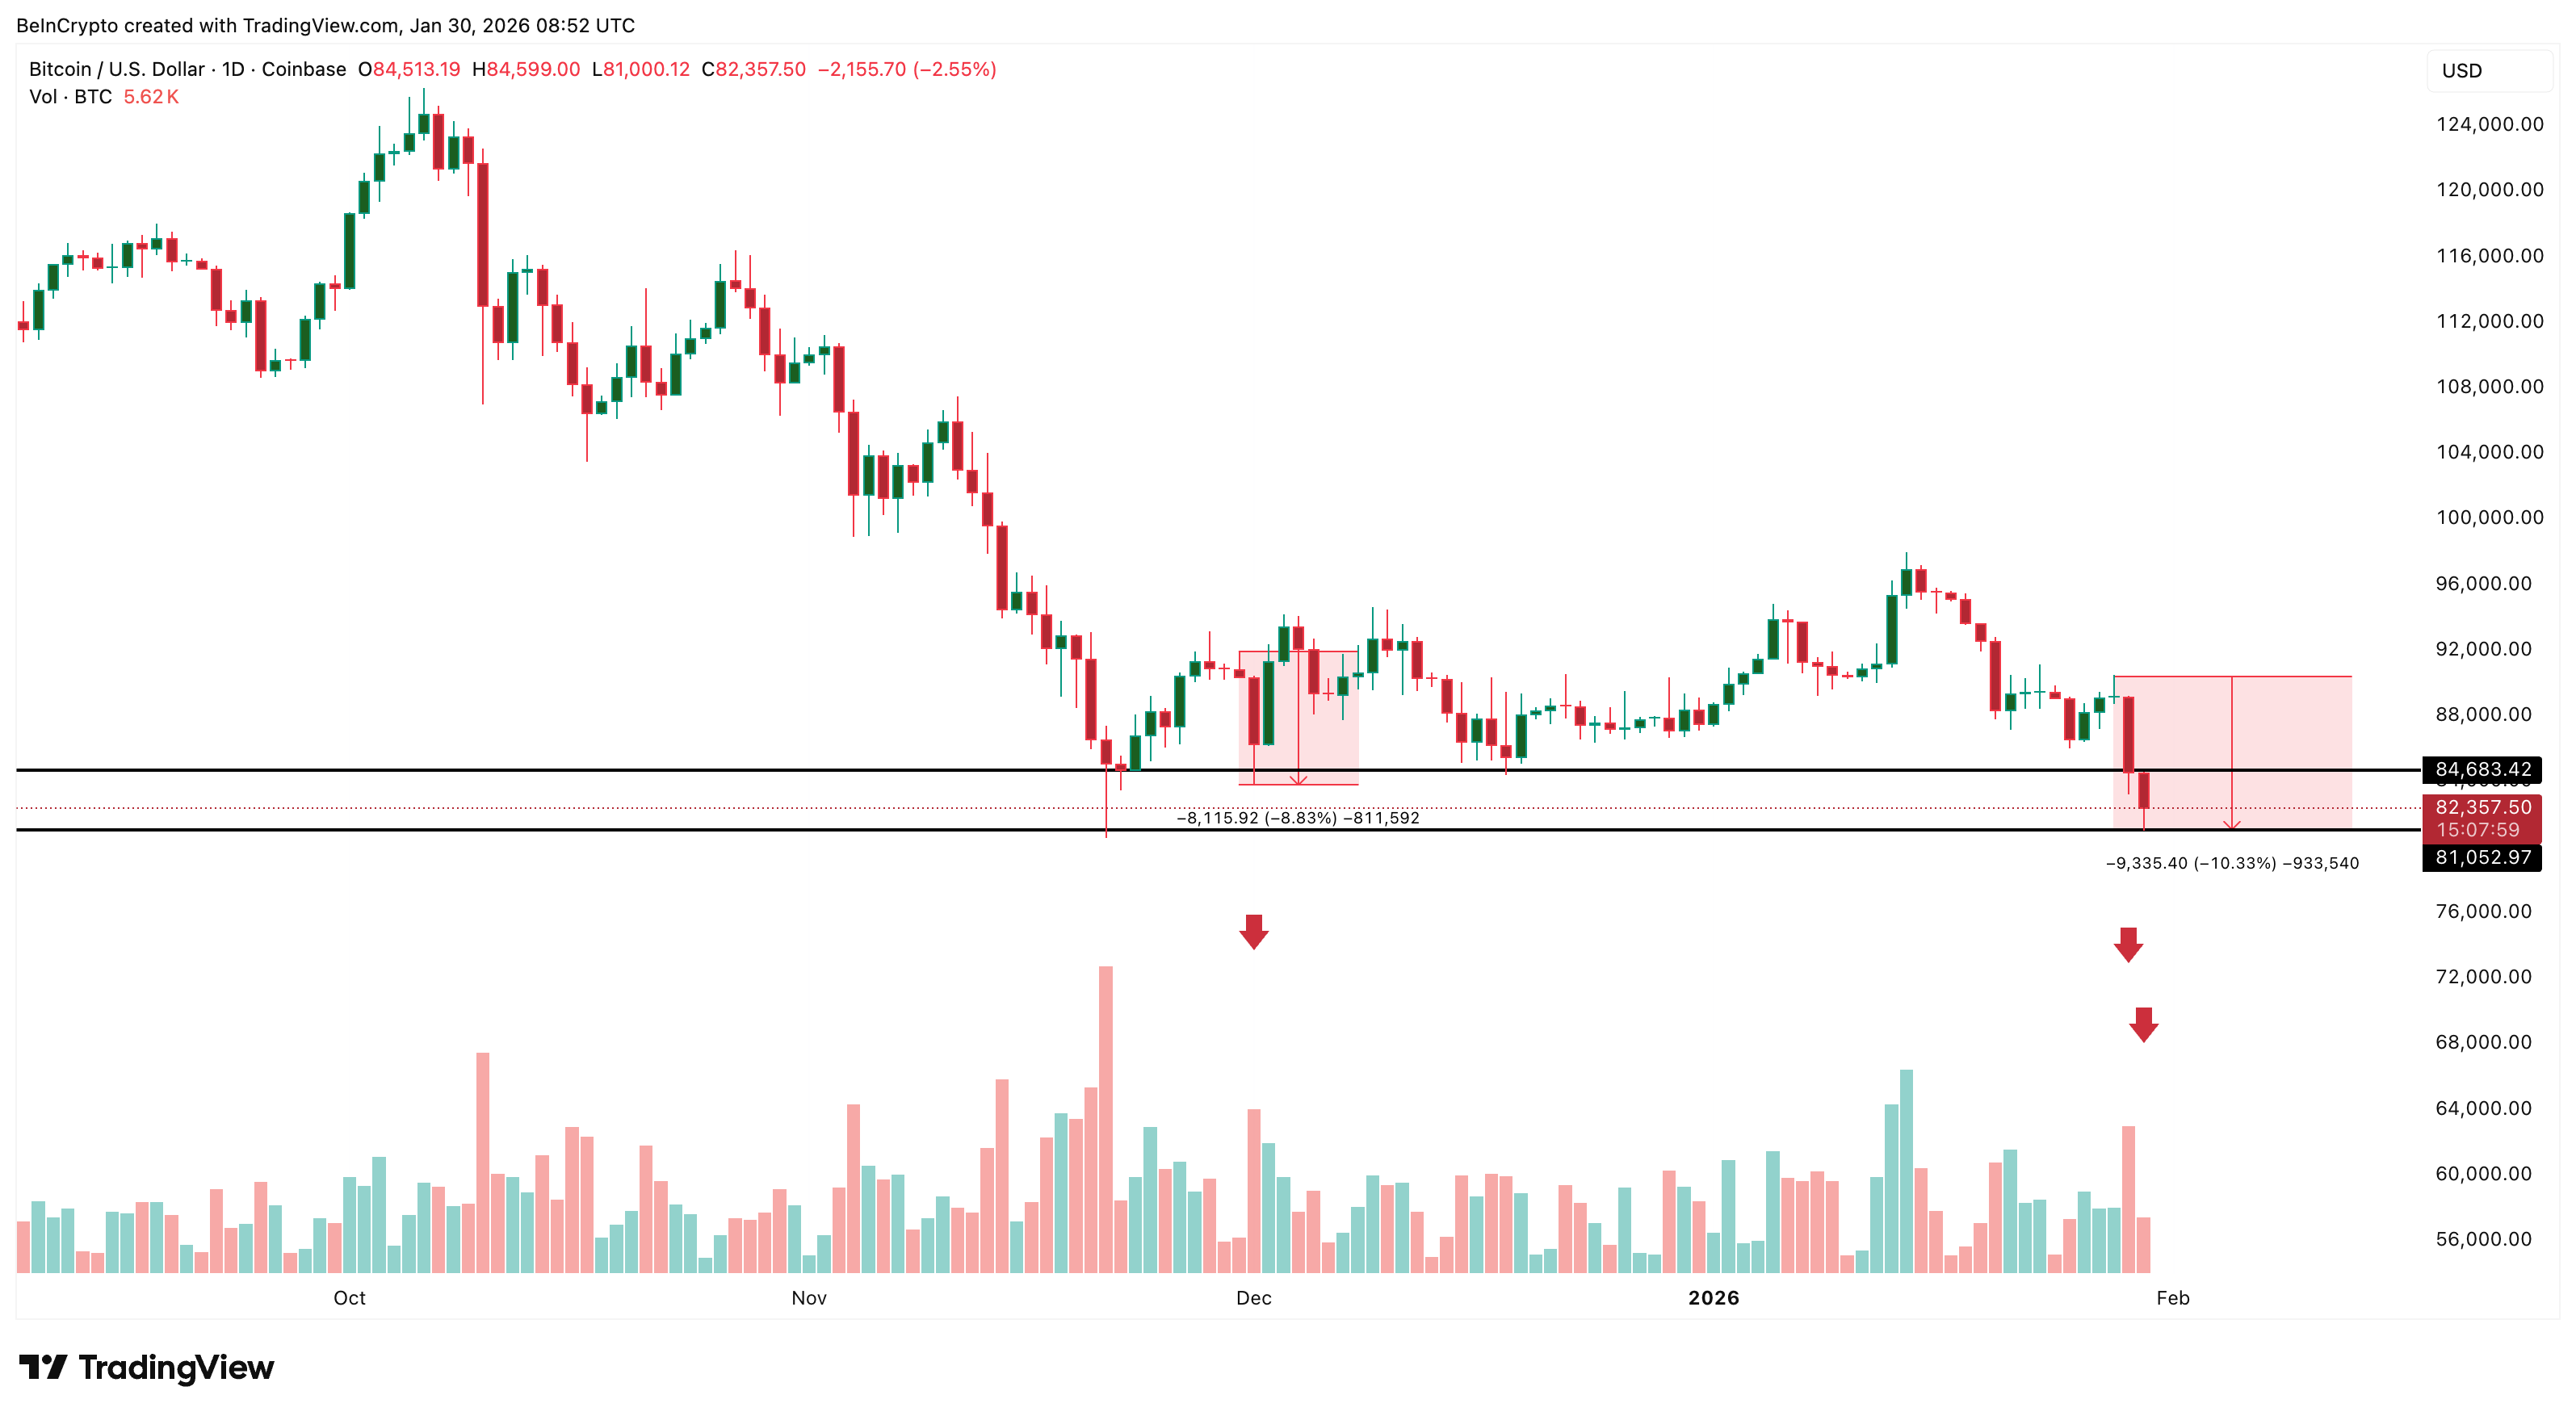 Bitcoin Price Crash: TradingView
At the same time, Bitcoin entered one of its most important on-chain zones.
This is where UTXO Realized Price Distribution (URPD) matters. URPD shows where the existing Bitcoin supply was last bought. Large clusters indicate levels where many coins last changed hands, often acting as major support or resistance zones.
Two of the largest clusters, per the chart, sat at:
- $84,569 (3.11% of supply)
- $83,307 (2.61% of supply)
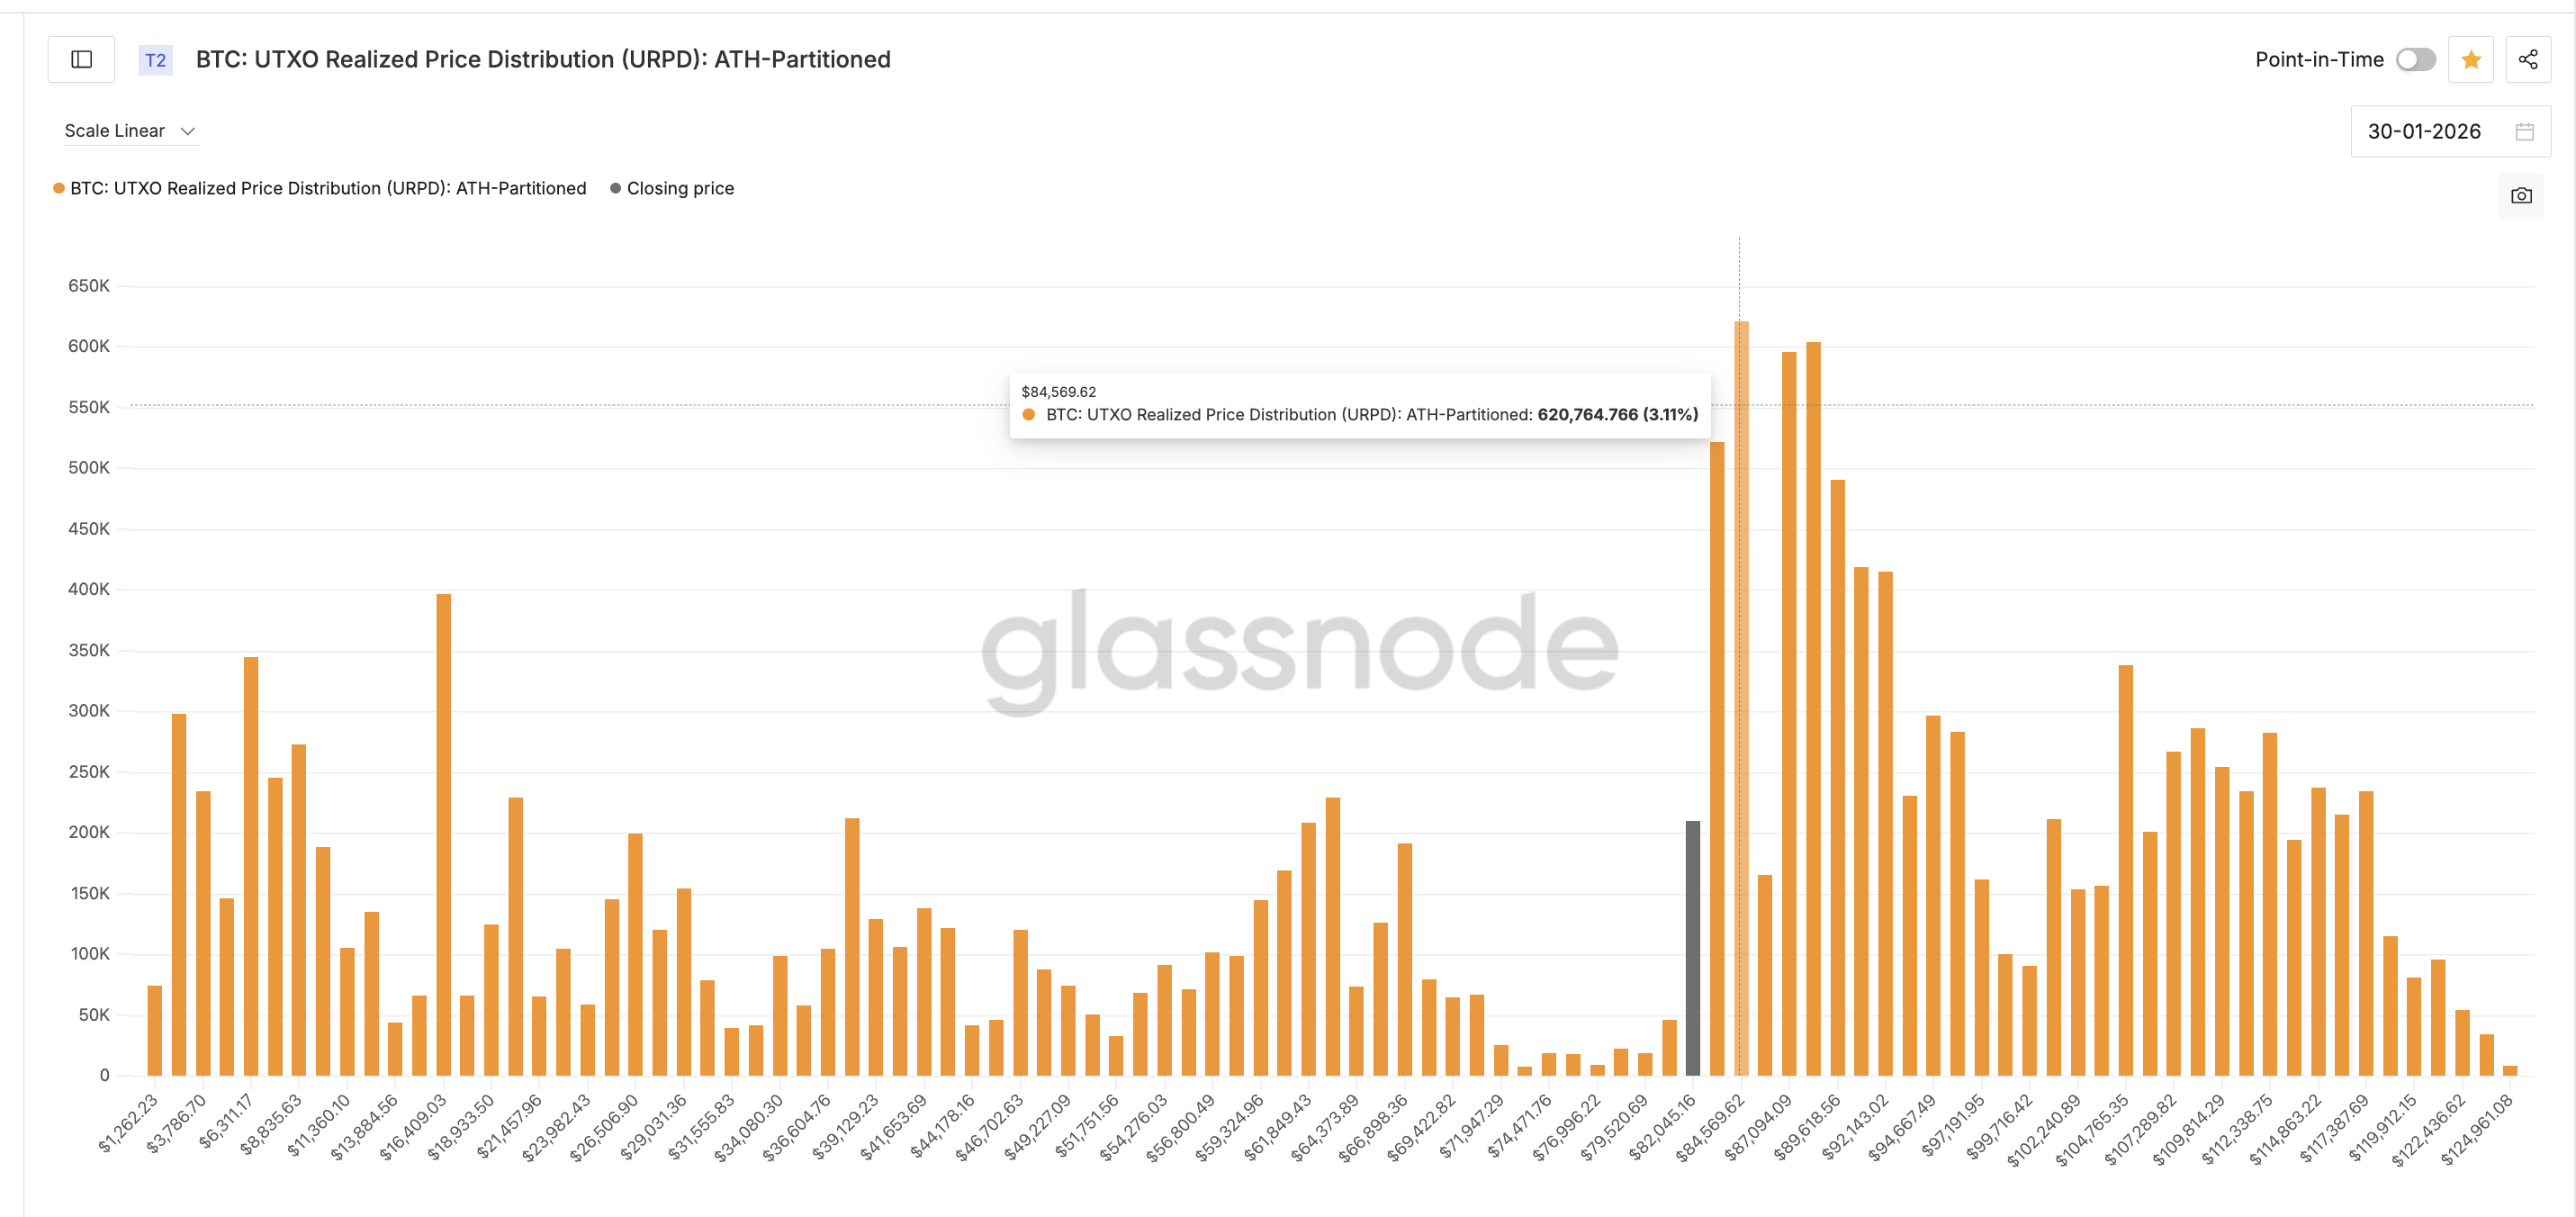 Key URPD Levels: Glassnode
Together, they formed one of the densest ownership zones in this cycle.
When Bitcoin fell below $84,600, it entered this cluster zone. That is where trouble began as the first cluster came under threat.
Glassnode data shows that long-term holders, coins possibly held over several months to a year, started selling into this level. On January 29, their 30-day net position change dropped to -144,684 BTC, the largest monthly outflow of the period.
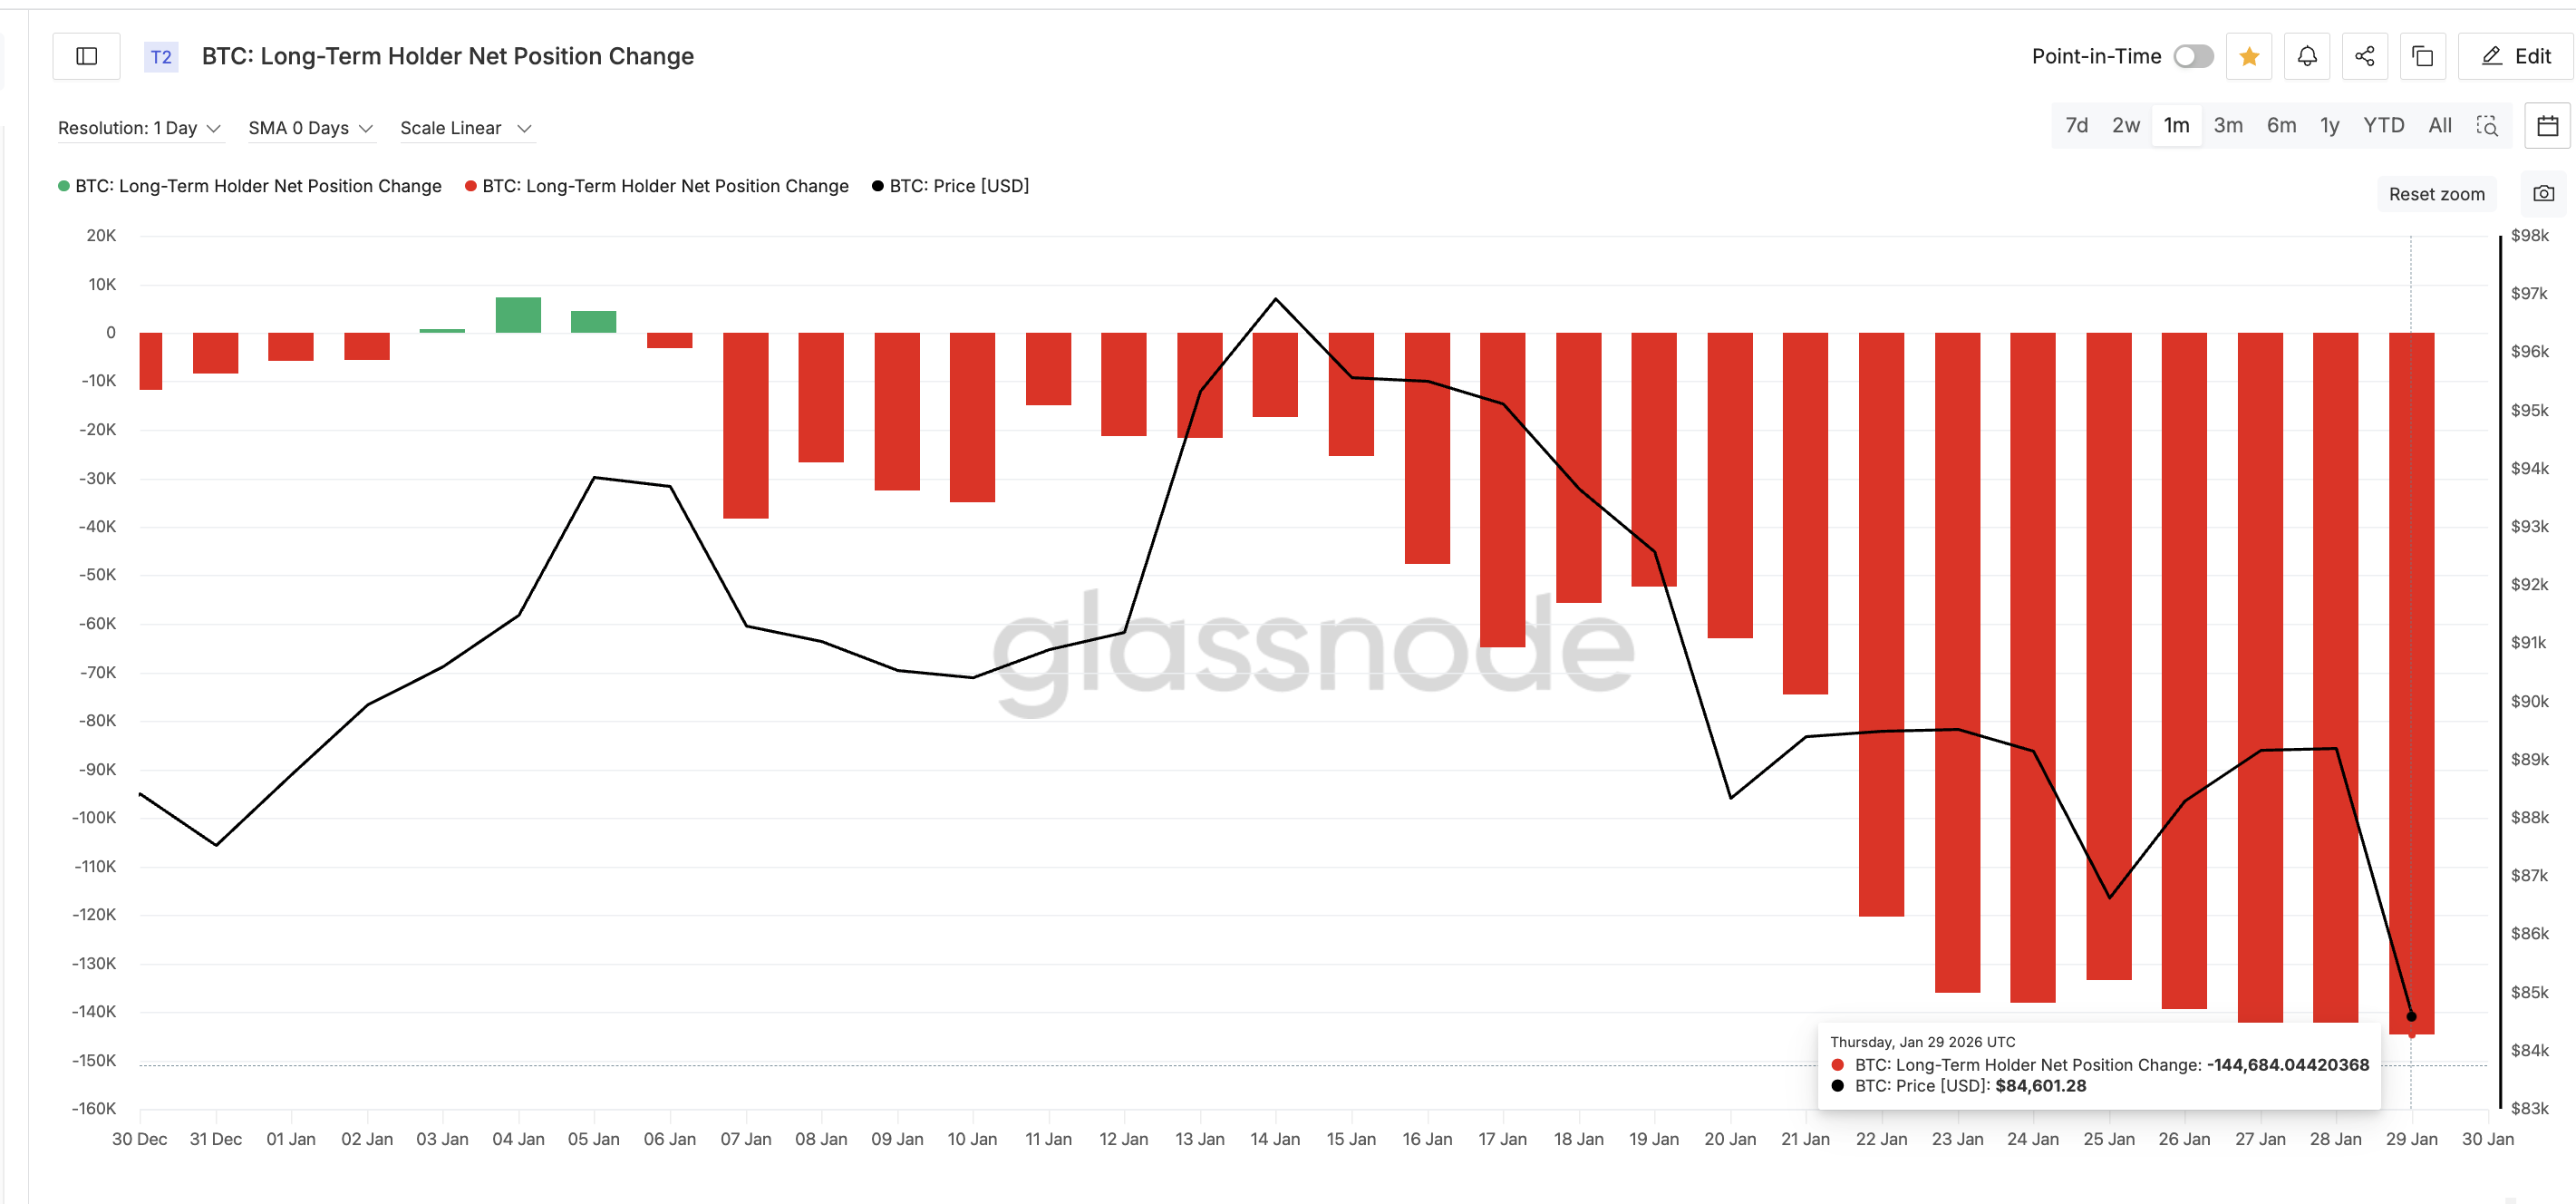 Long-Term Holders: Glassnode
Long-term holders sold near $84,600, adjacent to where the largest URPD cluster sat. When heavy selling meets a major cost zone, support breaks. Once that floor failed, a large portion of supply moved into loss. Only after this breakdown did liquidation pressure explode.
Why On-Chain Data Looked Healthy While Risk Was Building
This BTC price crash surprised many traders because surface-level metrics looked stable.
Hodler Net Position Change remained positive, showing about +16,358 BTC added over 30 days.
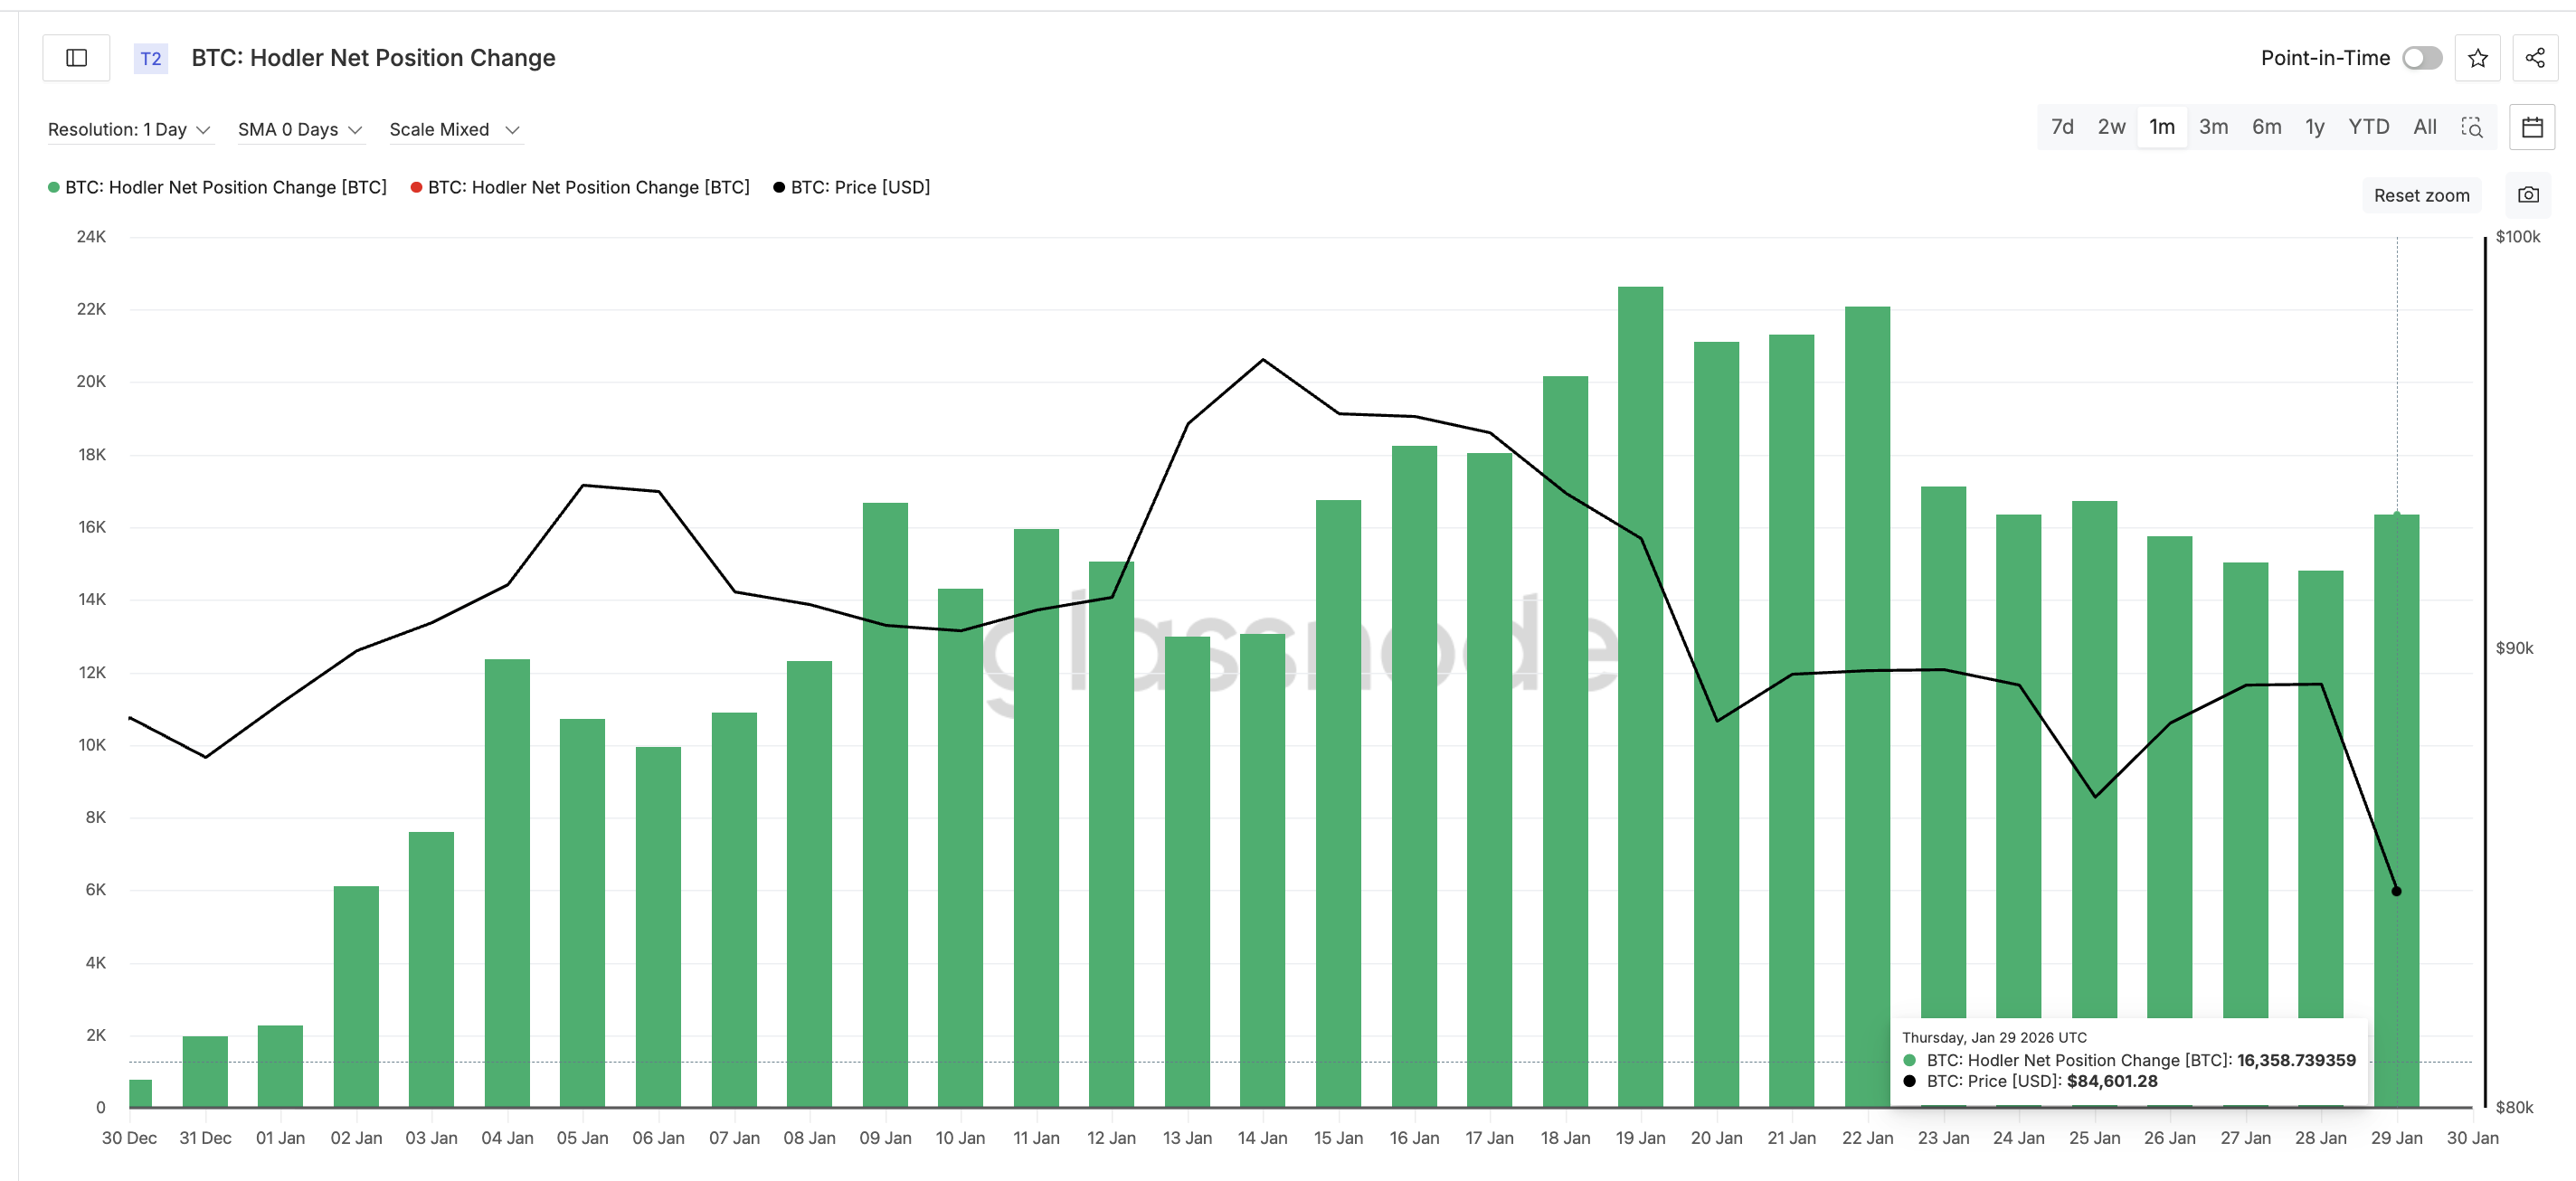 HODlers Keep Buying: Glassnode
Want more token insights like this? Sign up for Editor Harsh Notariya’s Daily Crypto Newsletter here.
Whale balances were also rising. Large wallets were not dumping aggressively. On paper, accumulation was happening.
 BTC Whales: Glassnode
But these metrics mix different investor groups.
Mid-term holders and big wallets were still buying. Long-term holders were quietly distributing. When experienced holders start selling near major cost clusters, it signals conviction-led risk, even if overall balances look strong.
That is why most investors missed the warning. BeInCrypto analysts highlighted this risk a week back. The market appeared healthy. Underneath, its strongest support was being sold into.
Once that selling weakened the $84,600 zone, leverage became vulnerable. As the price dipped further, long positions started getting liquidated. CoinGlass data shows nearly $800 million in Bitcoin longs were wiped out in 24 hours.
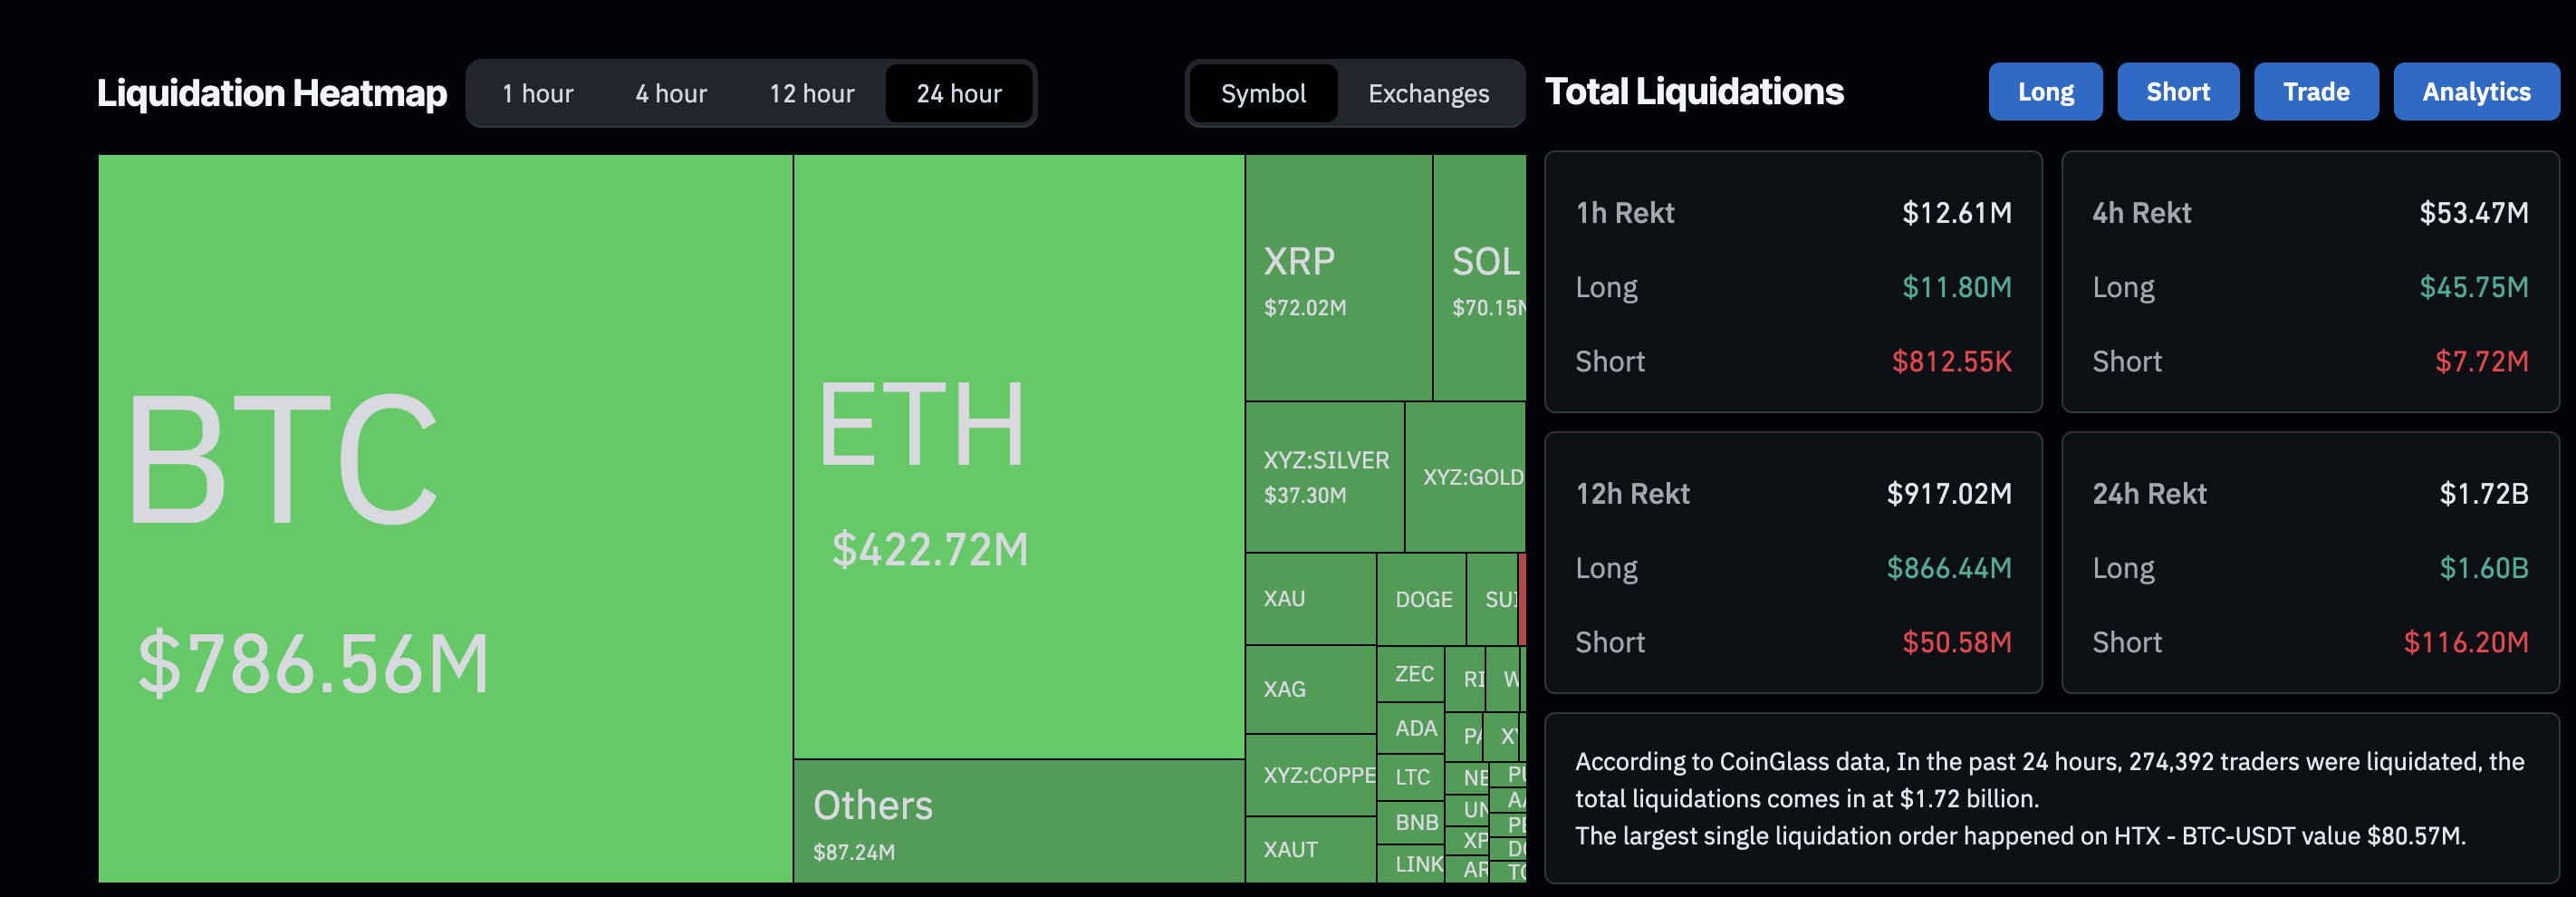 Liquidation Numbers: Coinglass
Derivatives did not create weakness. They reacted to it.
Broken Structure, Downside Risk, and Key Bitcoin Price Levels
The technical structure has now deteriorated. Bitcoin has broken below the neckline of a head and shoulders pattern on the daily chart. This is a bearish reversal formation that often appears before extended corrections.
Based on this pattern, the breakdown projects another 12% downside from the neckline. That places risk near the $75,000 zone if selling resumes. The $81,000 level is now critical support.
If Bitcoin loses this level again, momentum could accelerate lower. If it holds, stabilization becomes possible.
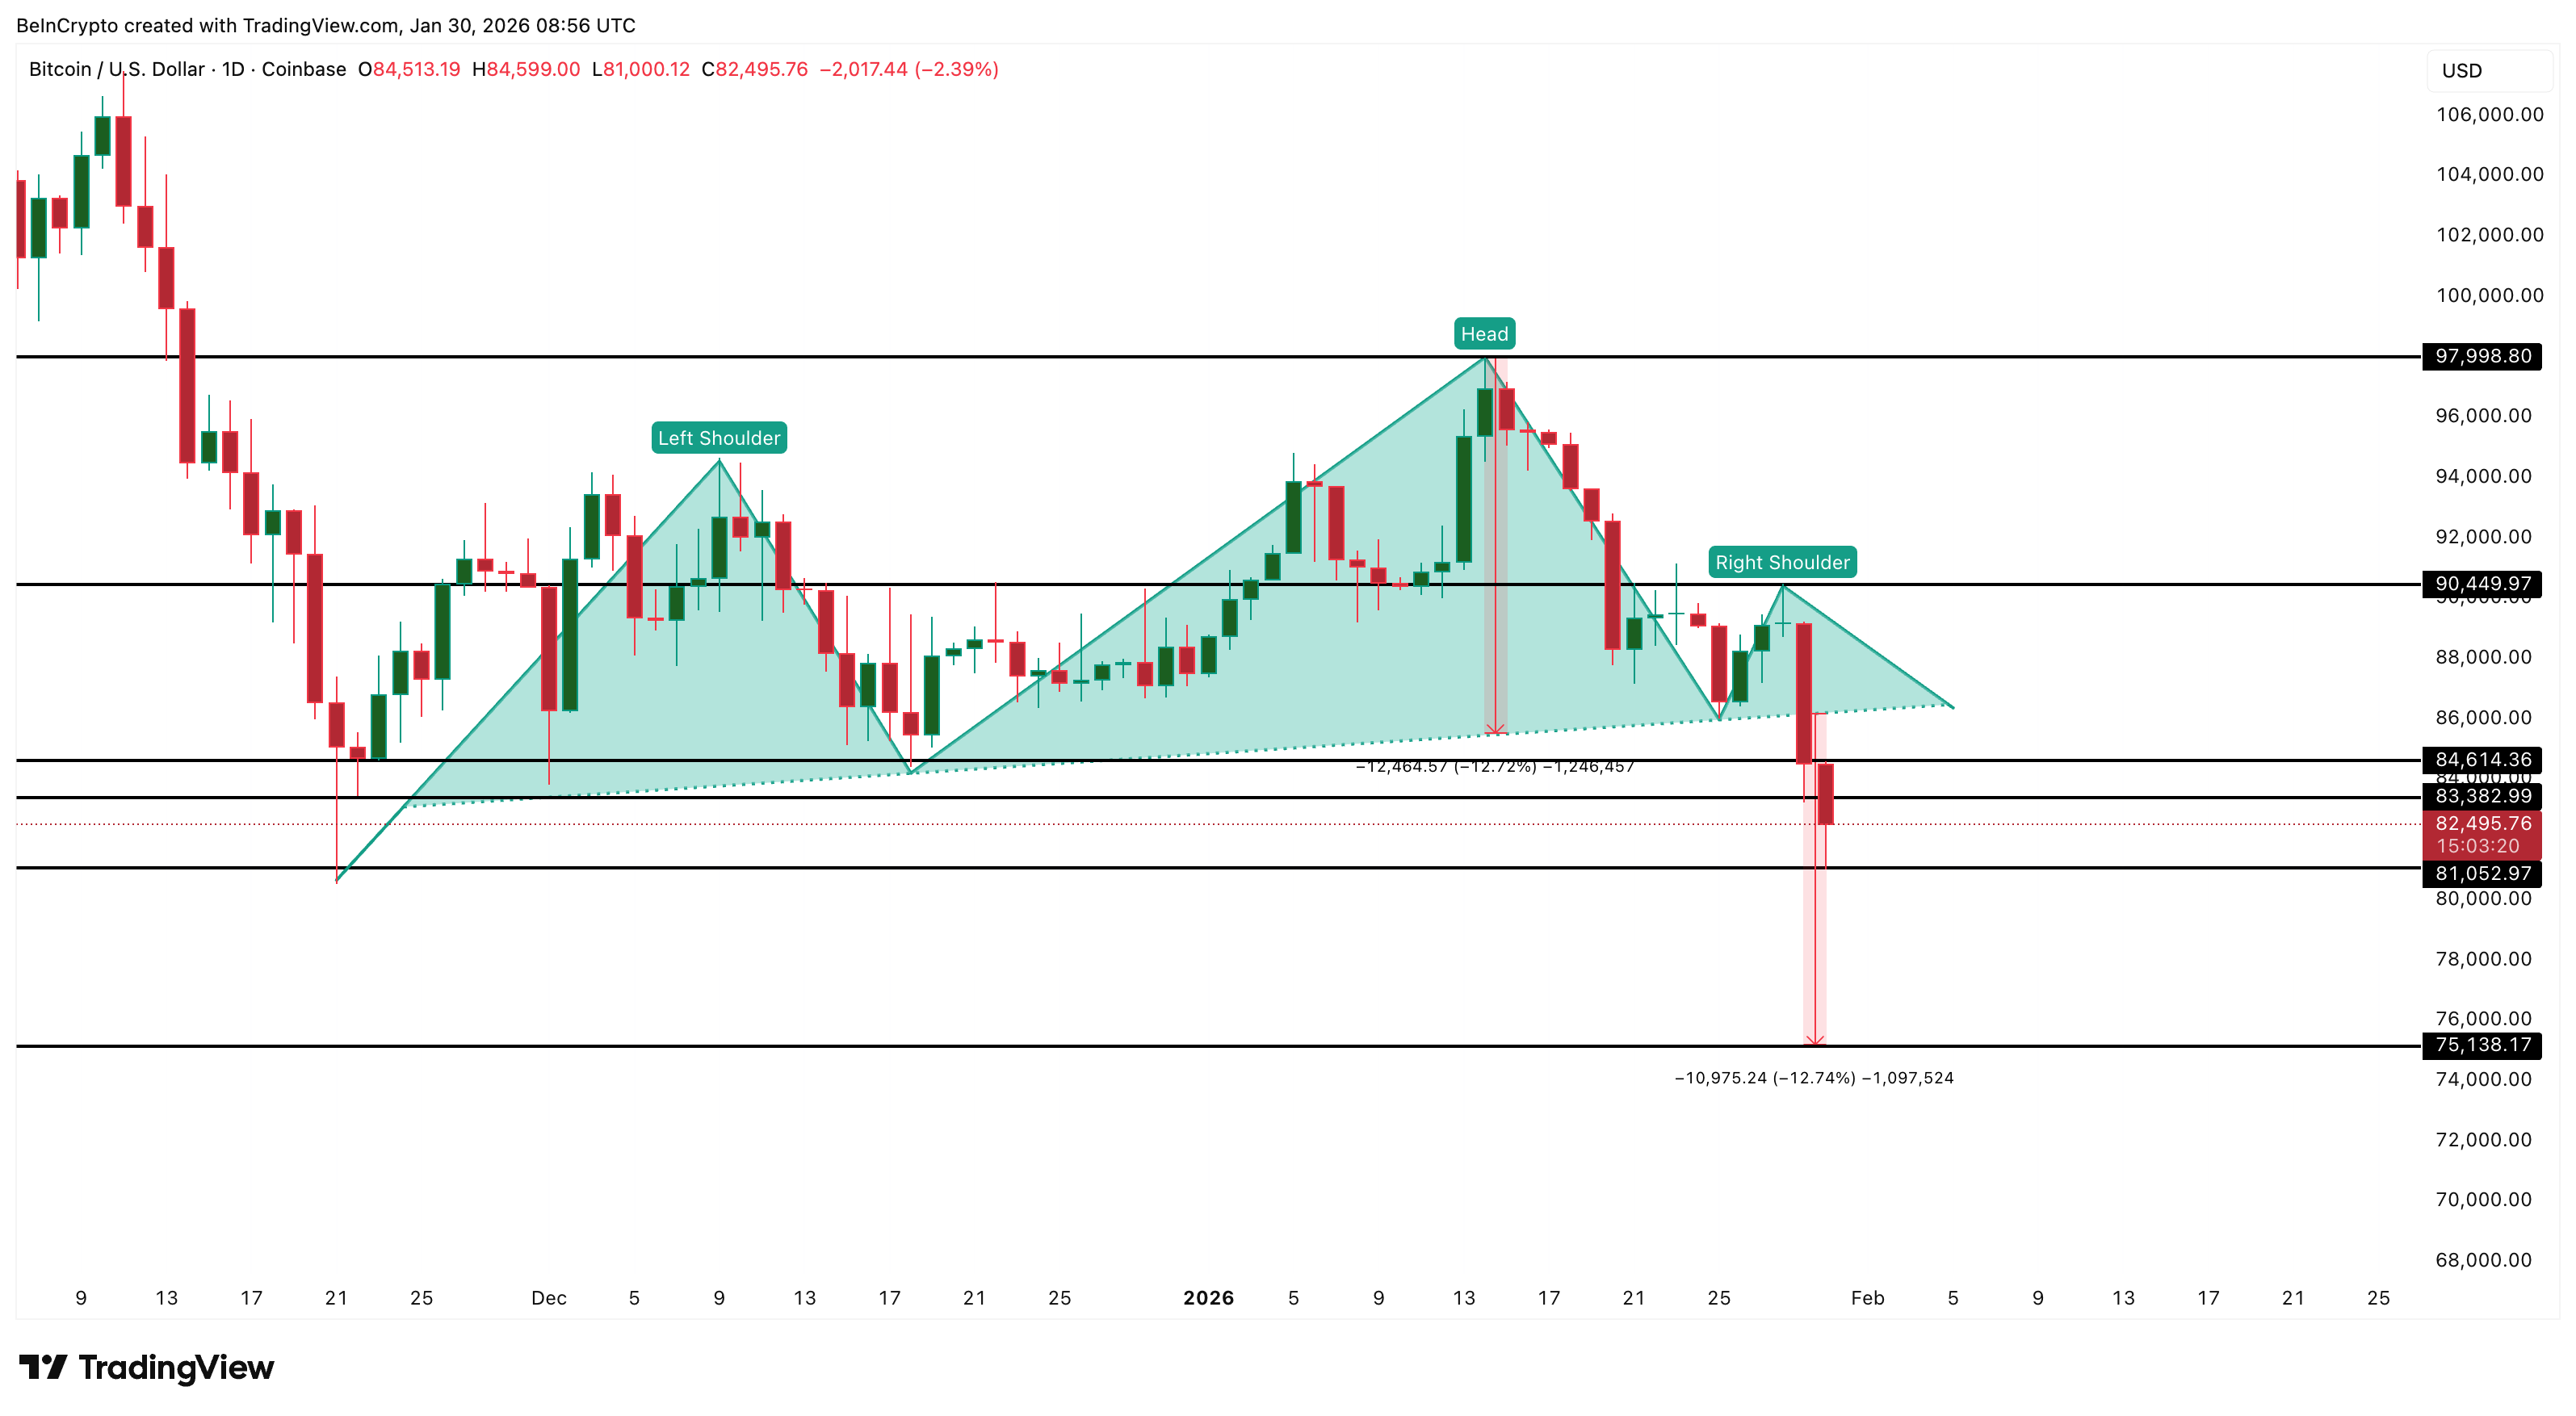 Bitcoin Price Analysis: TradingView
Recovery depends on reclaiming key on-chain and chart levels. The first important BTC price zone sits near $83,300, matching the second-largest URPD cluster. A move above this level would show buyers are defending prior ownership areas.
The main level remains $84,600. That is where long-term holders sold. And that is where the largest URPD cluster sits. Until Bitcoin closes decisively above $84,600, rebounds would remain fragile.
Recommended Articles


