


Can Cardano (ADA) Price Beat Weak February History With a 90% Breakout Setup?
Cardano price enters February at an uncomfortable but interesting point. January is expected to close higher, with ADA up about 5.48% month-to-date, closely tracking its historical January median. That sounds constructive at first glance. But momentum into February is fading. Over the past seven days, the Cardano price has been down roughly 4%, showing hesitation rather than strength.
History adds pressure. Based on median returns, February has been a consistently weak month for Cardano. That creates a clear tension: seasonal history points down, but the chart structure is quietly improving. The question is not whether Cardano looks strong today. It does not. The question is whether emerging technical conditions can override history.
Cardano’s Weak February History Meets a Developing Falling Wedge
Looking at historical performance first sets the framework. Cardano’s median February return is negative (-9.50%), while January’s median is positive. That explains why January often performs reasonably well, while February tends to erase those gains.
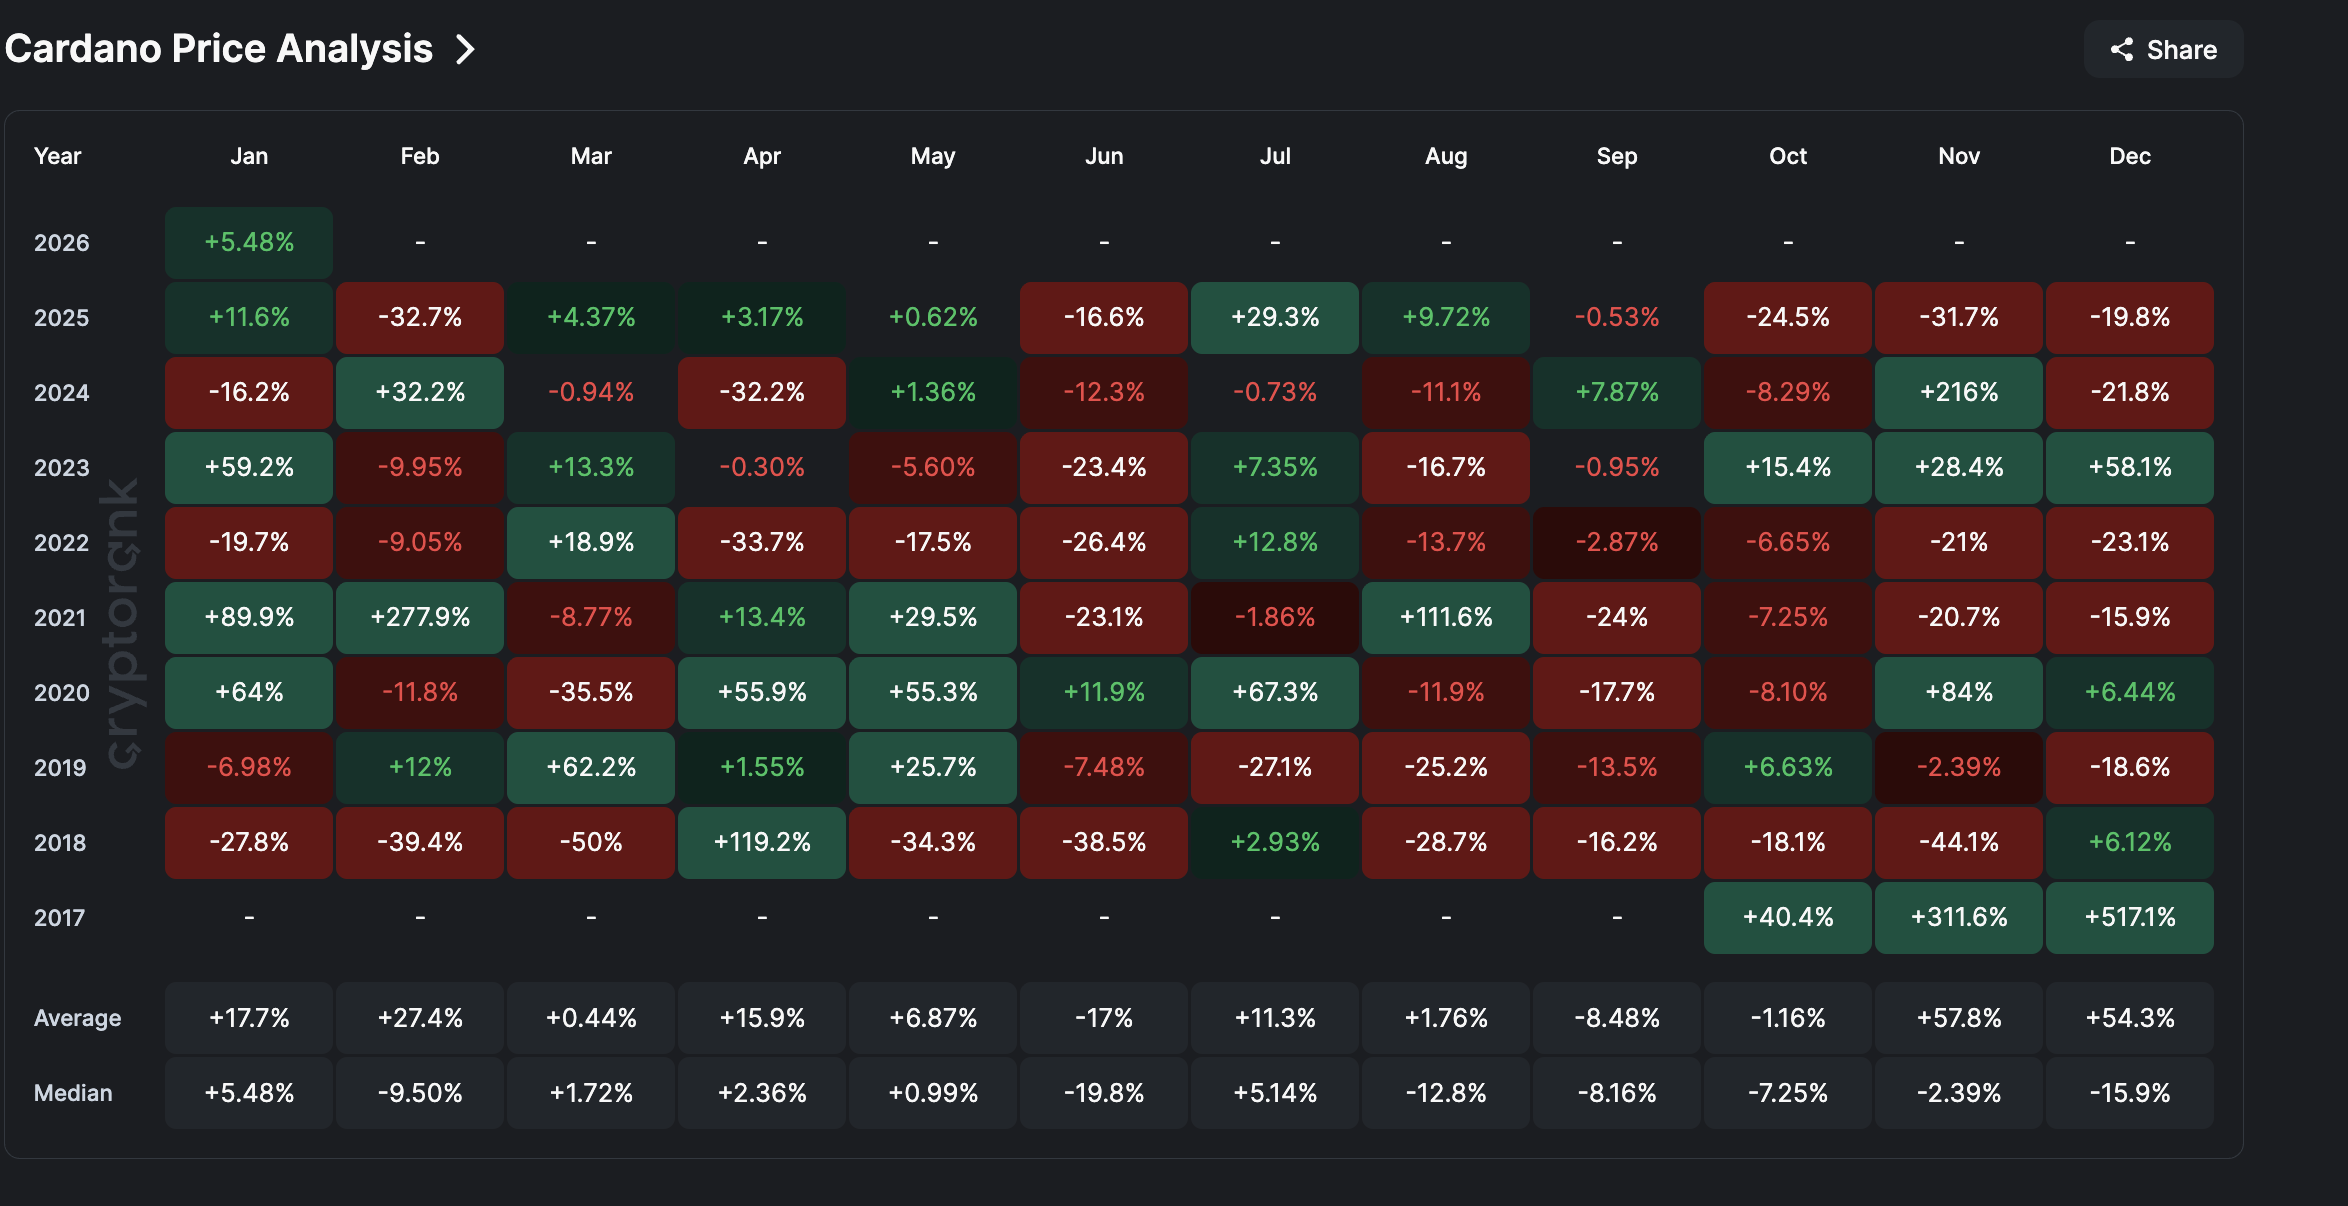 Cardano Price History: CryptoRank
Want more token insights like this? Sign up for Editor Harsh Notariya’s Daily Crypto Newsletter here.
The price structure, however, gives hope.
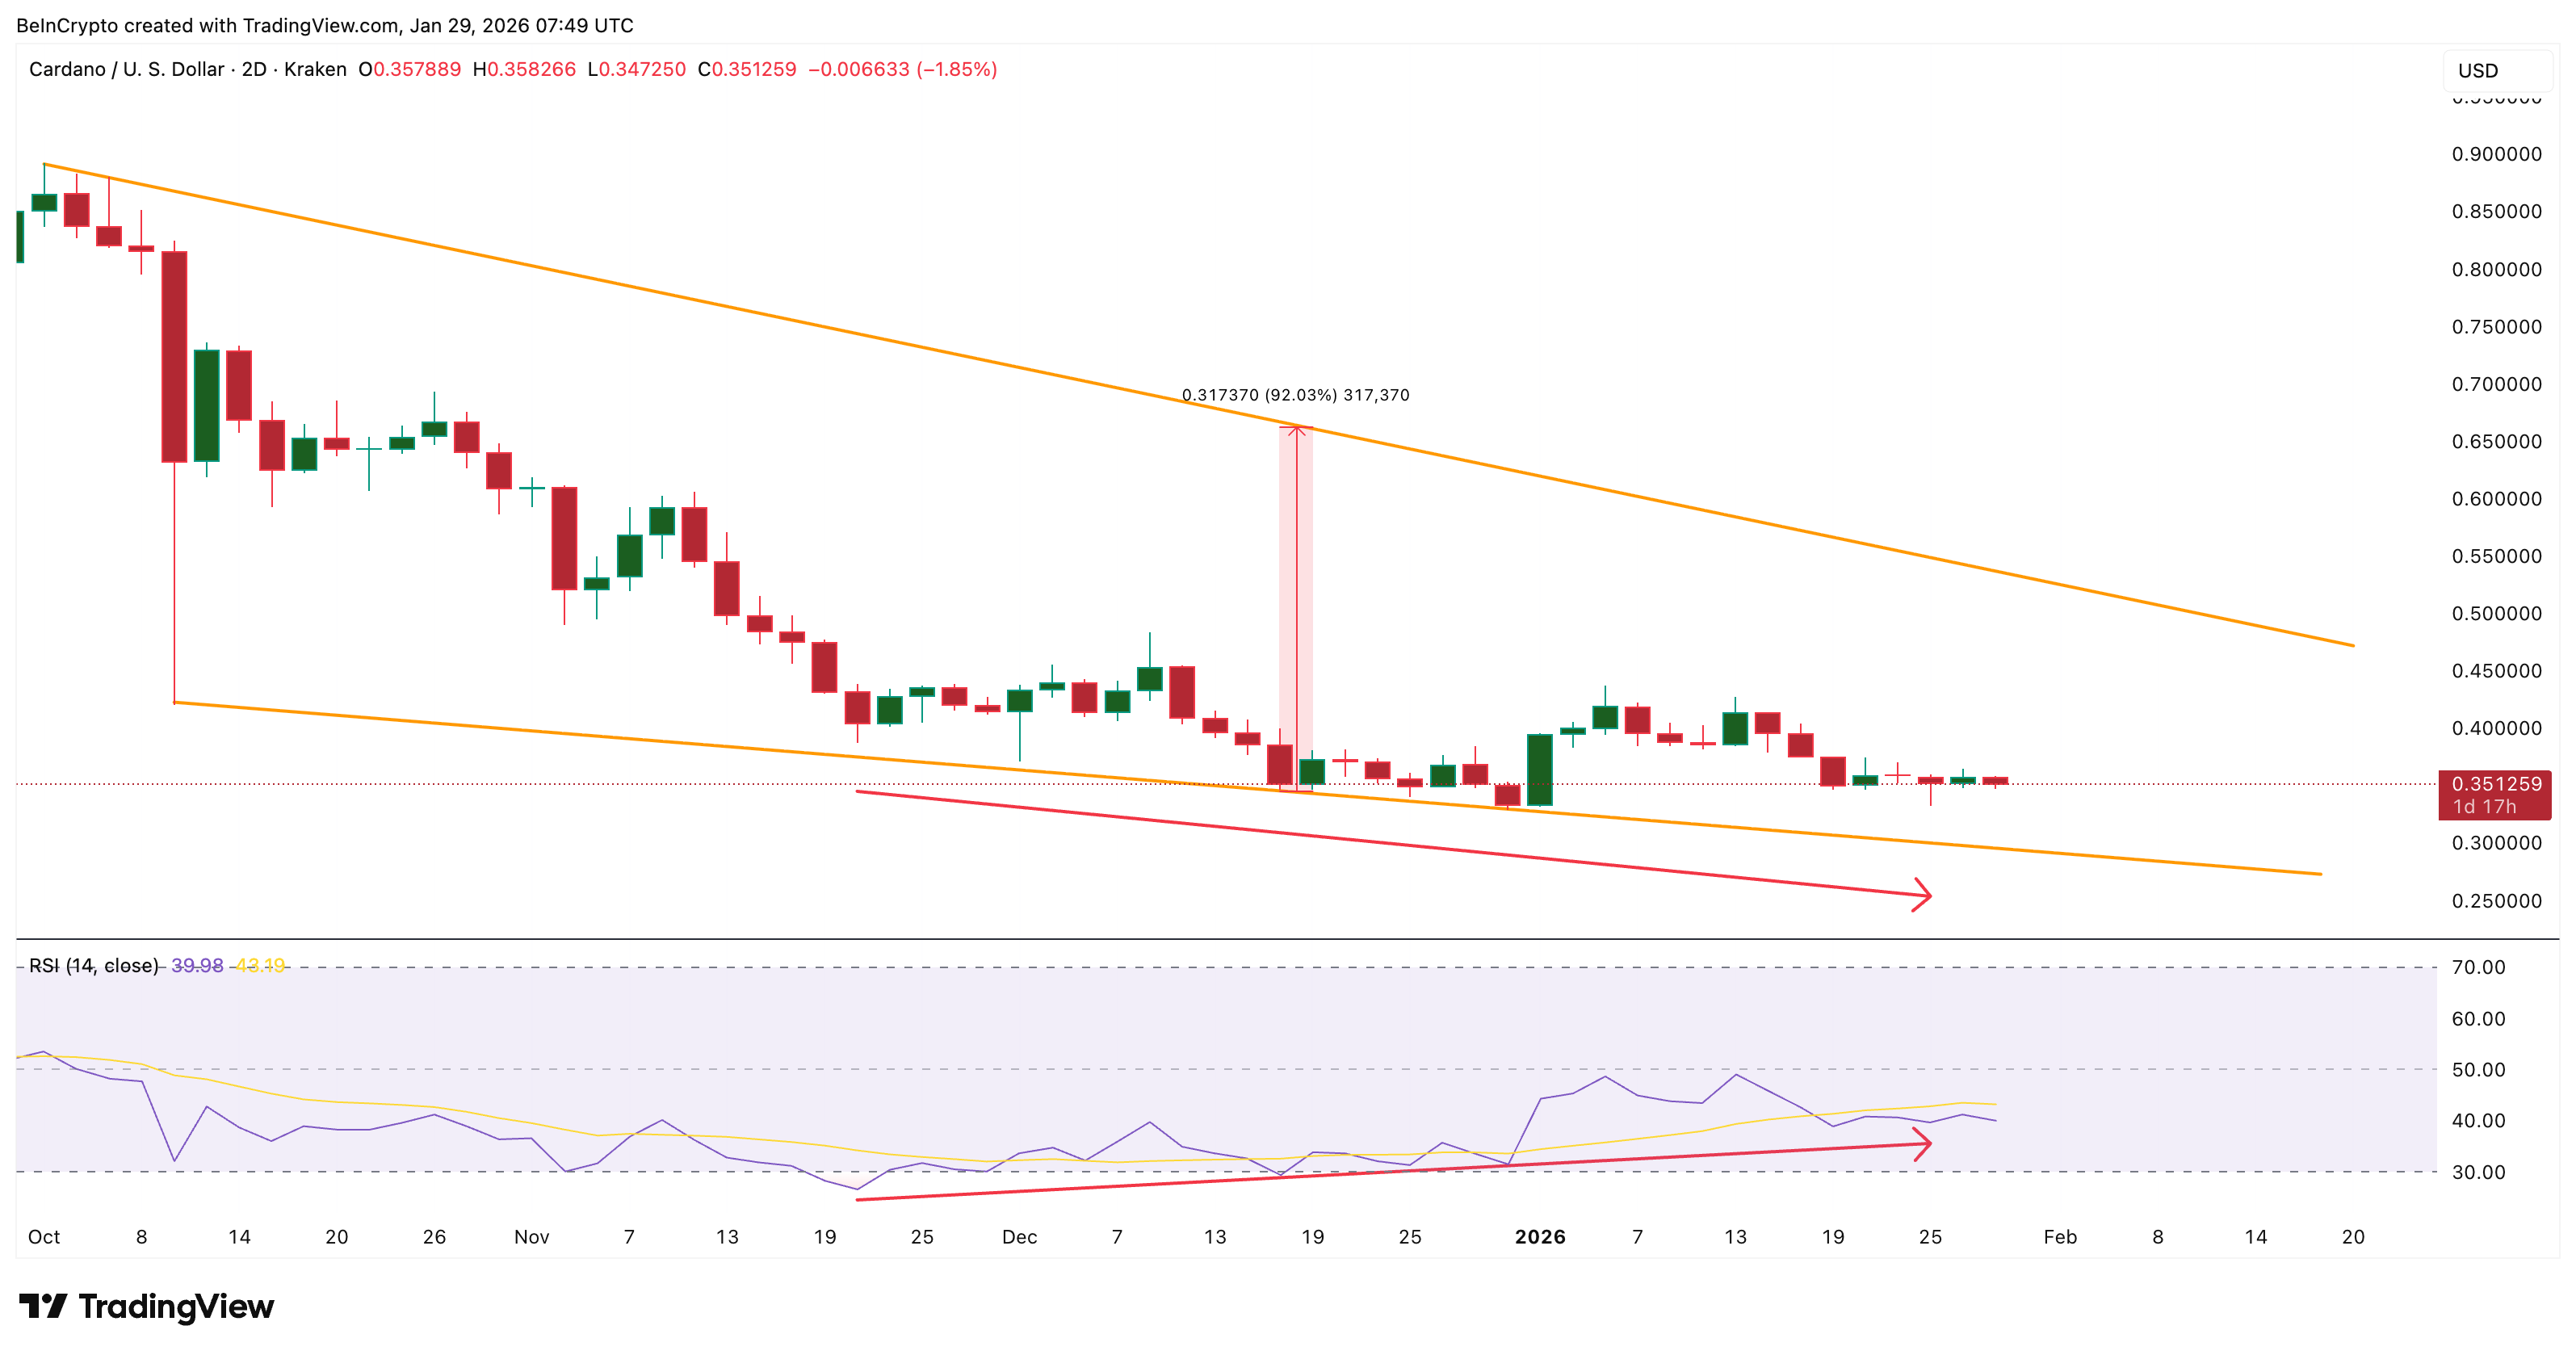
On the two-day chart, the Cardano price has been compressing inside a falling wedge since late October. A falling wedge forms when the price makes lower highs and lower lows, but the distance between them narrows. This pattern often signals that selling pressure is weakening over time.
The projected upside comes from measuring the widest part of the wedge, from the earliest low to the thickest section of the structure, and projecting that distance upward. That measurement points to a potential move of roughly 90%. This is a maximum projection, not a forecast, and it only applies if the structure breaks upward.
Momentum supports the idea, conditionally.
Between November 21 and January 25, the Cardano price made a lower low. During the same period, the Relative Strength Index (RSI) made a higher low. RSI measures momentum, or the strength of buying and selling pressure. When the price weakens, but the RSI improves, it suggests sellers are losing control.
 Bullish Structure: TradingView
This bullish divergence appears on a two-day timeframe. Still, it remains restricted to a rebound hope and not a reversal unless the ADA price breaks above the wedge’s upper trendline. Structure and momentum are aligning, but confirmation is missing.
That leads directly to the next question: Is there enough demand to force the ADA price breakout?
Spot Buying and CMF Improve, but History Says They Are Still Too Weak
Spot market behavior explains why the price has stalled.
During January, Cardano saw mostly steady net buying, which helped support the 5% monthly gain. However, the size of the buying matters more than its direction. The strongest spot inflows in this cycle appeared in August, when net buying peaked near $40.5 million. At that time, ADA price traded close to $1.
January’s largest near-term move was a $3 million outflow, nearly an order of magnitude smaller. This shows participation, not conviction.
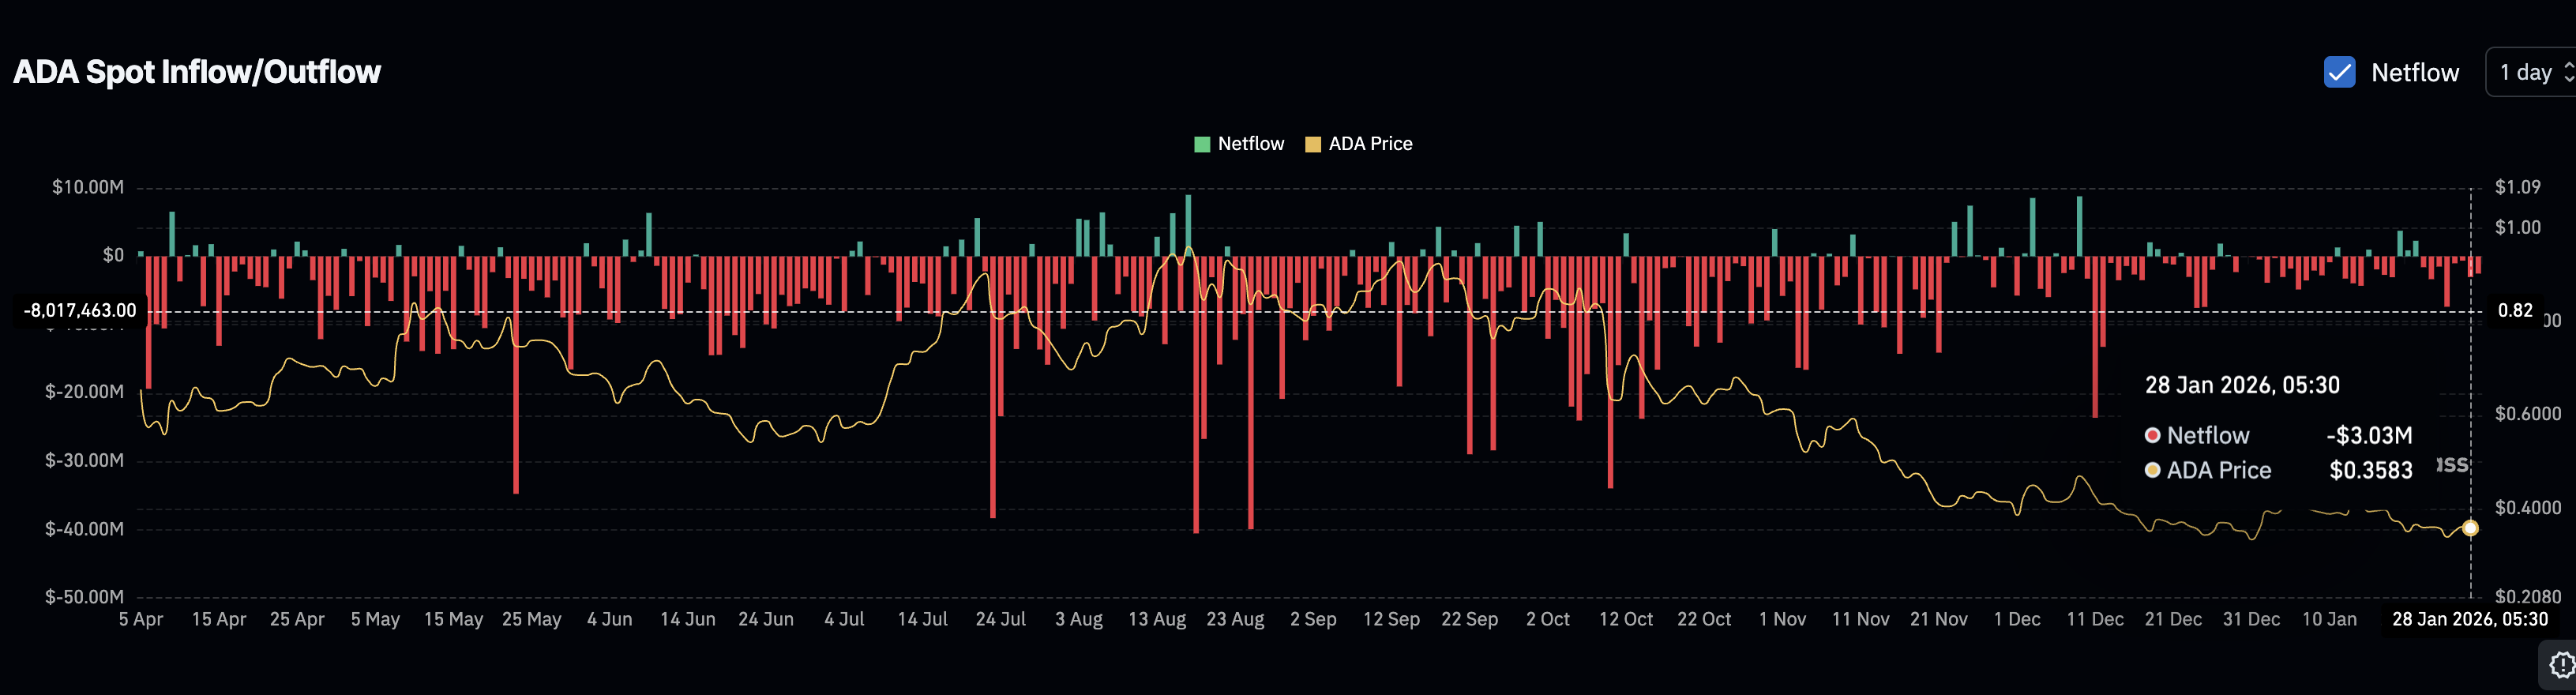 ADA Spot Activity: Coinglass
The Chaikin Money Flow (CMF) indicator supports this view. CMF tracks whether larger players are accumulating or distributing. Between January 5 and January 25, CMF trended higher while price drifted lower. That is a bullish divergence, suggesting big money is getting more interested in ADA.
But CMF remains below zero, meaning capital inflows are still weaker than outflows overall. During August’s peak, CMF reached around 0.16. Current readings are far lower. Improvement is visible, but strength is not.
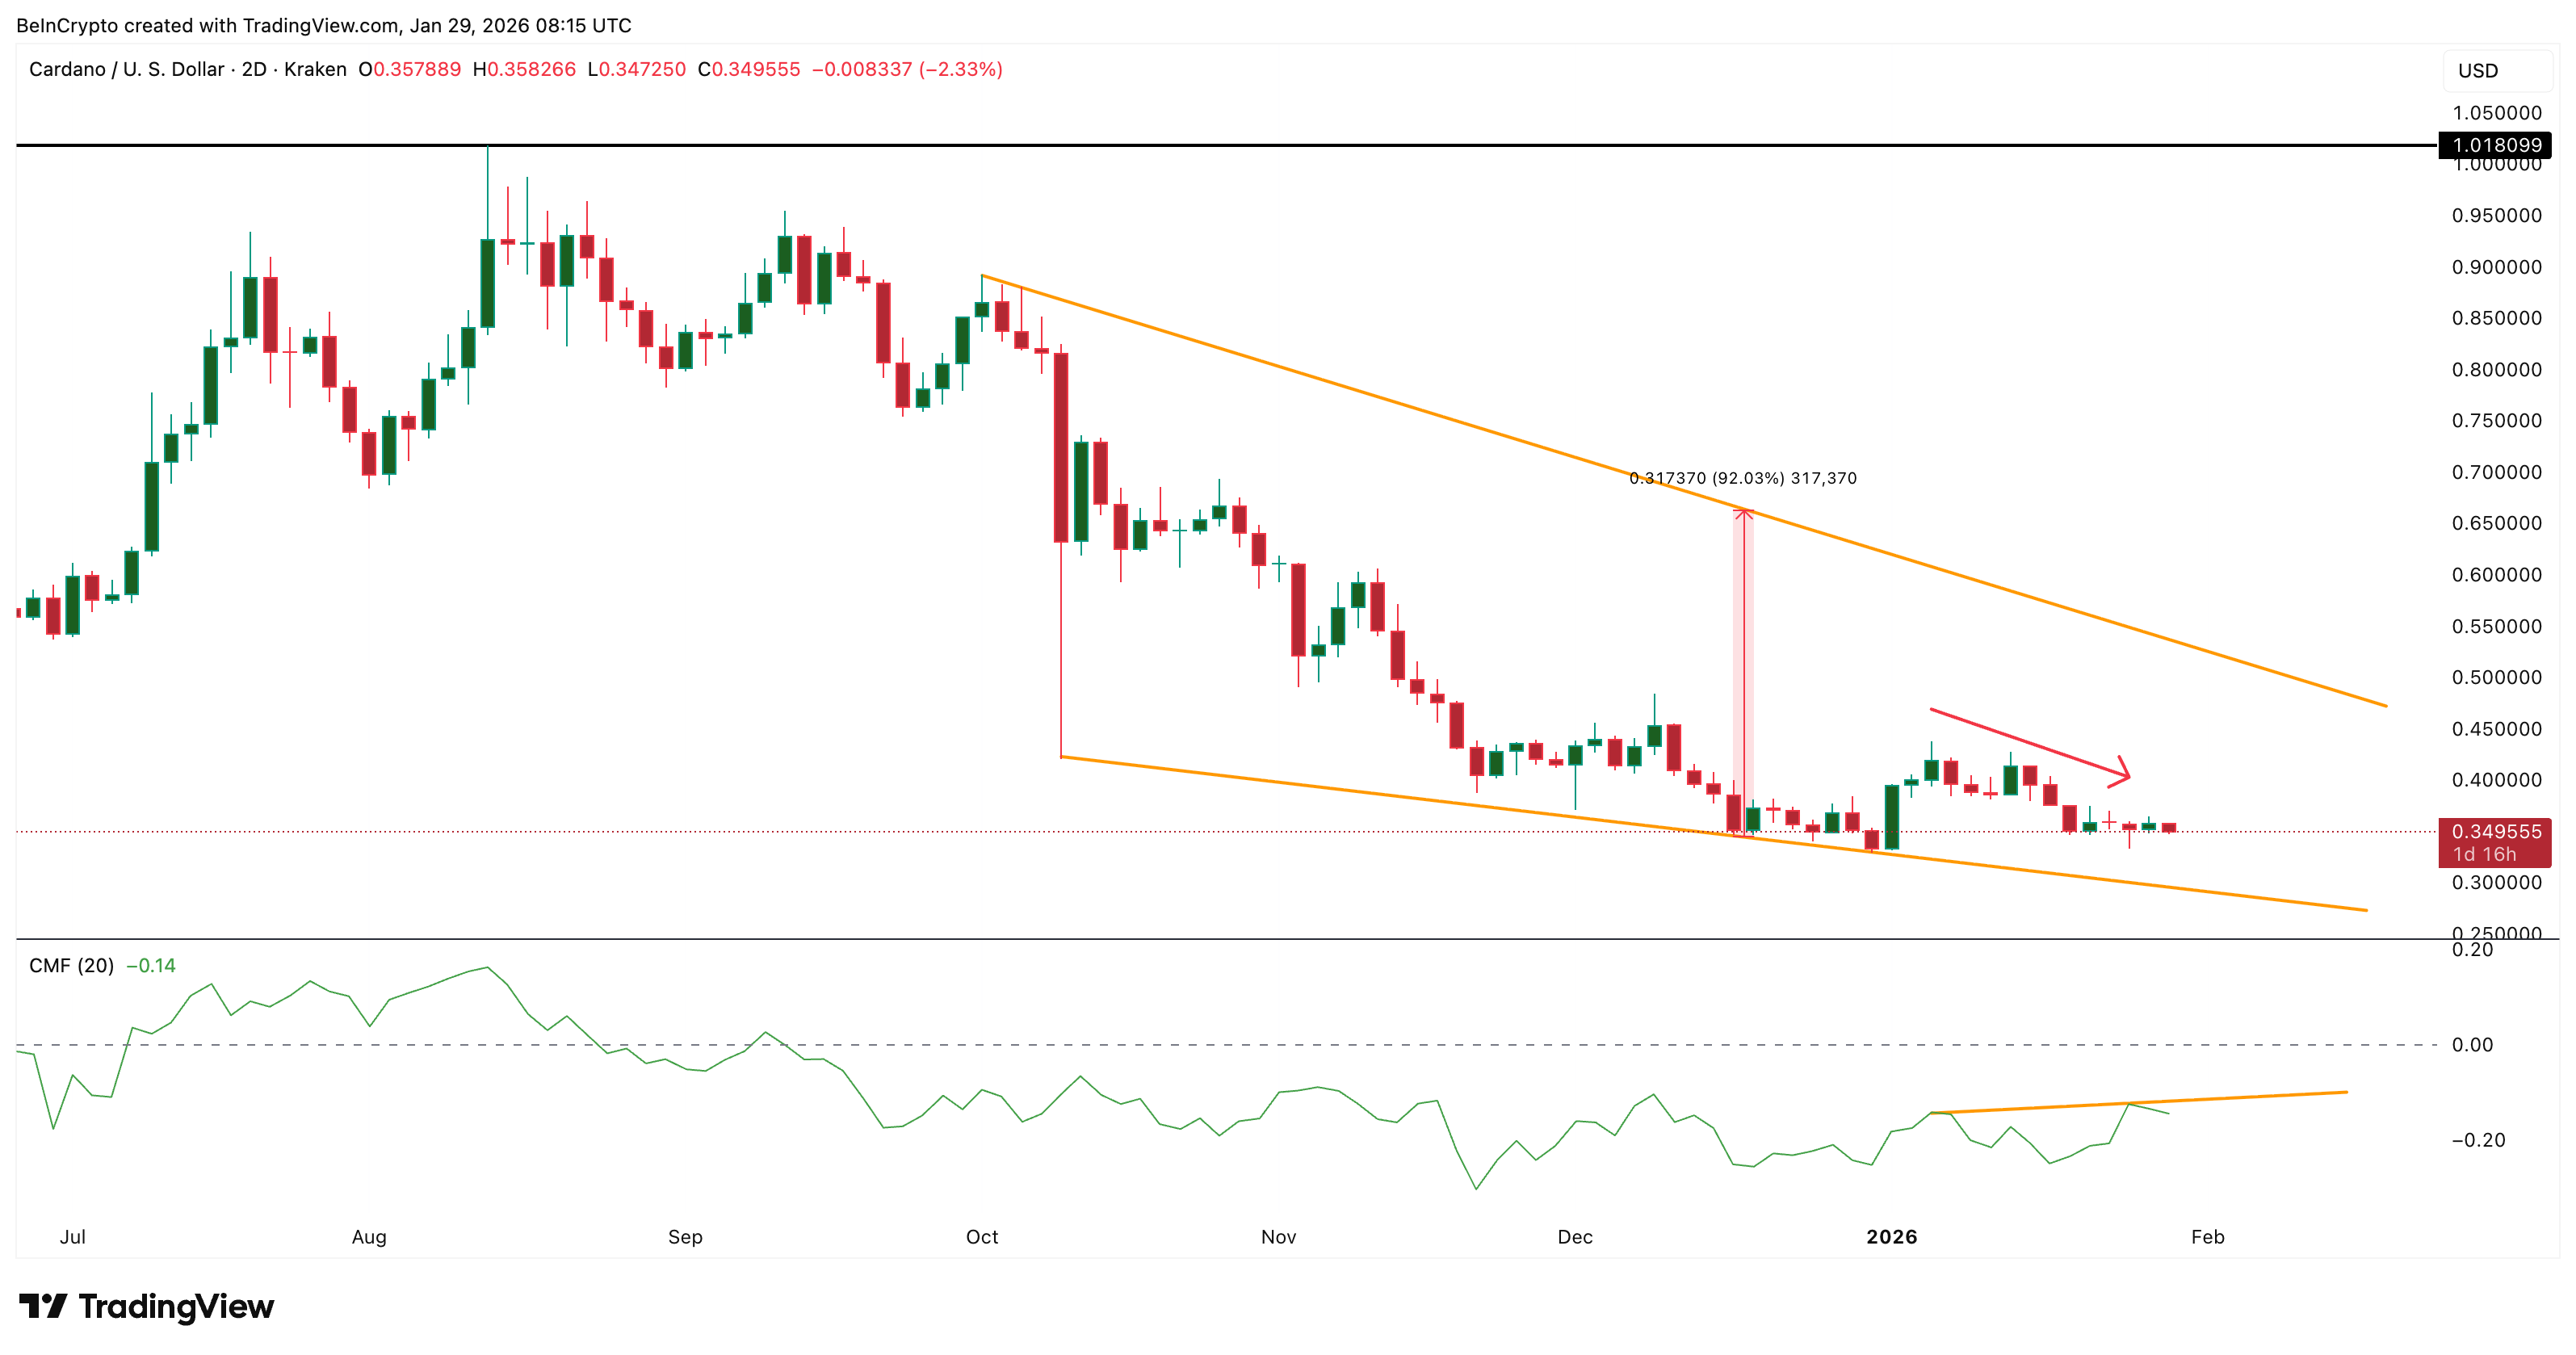 Big Money Coming In: TradingView
This explains why the Cardano price has not accelerated. Buying exists, but it lacks force. If history is to be beaten, something else must push the price higher. That brings derivatives into focus.
Positioning and Cardano Price Levels That Decide Cardano’s February Outcome
Derivatives positioning provides the missing catalyst.
On Gate’s ADA perpetual market, the 30-day data shows roughly $166.7 million in short leverage, compared with about $89 million in long leverage. Shorts outweigh longs by nearly two times. This creates vulnerability. If the Cardano prices rise, short sellers are forced to buy back their positions, adding fuel to the move.
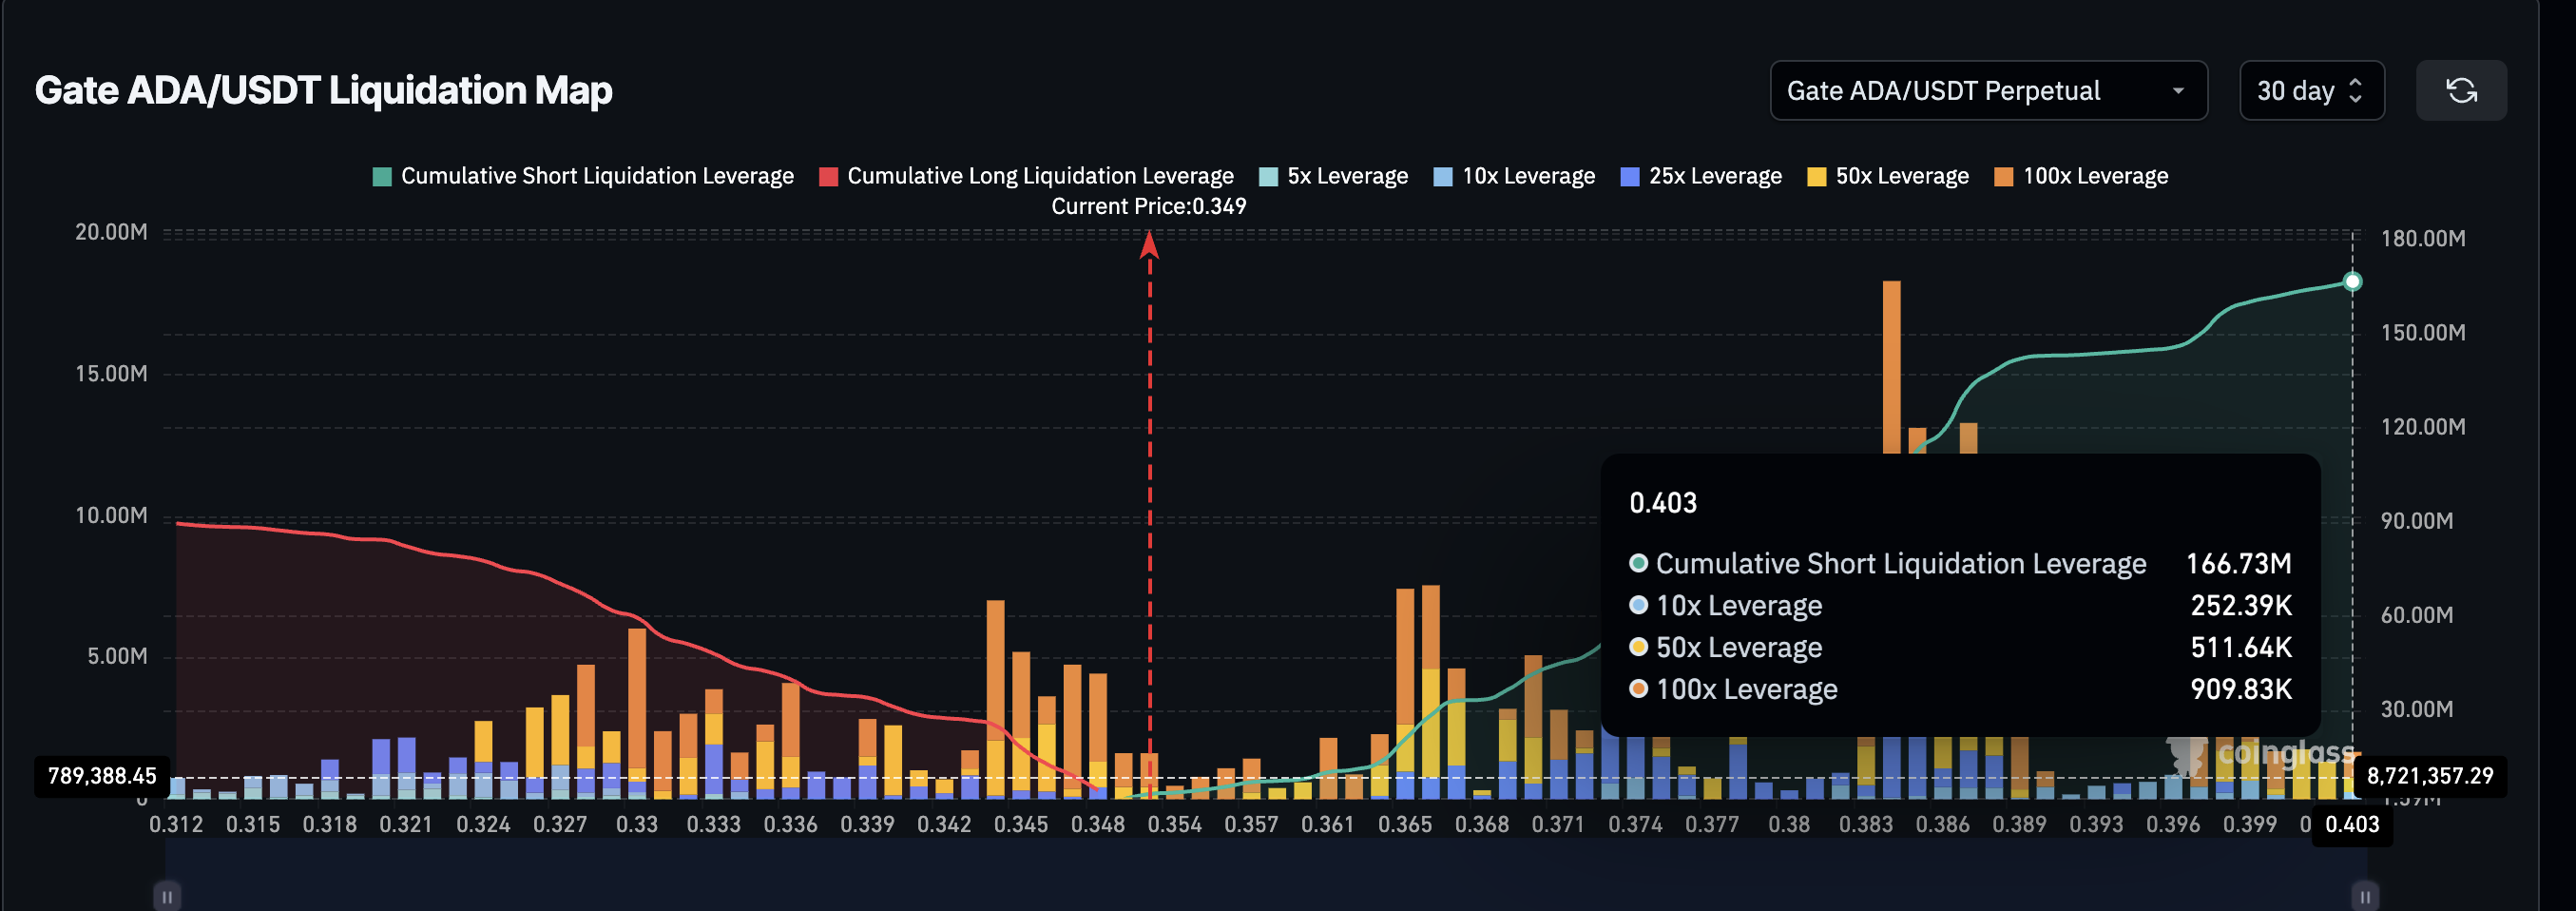 Key Liquidation Clusters: Coinglass
Key price levels define how this plays out.
- $0.374 is the first signal. A move above this level begins pressuring short positions.
- $0.437 is more critical. A break here could unwind all of the existing short leverage.
- $0.543 is the decisive level. It aligns with the upper boundary of the falling wedge. A two-day close above it confirms the breakout and could then activate the 90% projection.
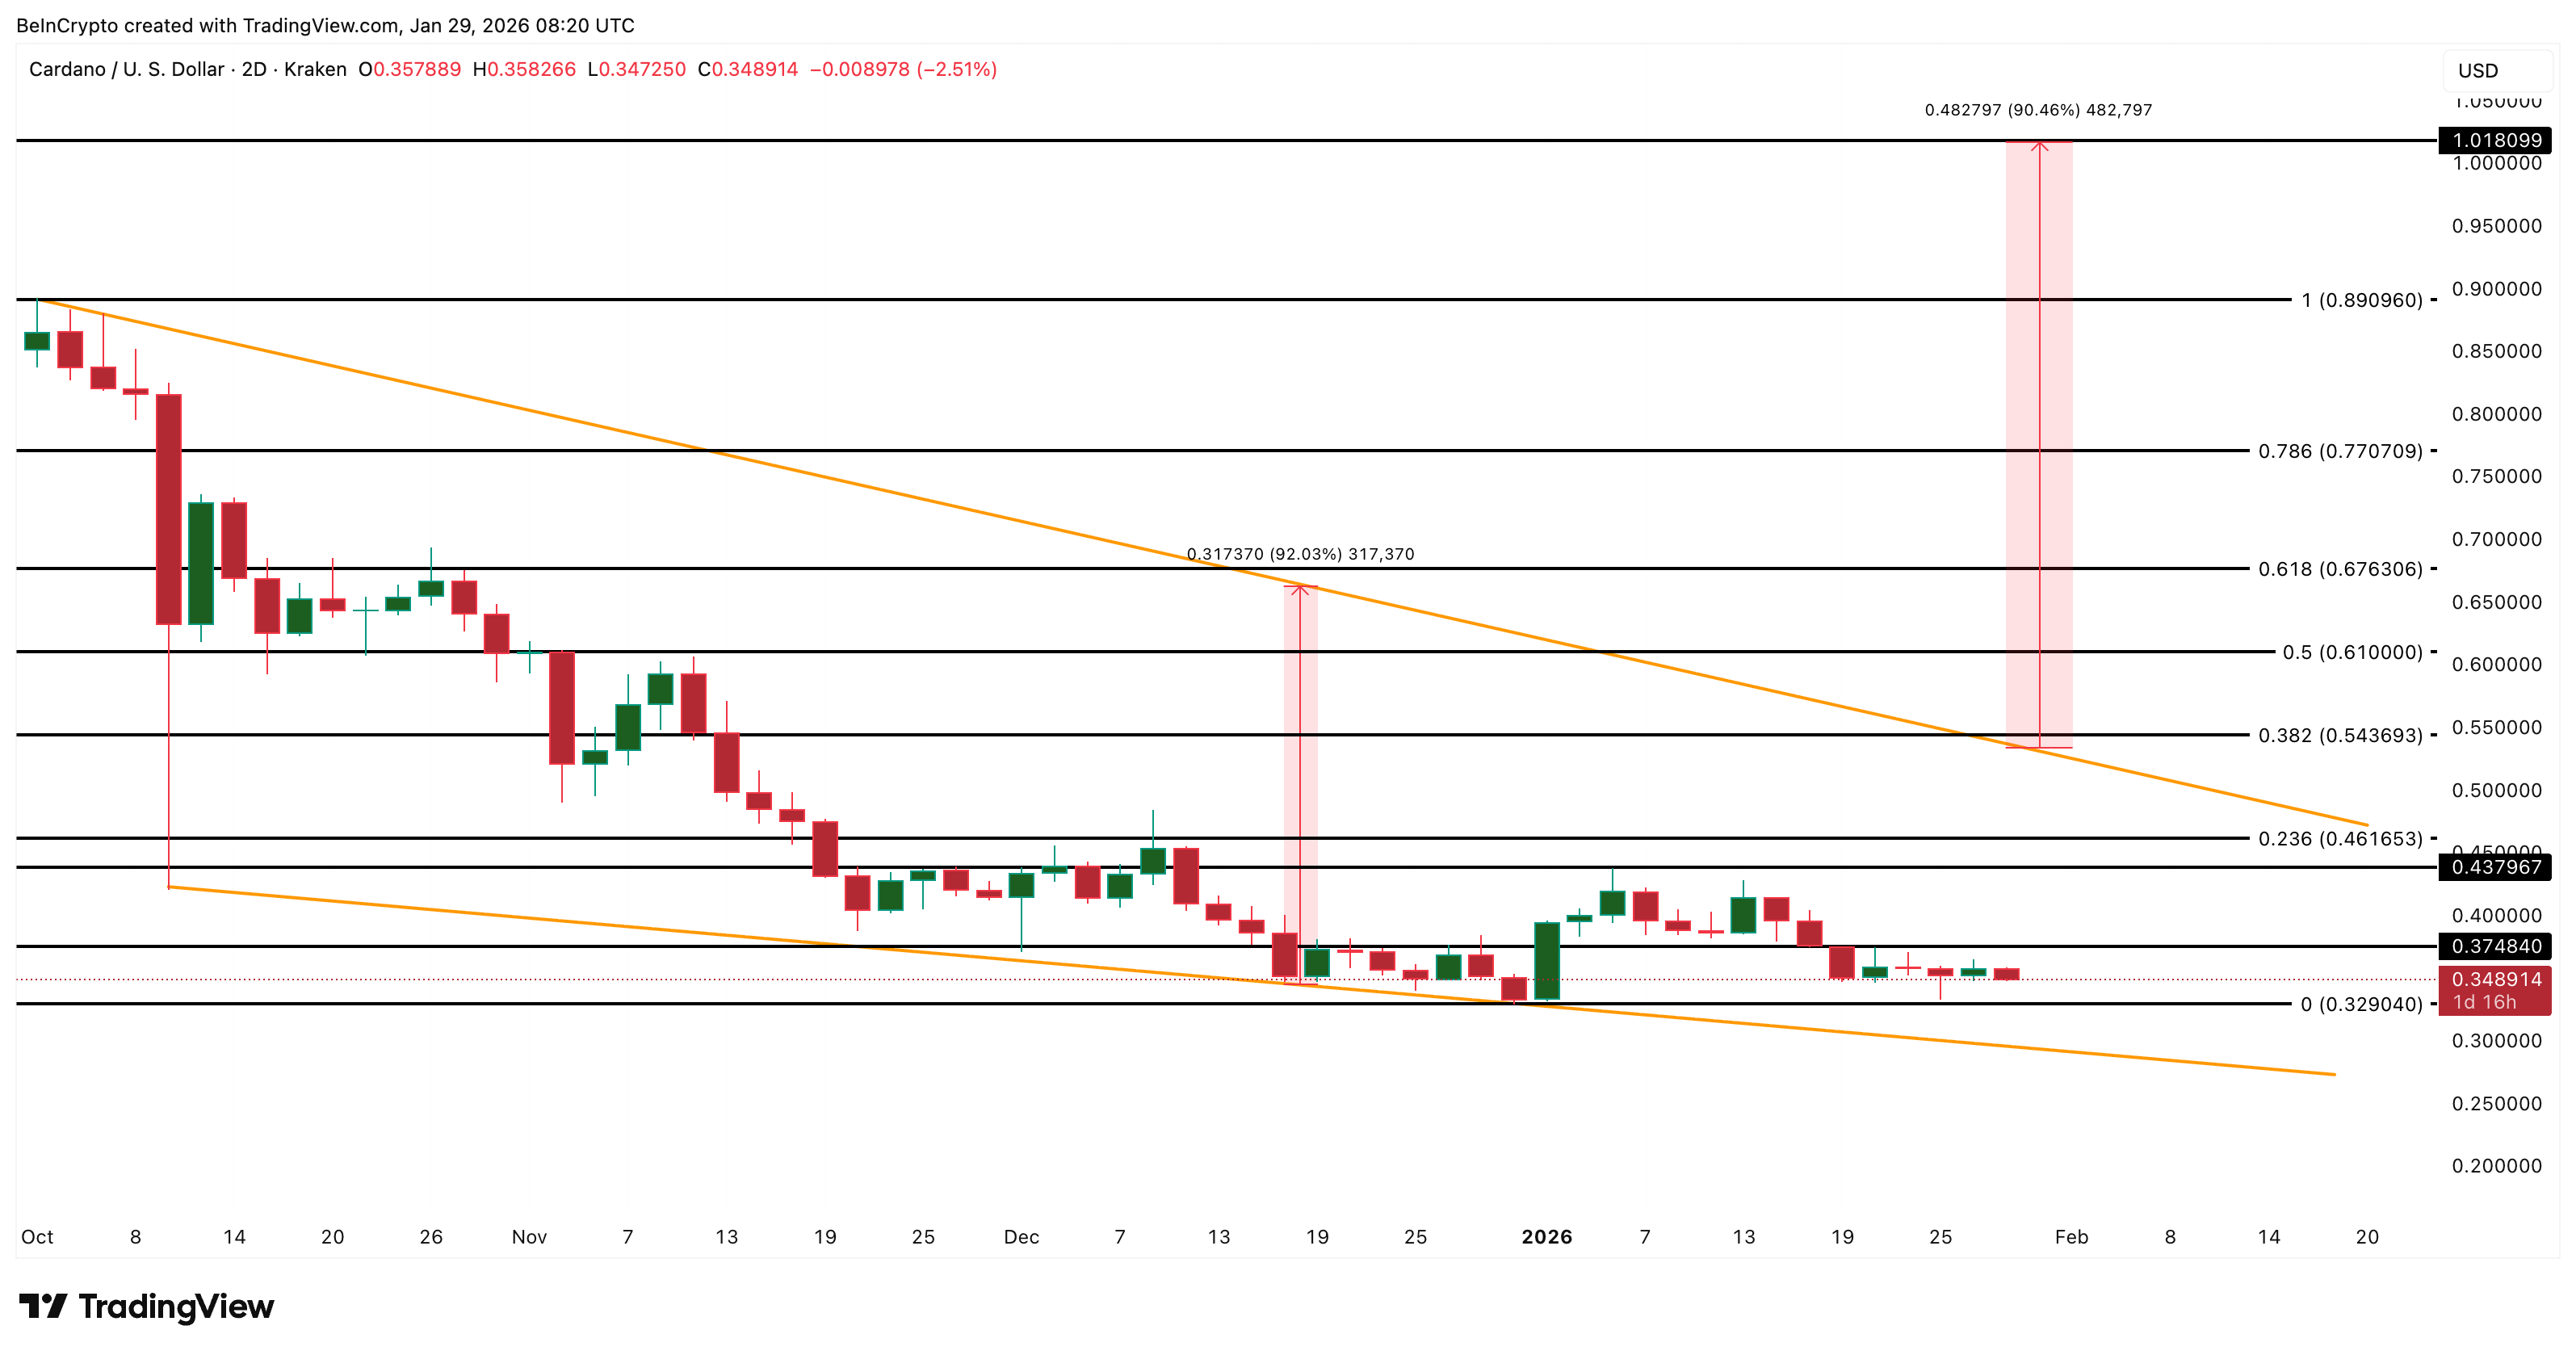 Cardano Price Analysis: TradingView
Risk is equally clear. A two-day close below $0.329 would weaken wedge structure. That outcome could align Cardano with its historically weak February median and invalidate the bullish setup.
Recommended Articles


