

Top Crypto Gainers: Worldcoin, Canton, Jupiter hold gains as the market corrects
- Worldcoin retraces 5% on Thursday from the 100-day EMA, which capped Wednesday’s 25% rally.
- Canton extends gains by 2%, approaching a key resistance level breakout.
- Jupiter stalls near the 50-day EMA after a three-day rally of over 15%.
Worldcoin (WLD), Canton (CC), and Jupiter (JUP) hold gains over the last 24 hours as the broader cryptocurrency market stalls after the US Federal Reserve (Fed) announced keeping the interest rates unchanged on Wednesday. Worldcoin is in a pullback, while Canton and Jupiter are near key resistance levels. Technically, the top gainers over the last 24 hours could reverse as headwinds intensify.
Worldcoin loses momentum after the 25% surge
Worldcoin is down 5% at press time on Thursday, retracing from the 100-day Exponential Moving Average (EMA) after Wednesday's 25% rally. The declining trend in the 50-, 100-, and 200-day EMAs indicates a broader downtrend.
A sustained push below the 50-day EMA at $0.5547 could open room toward the $0.5000 psychological support.
The Moving Average Convergence Divergence (MACD) histogram has turned positive, indicating that the MACD line has crossed above the signal line near zero and suggesting improved momentum. The widening positive histogram supports an early recovery tone. At the same time, the Relative Strength Index (RSI) at 51 is neutral, reflecting a balanced market after recent swings.
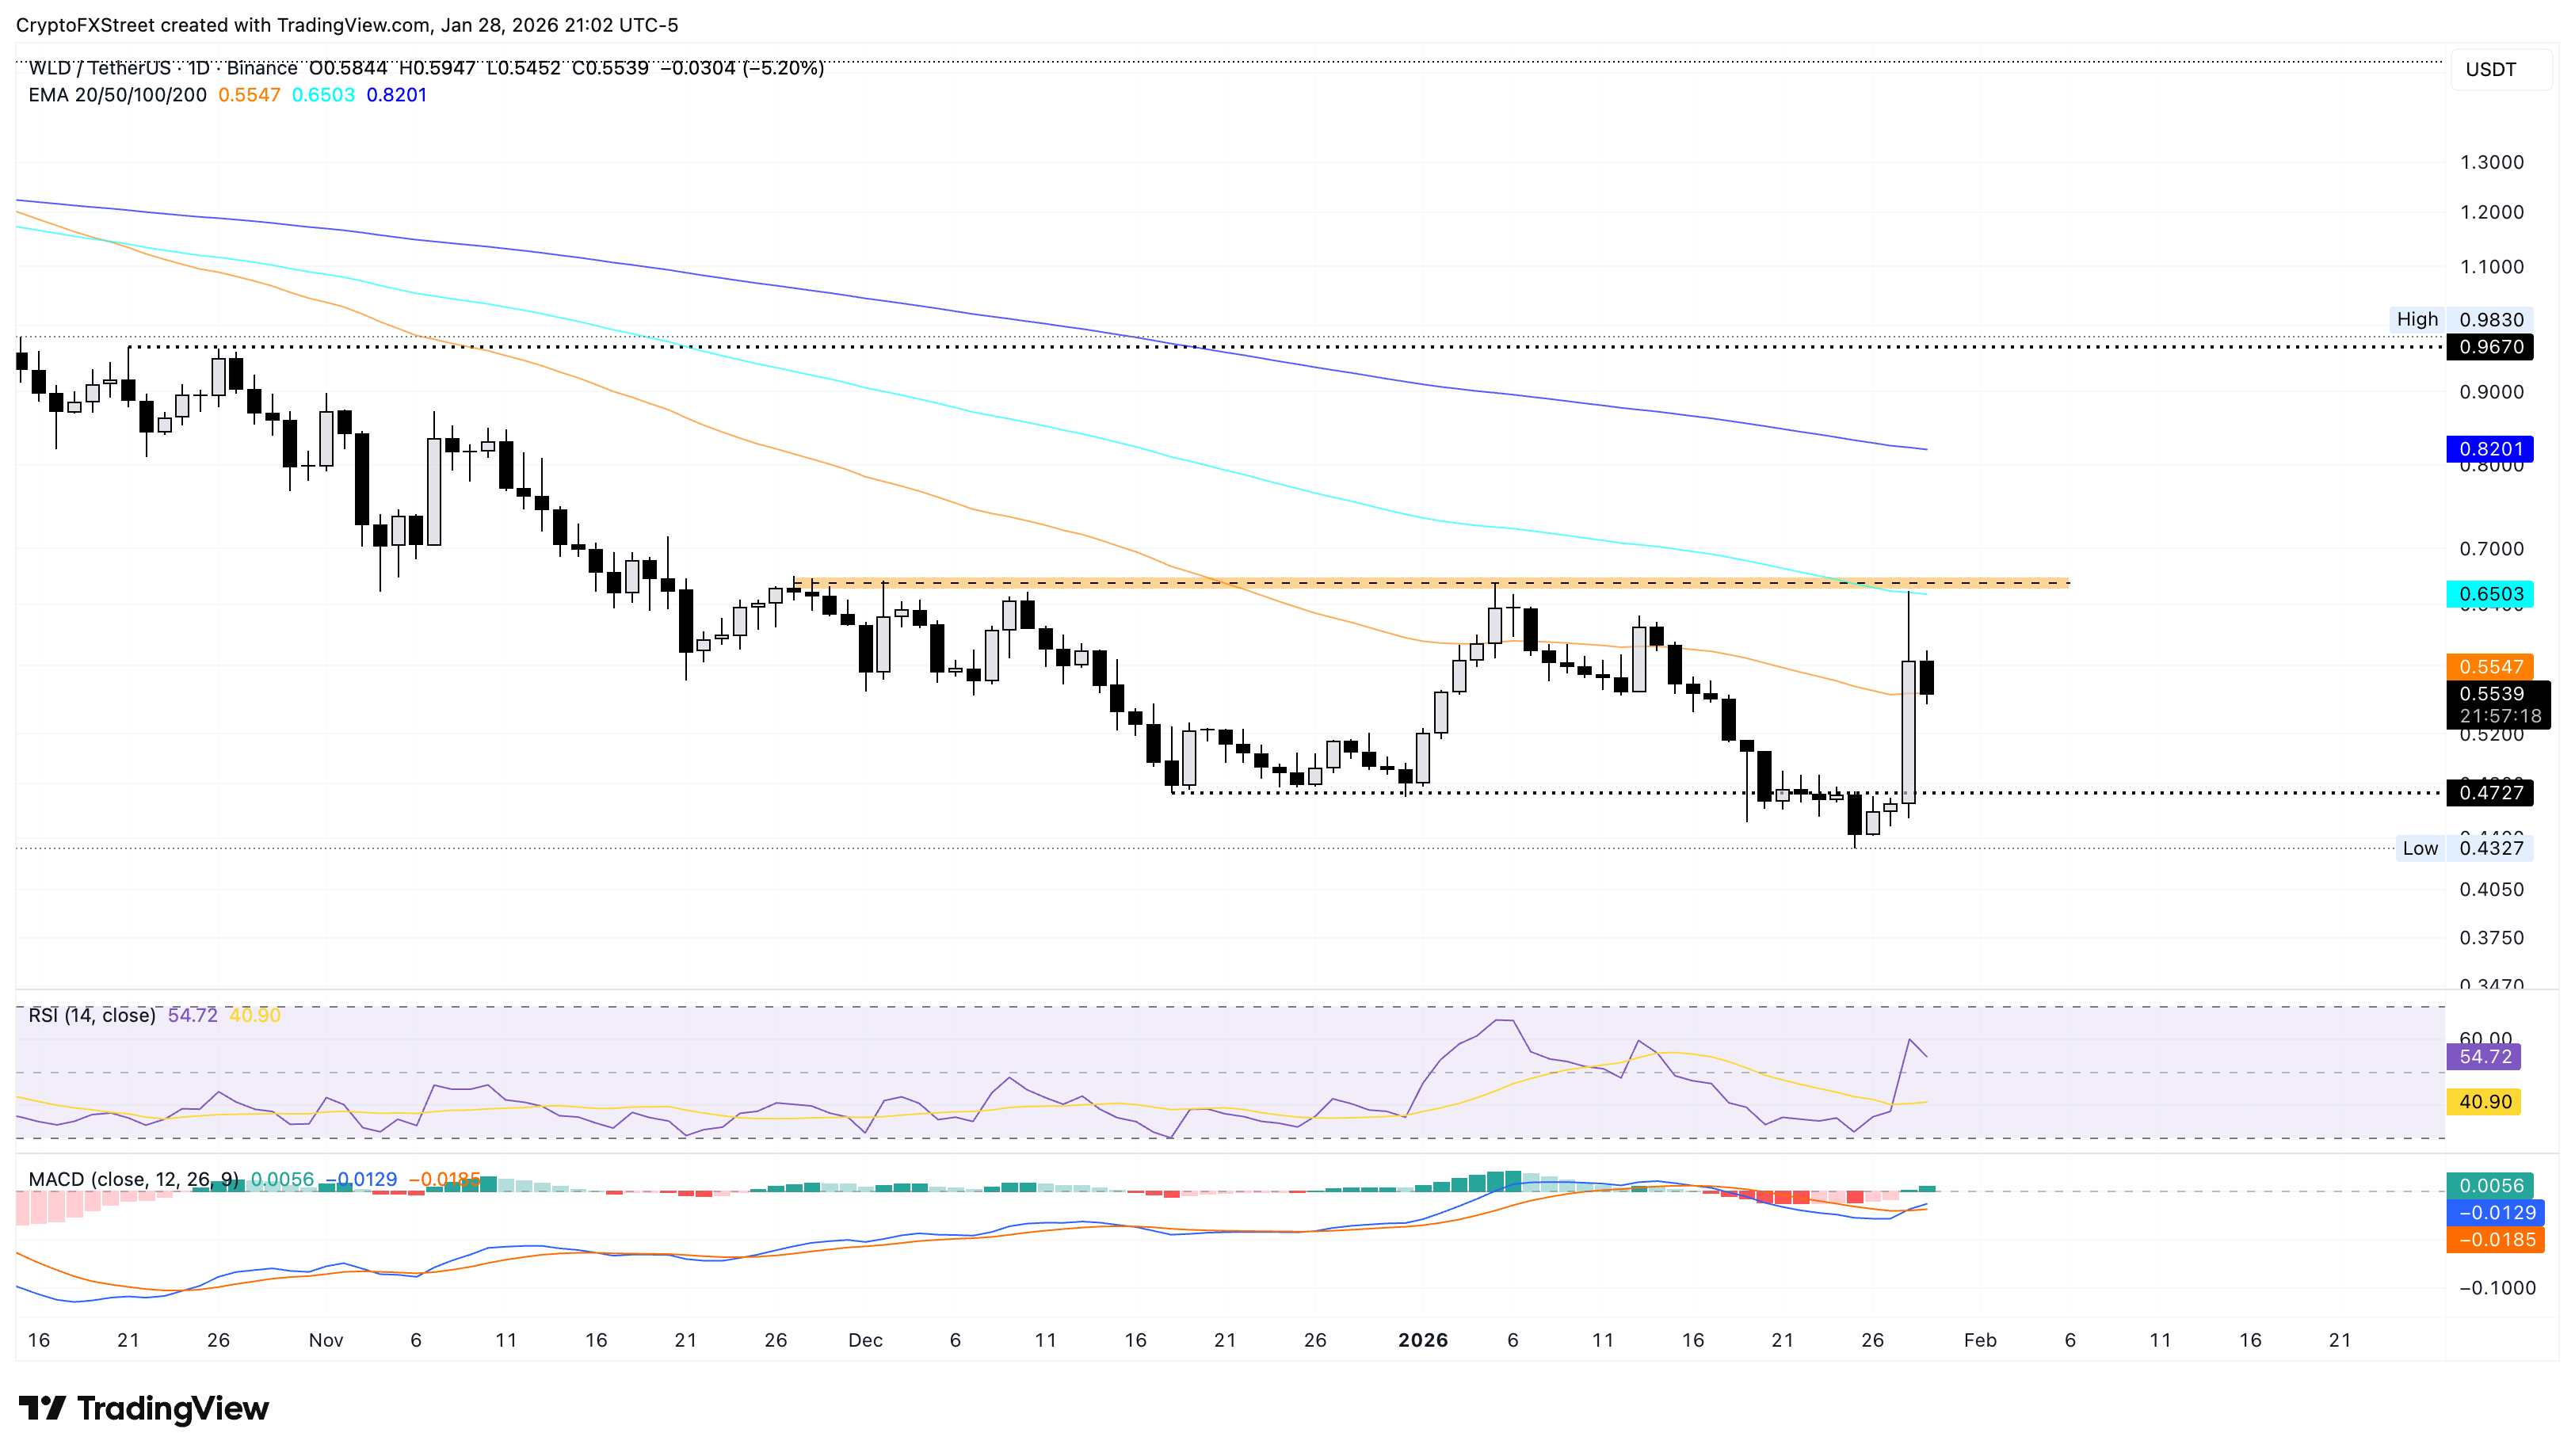
If WLD clears the 100-day EMA at $0.6503, it could extend recovery to the 200-day EMA at $0.8201.
Canton at key resistance targets upside
Canton hovers near a crucial resistance level at $0.1624, coinciding with the January 2 high. At the time of writing, CC edges higher by 2% on Thursday, building on the 2% rise from Wednesday.
If CC clears this level with a sustained daily close, the upside bias would likely target the R1 Pivot Point at $0.1855.
The RSI is broadly moving flat at 62, indicating consistent buying pressure and further upside before reaching the overbought zone. The uptrending MACD and signal line remain above zero, with green histogram bars widening, indicating steady bullish momentum.
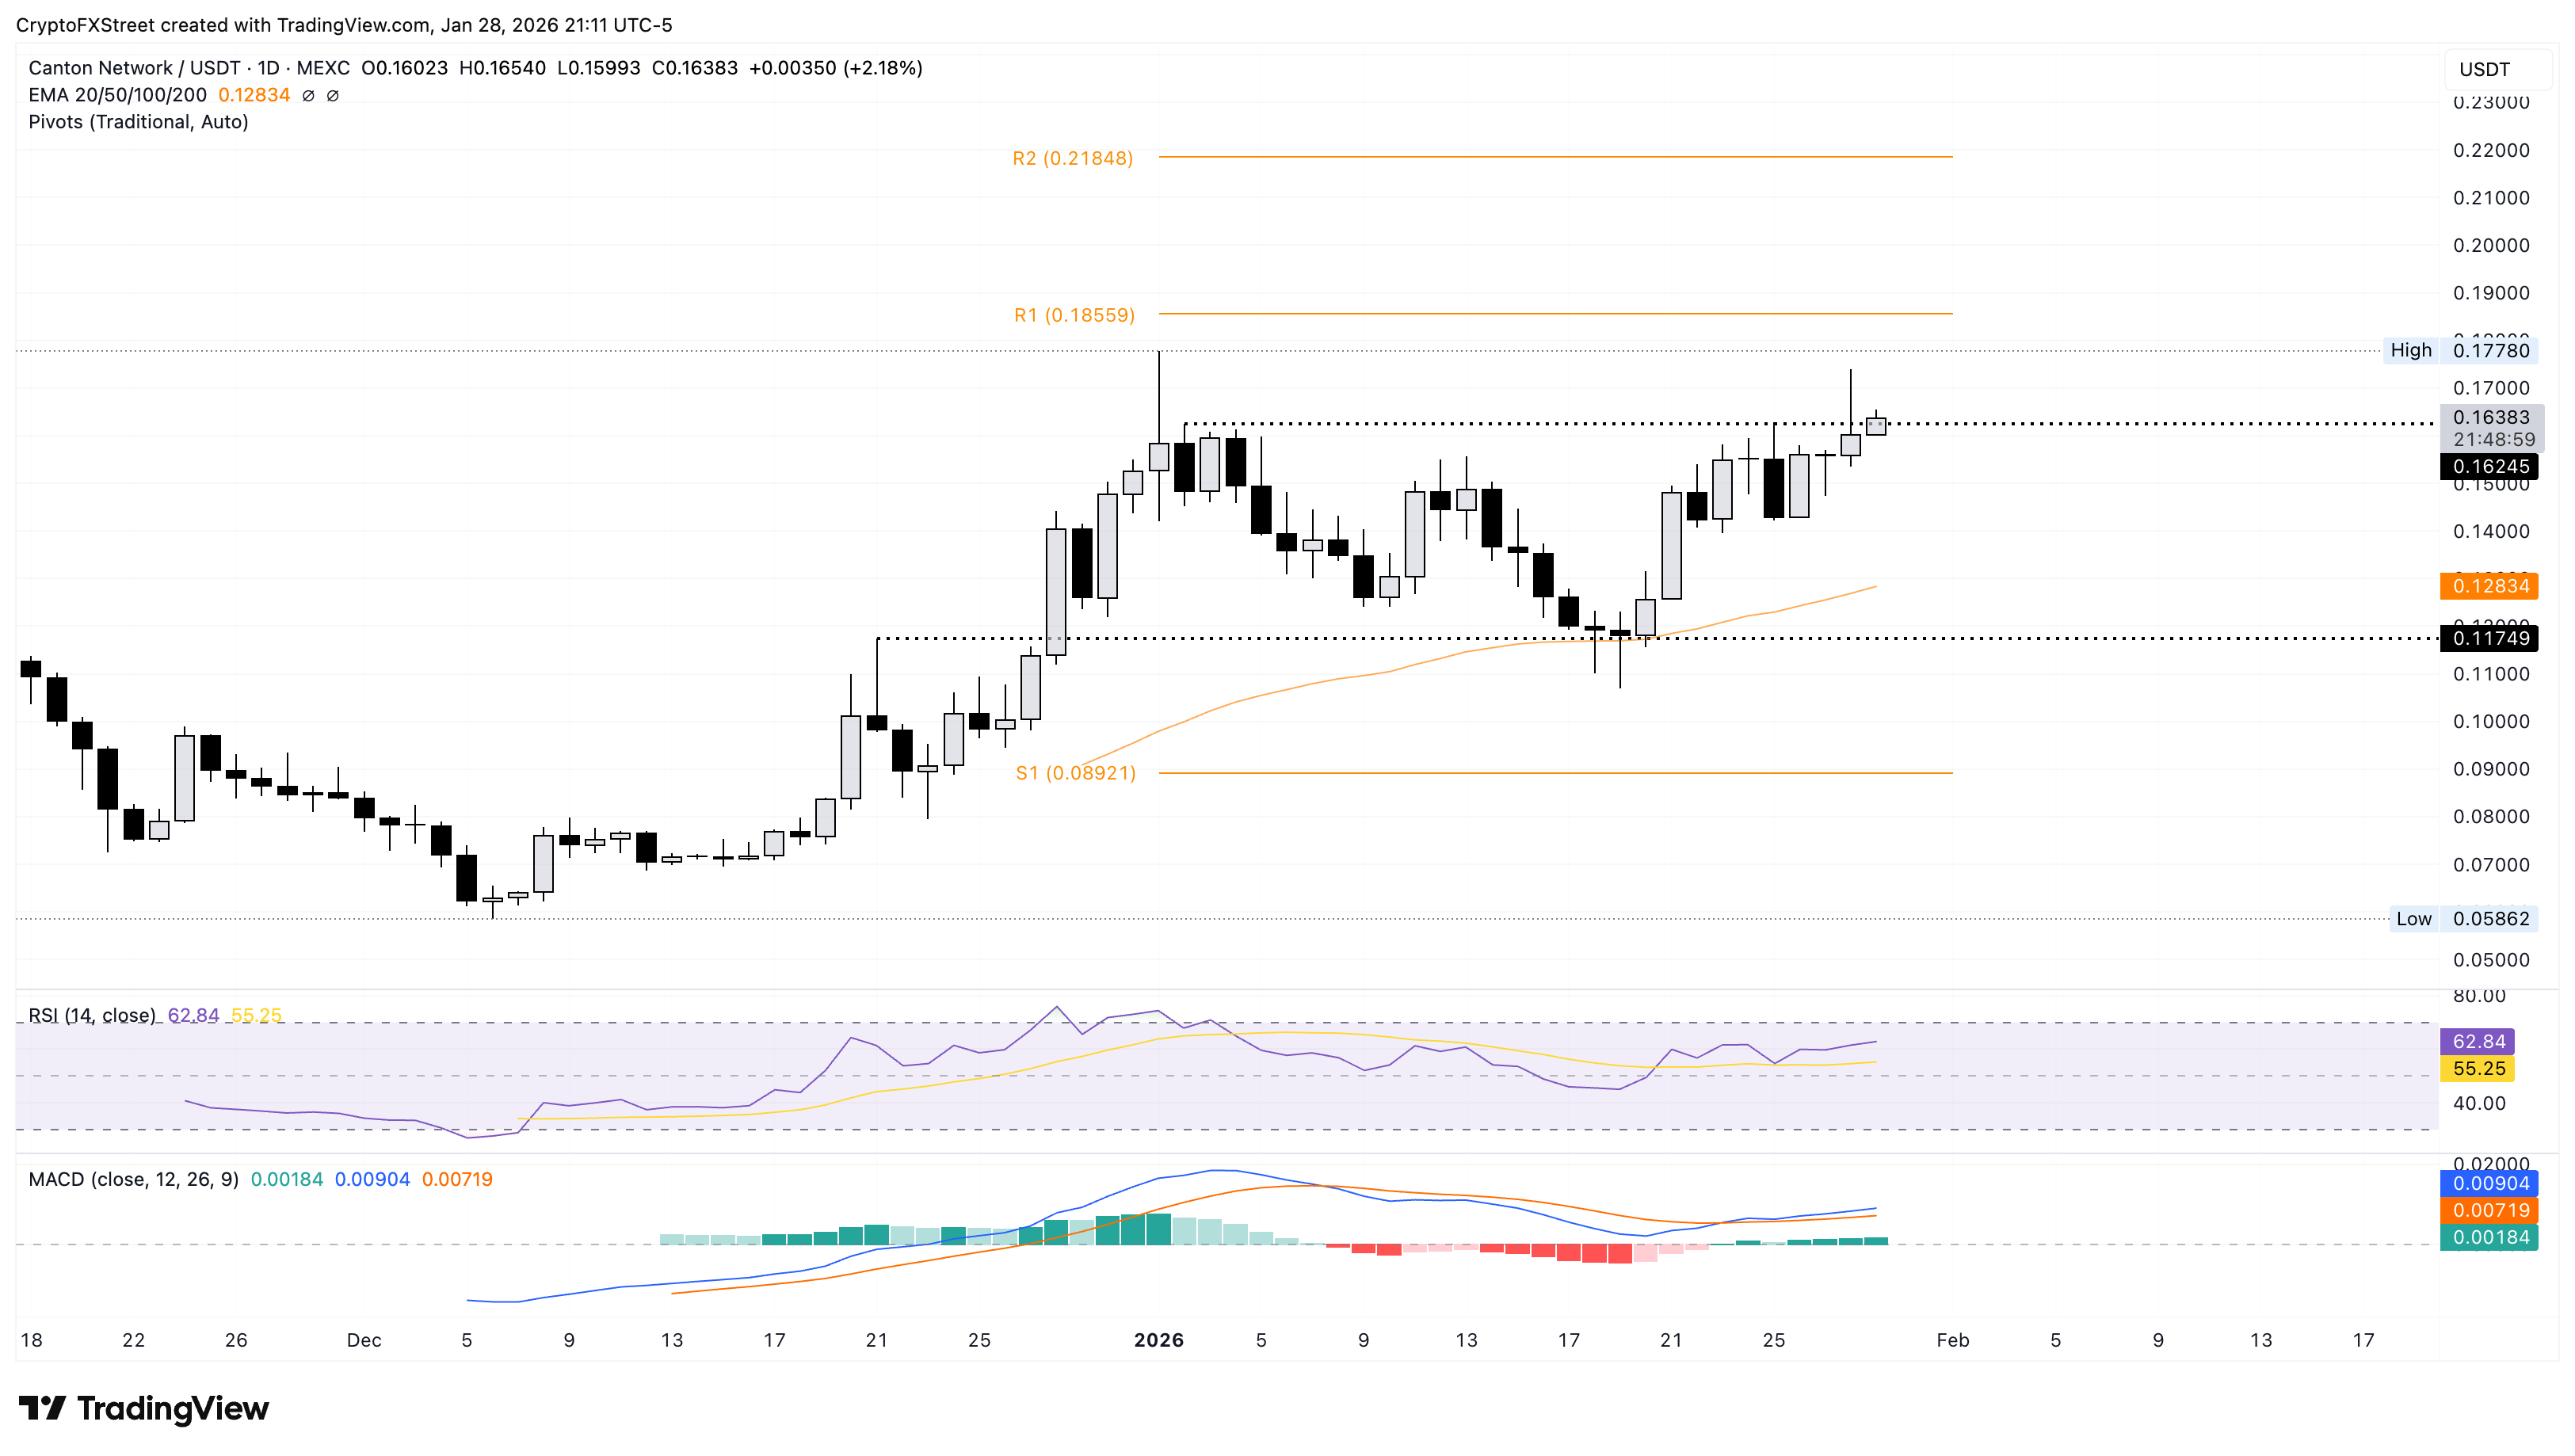
On the flip side, if Canton slips below the $0.1500 round figure, the 50-day EMA at $0.1283 would serve as a key support.
Jupiter rally halts at the 50-day EMA
Jupiter faces opposition at the 50-day EMA at $0.2174 after a three-day rally of 16% earlier this week. At press time, JUP is down nearly 1% on Thursday as headwinds at the 50-day EMA intensify.
A potential bearish close to the day could risk a revisit to the $0.2000 psychological level.
The MACD indicator generates a buy signal with a bullish crossover of the average lines. At the same time, the Relative Strength Index (RSI) at 54 is shifting upward of the neutral zone, reflecting the renewed buying pressure from the three-day rally.
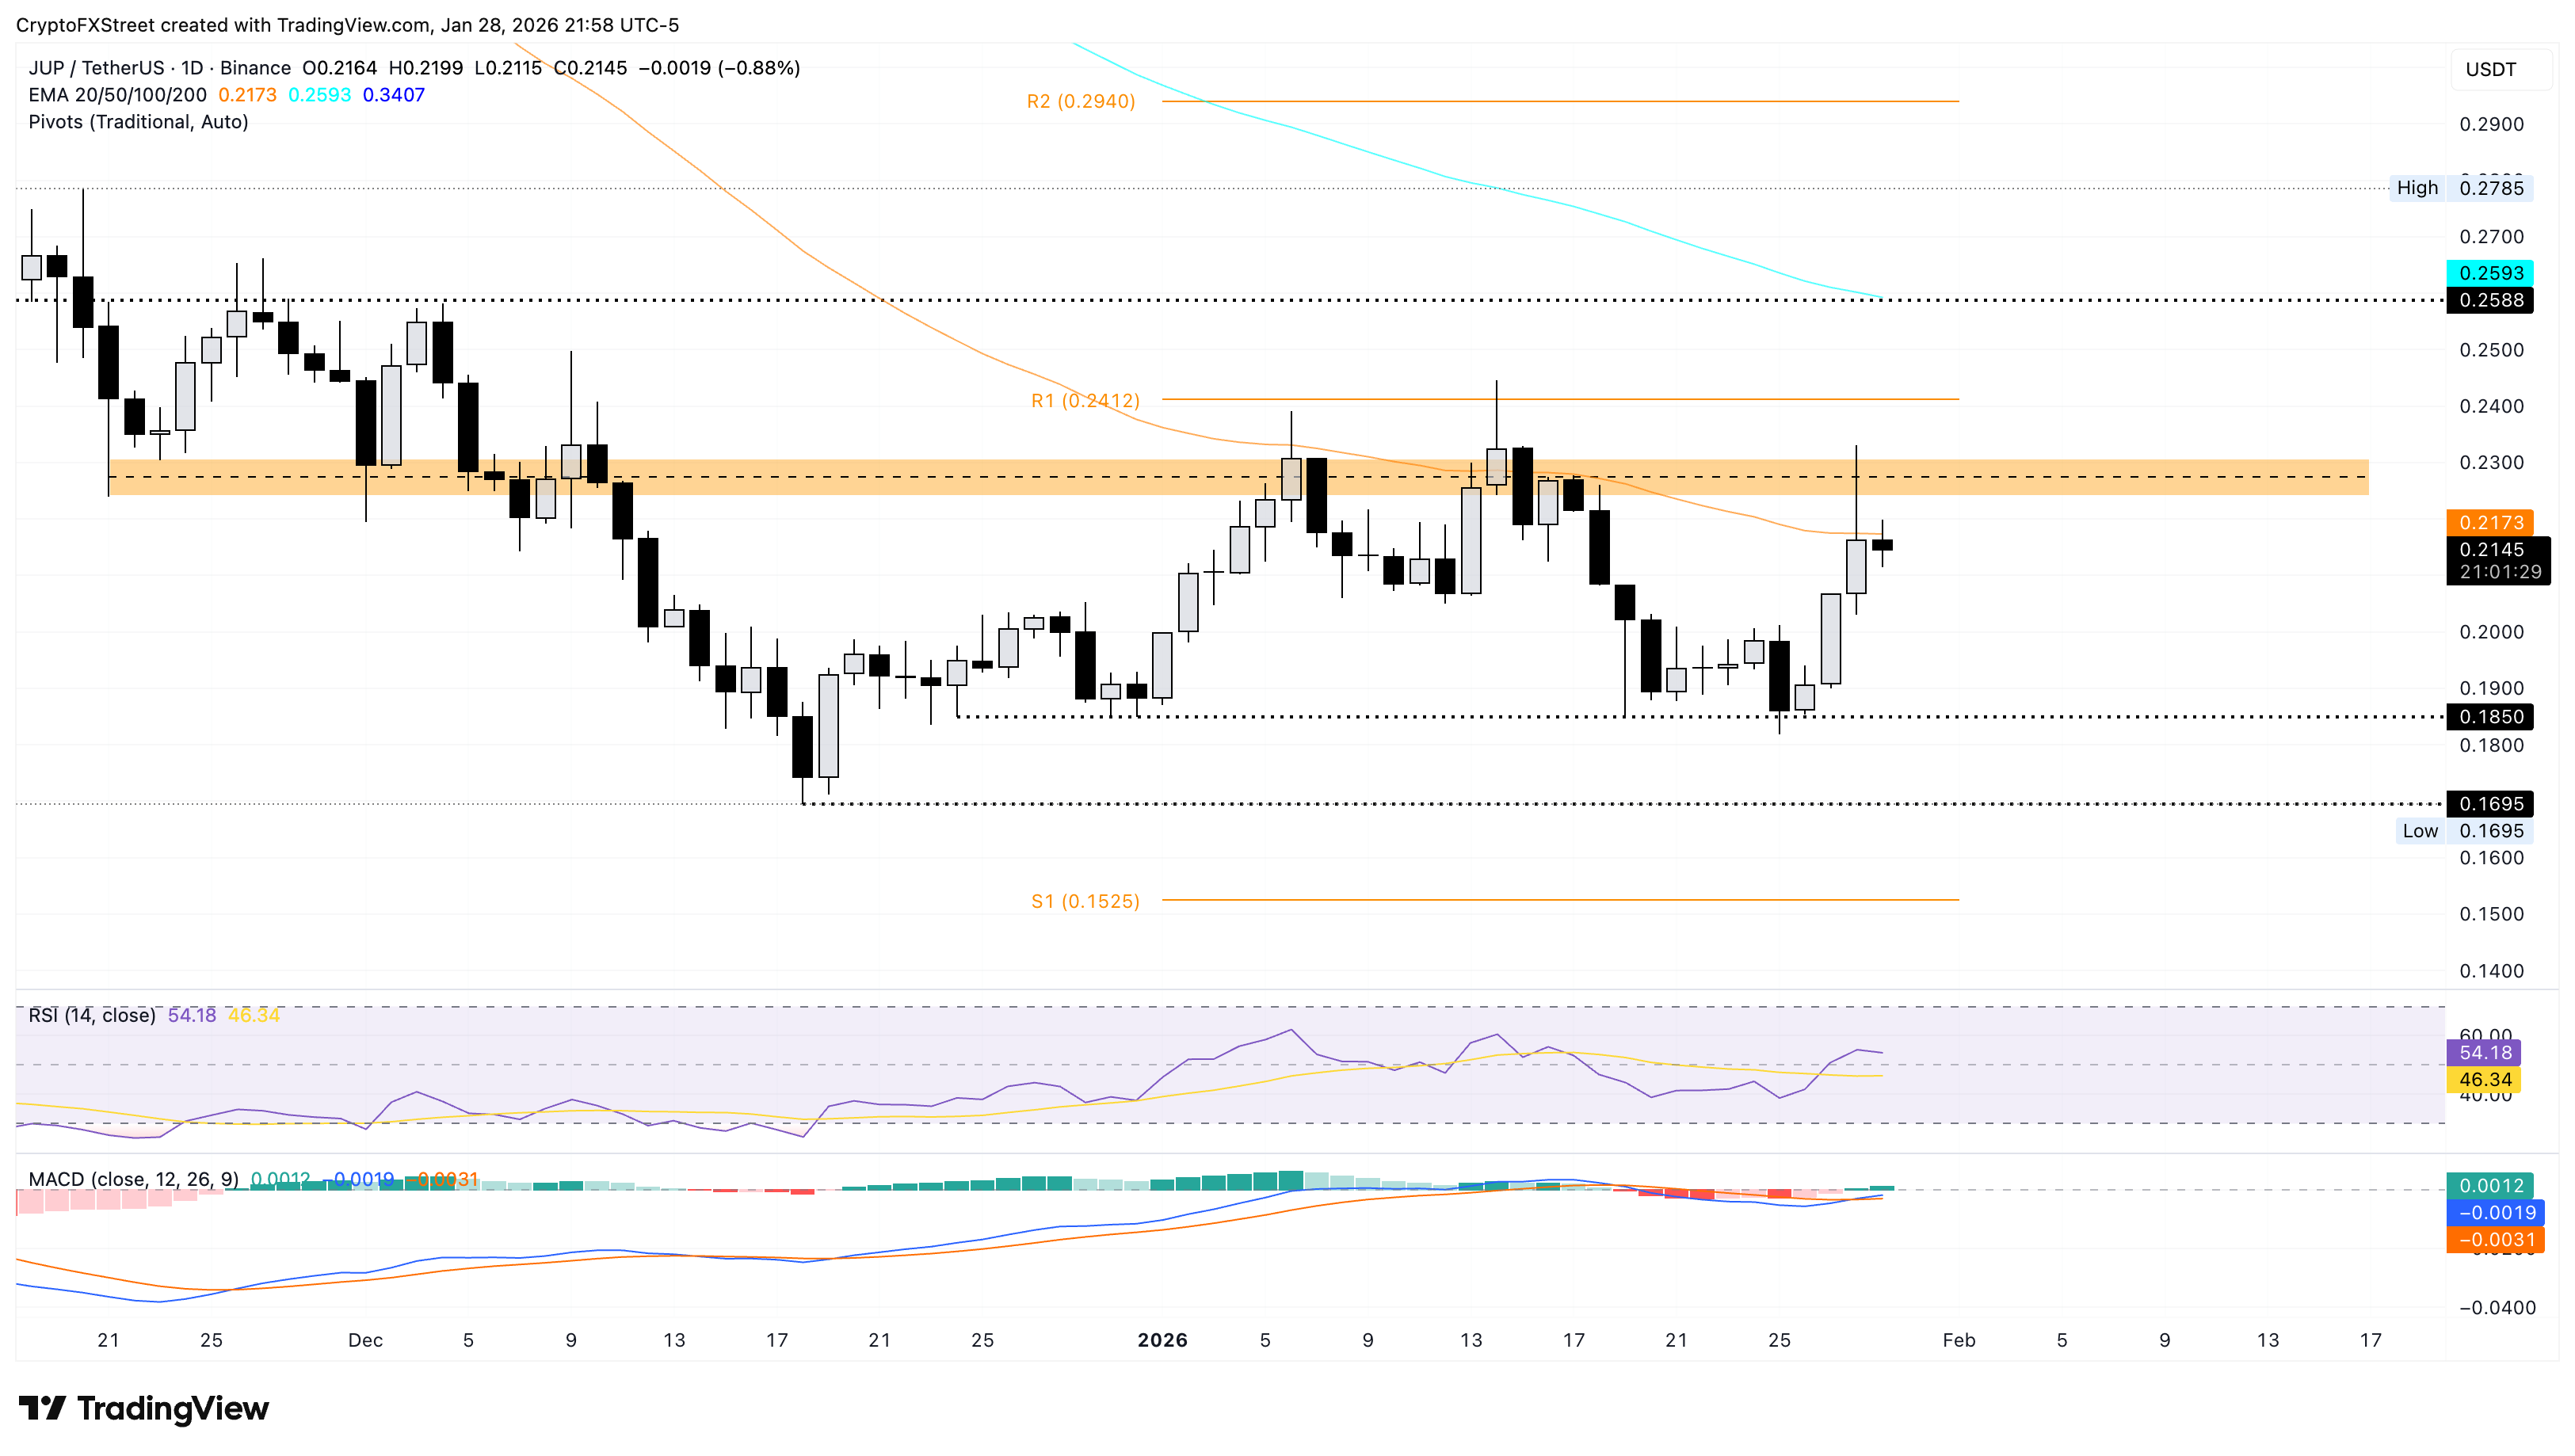
If JUP clears the 50-day EMA, a deeper resistance at the $0.2240-$0.2308 zone could limit the upside.
(The technical analysis of Worldcoin was written with the help of an AI tool.)
Recommended Articles


