


XRP Price Eyes a Domino Effect to Relive the $3.30 Dream – Here’s How
XRP price is up around 1% over the past 24 hours, but that move alone means very little. What matters more is what is happening underneath the surface.
Short-term traders are exiting, medium-term holders are stepping in, and XRP ETF flows have quietly turned positive again. Together, these shifts are setting up a potential domino effect, where one small technical trigger could lead to a much larger move. Possibly to a level that XRP claimed last year.
Conviction Is Replacing Speculation as XRP Holders Shift
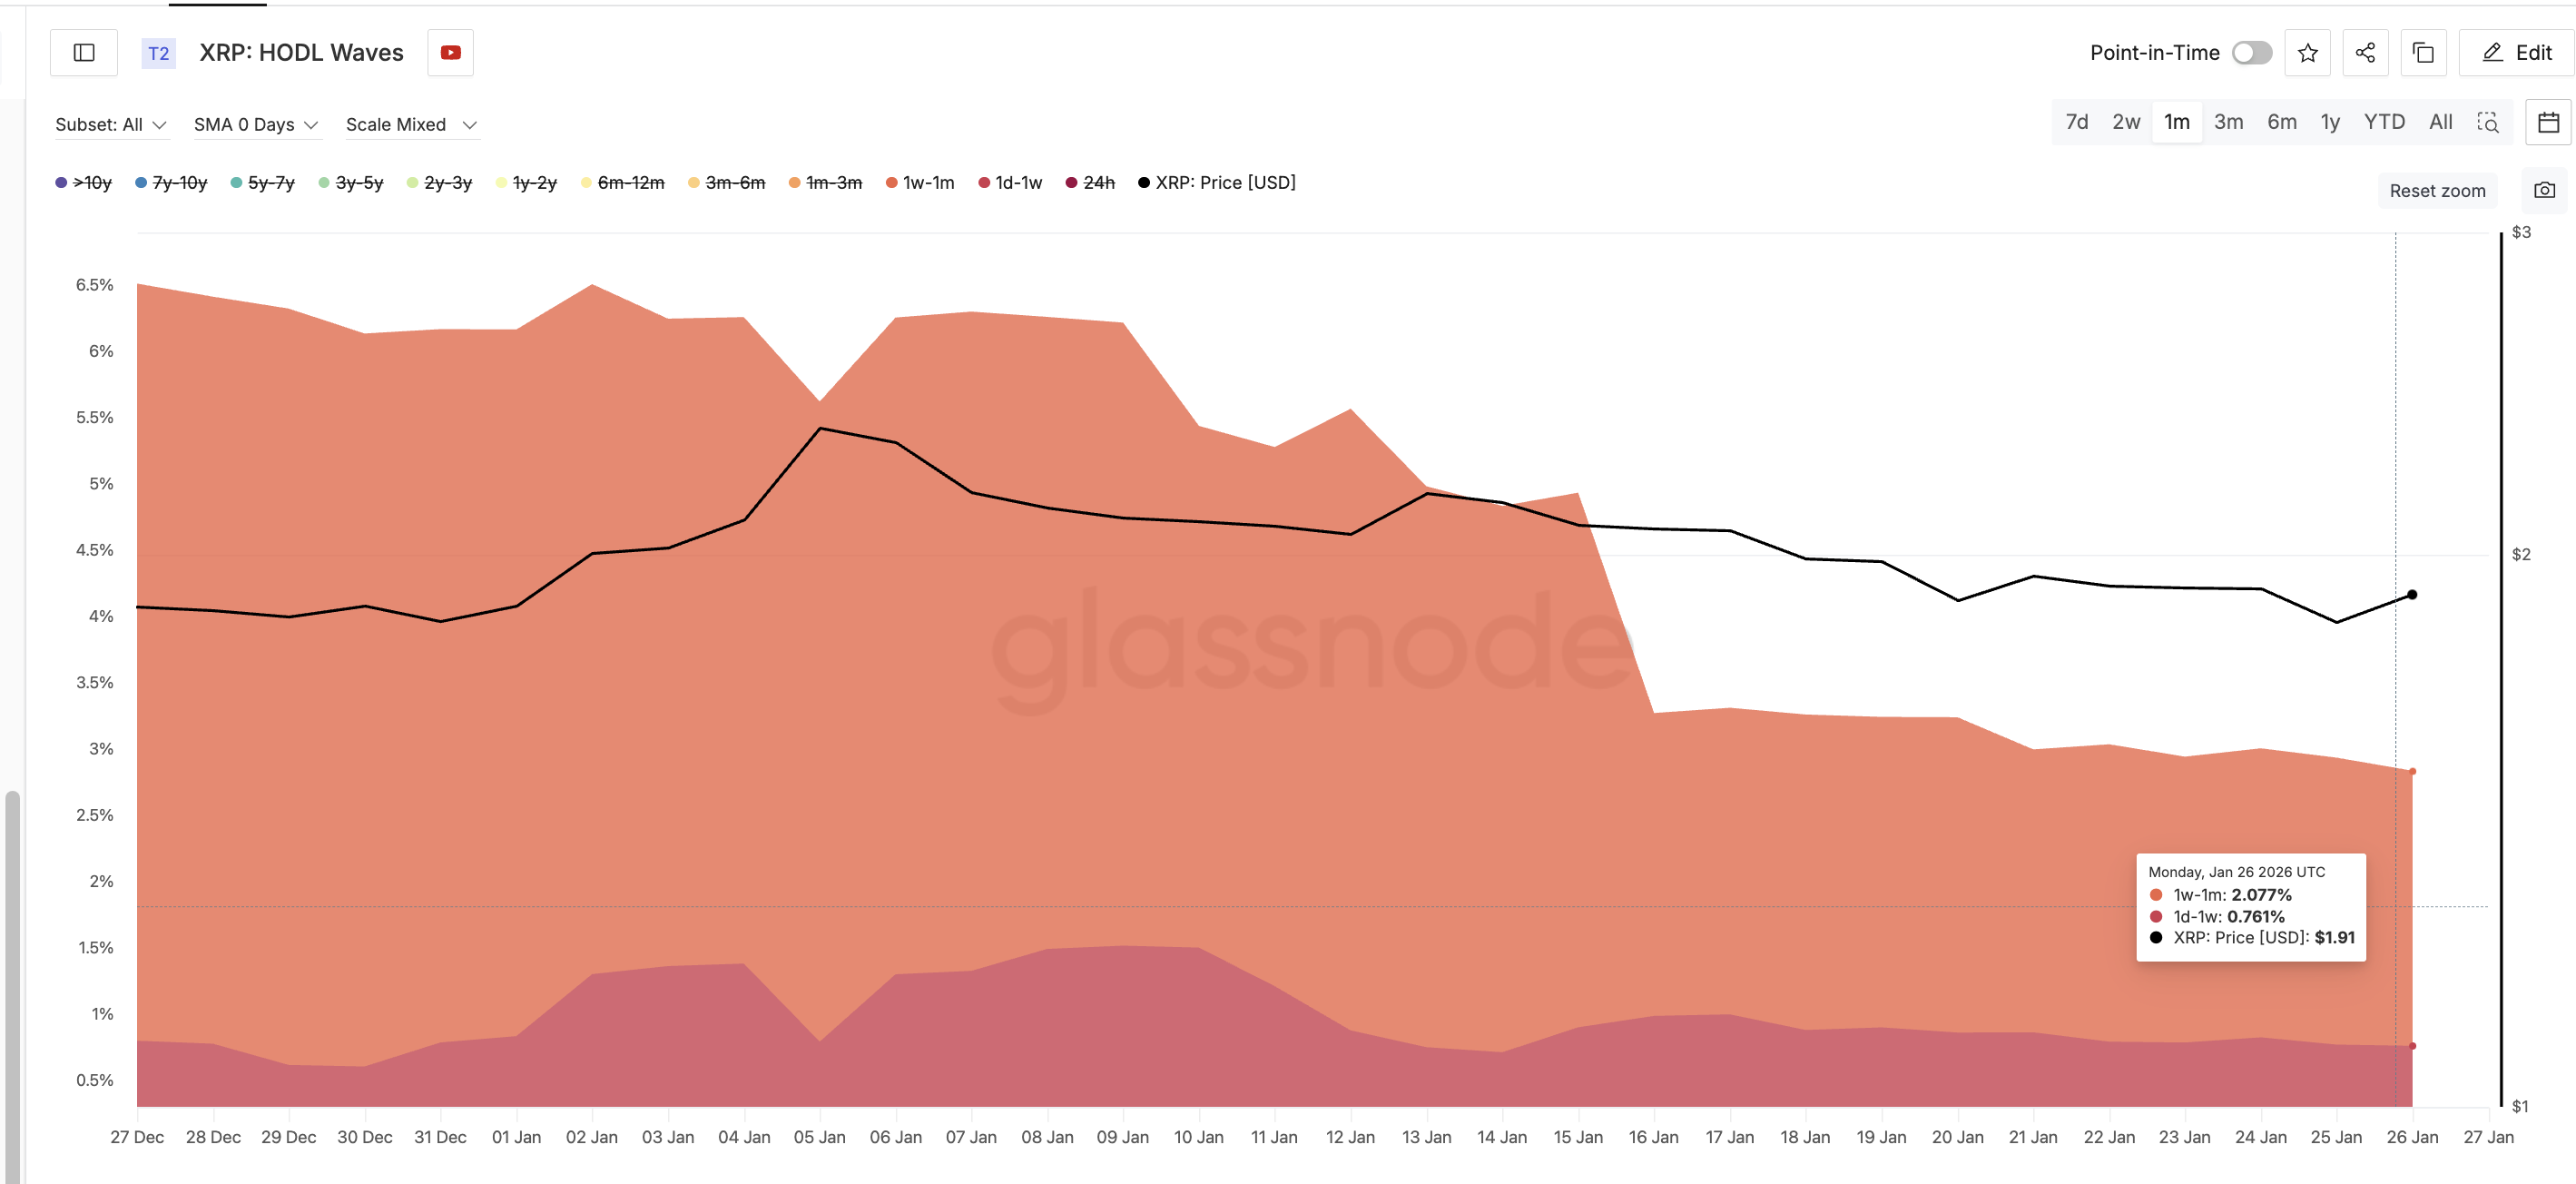
One of the clearest changes is visible in XRP’s HODL waves. The HODL Waves metric shows how long coins have been held, helping separate short-term traders from long-term conviction holders.
Over the past month, speculative supply has dropped sharply. Holders in the 1-day to 1-week group fell from about 1.5% of supply to 0.76% between January 9 and January 26.
The 1-week to 1-month group dropped from 5.71% to roughly 2.07%, month-on-month, starting December 27. At the same time, longer-term holders are doing the opposite.
 Speculative Money Leaves: Glassnode
Want more token insights like this? Sign up for Editor Harsh Notariya’s Daily Crypto Newsletter here.
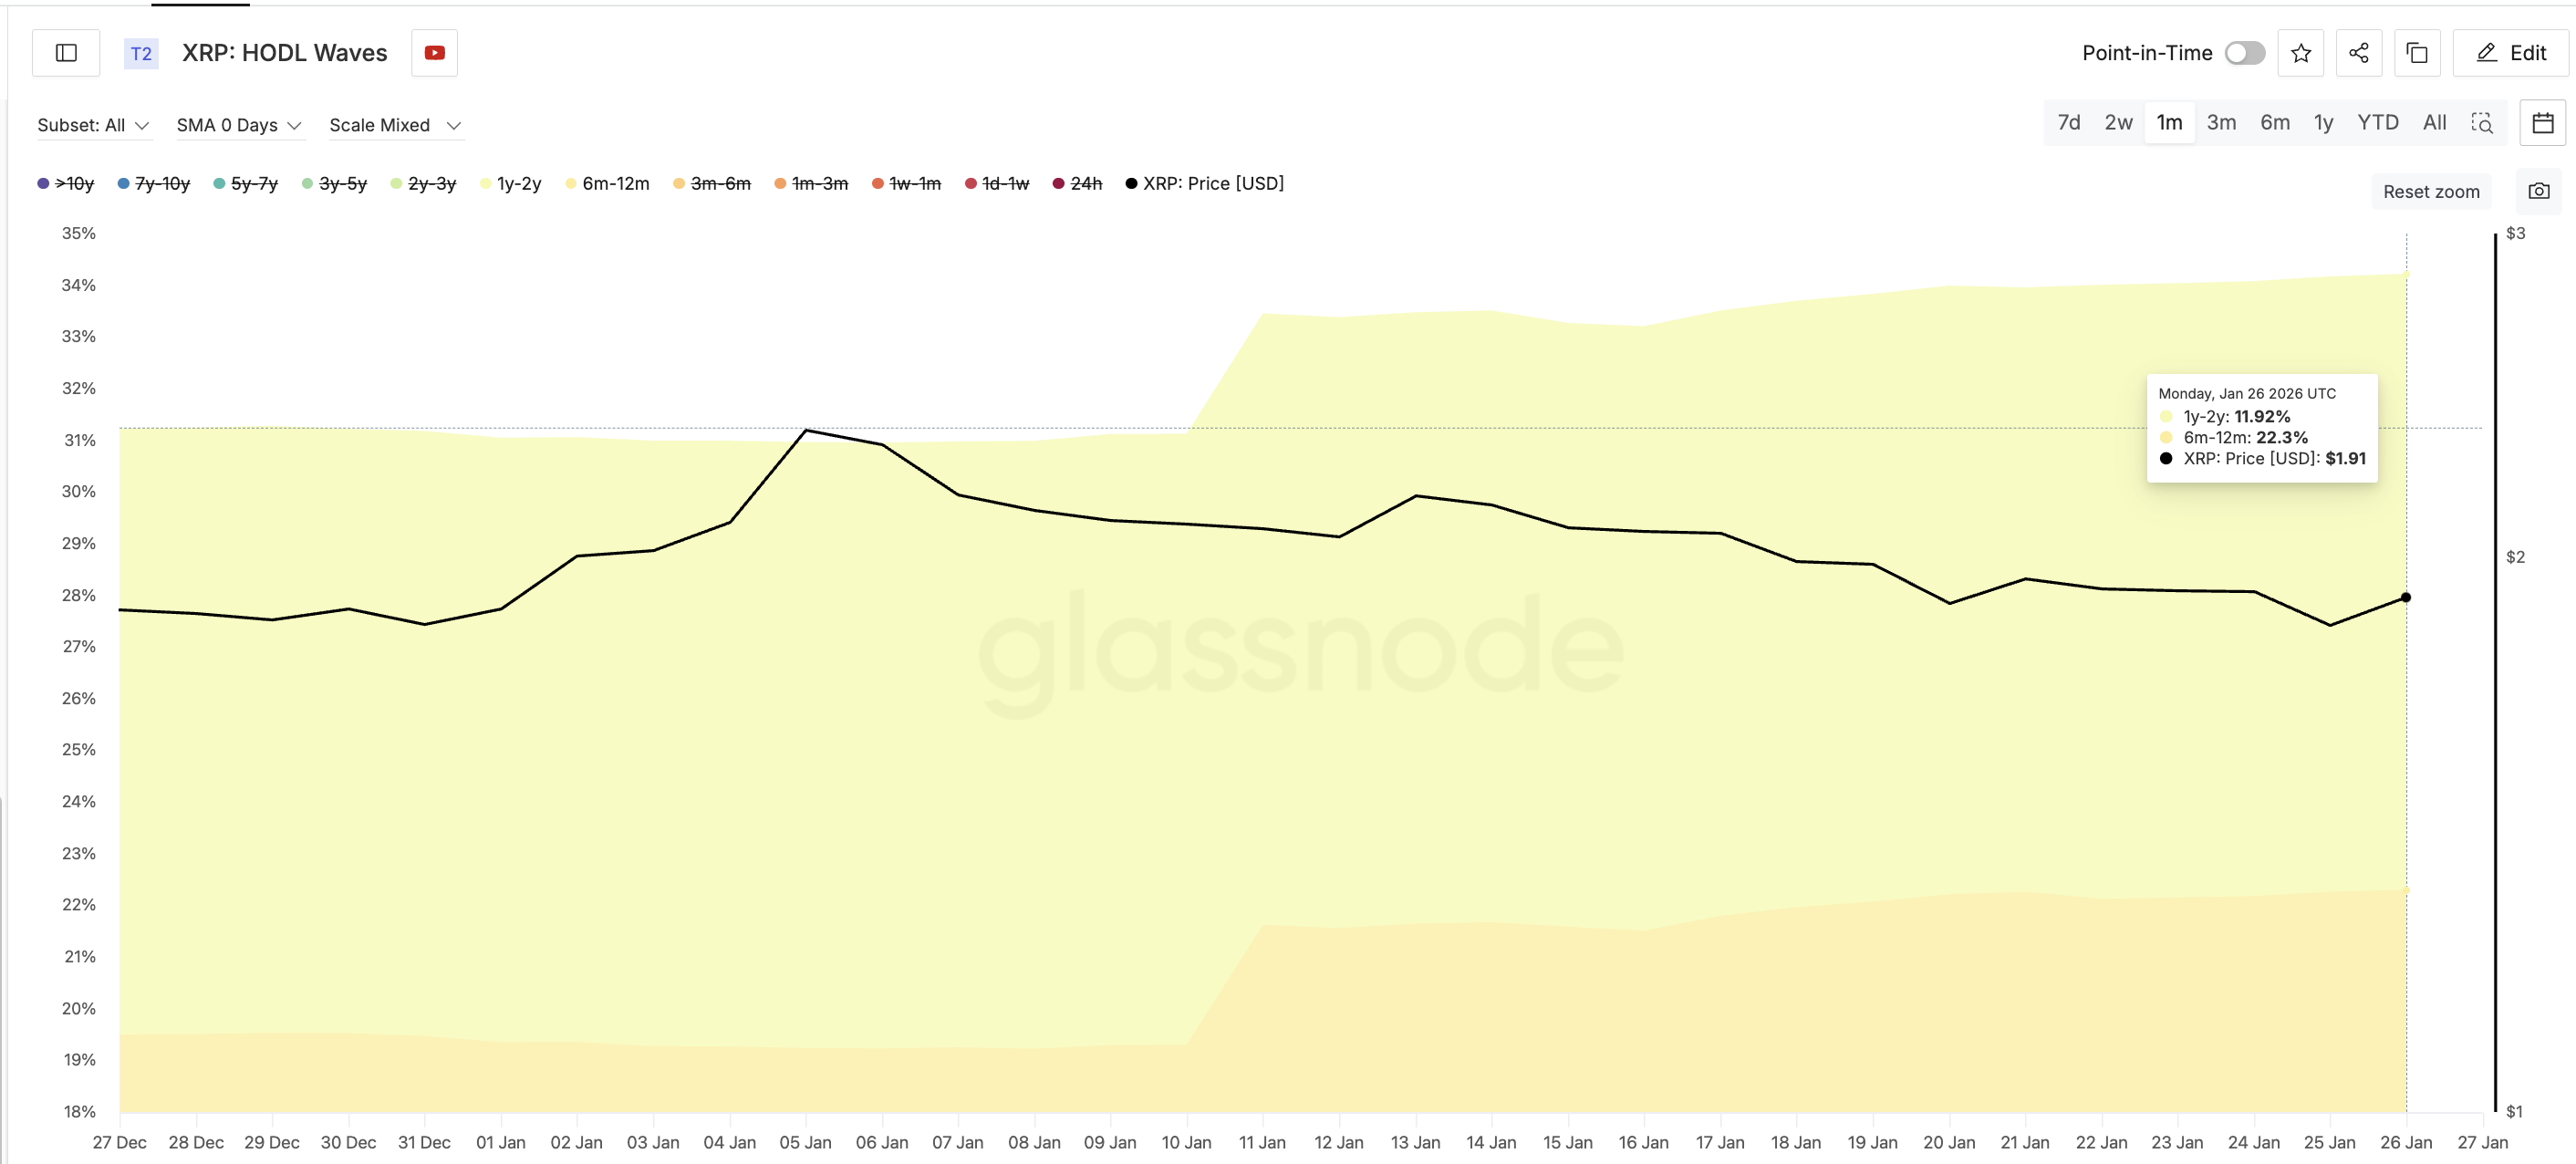
The 6-month to 12-month cohort increased from 19.5% to 22.3%. Additionally, the 1-year to 2-year group also ticked higher, from 11.73% to 11.92%.
 Mid-And-Long Term Holders Enter XRP: Glassnode
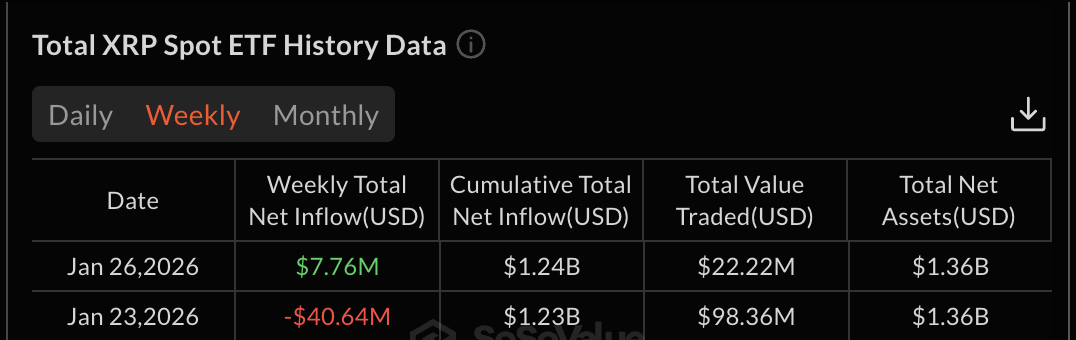
This matters because speculative money usually exits near local lows, while conviction money tends to build positions quietly. XRP ETF flows, one of the biggest conviction metrics, support this view. After ending last week in net outflows, the current week has started positively, with fresh inflows returning.
 XRP ETFs: SoSo Value
In simple terms, fast money is leaving, patient money is arriving.
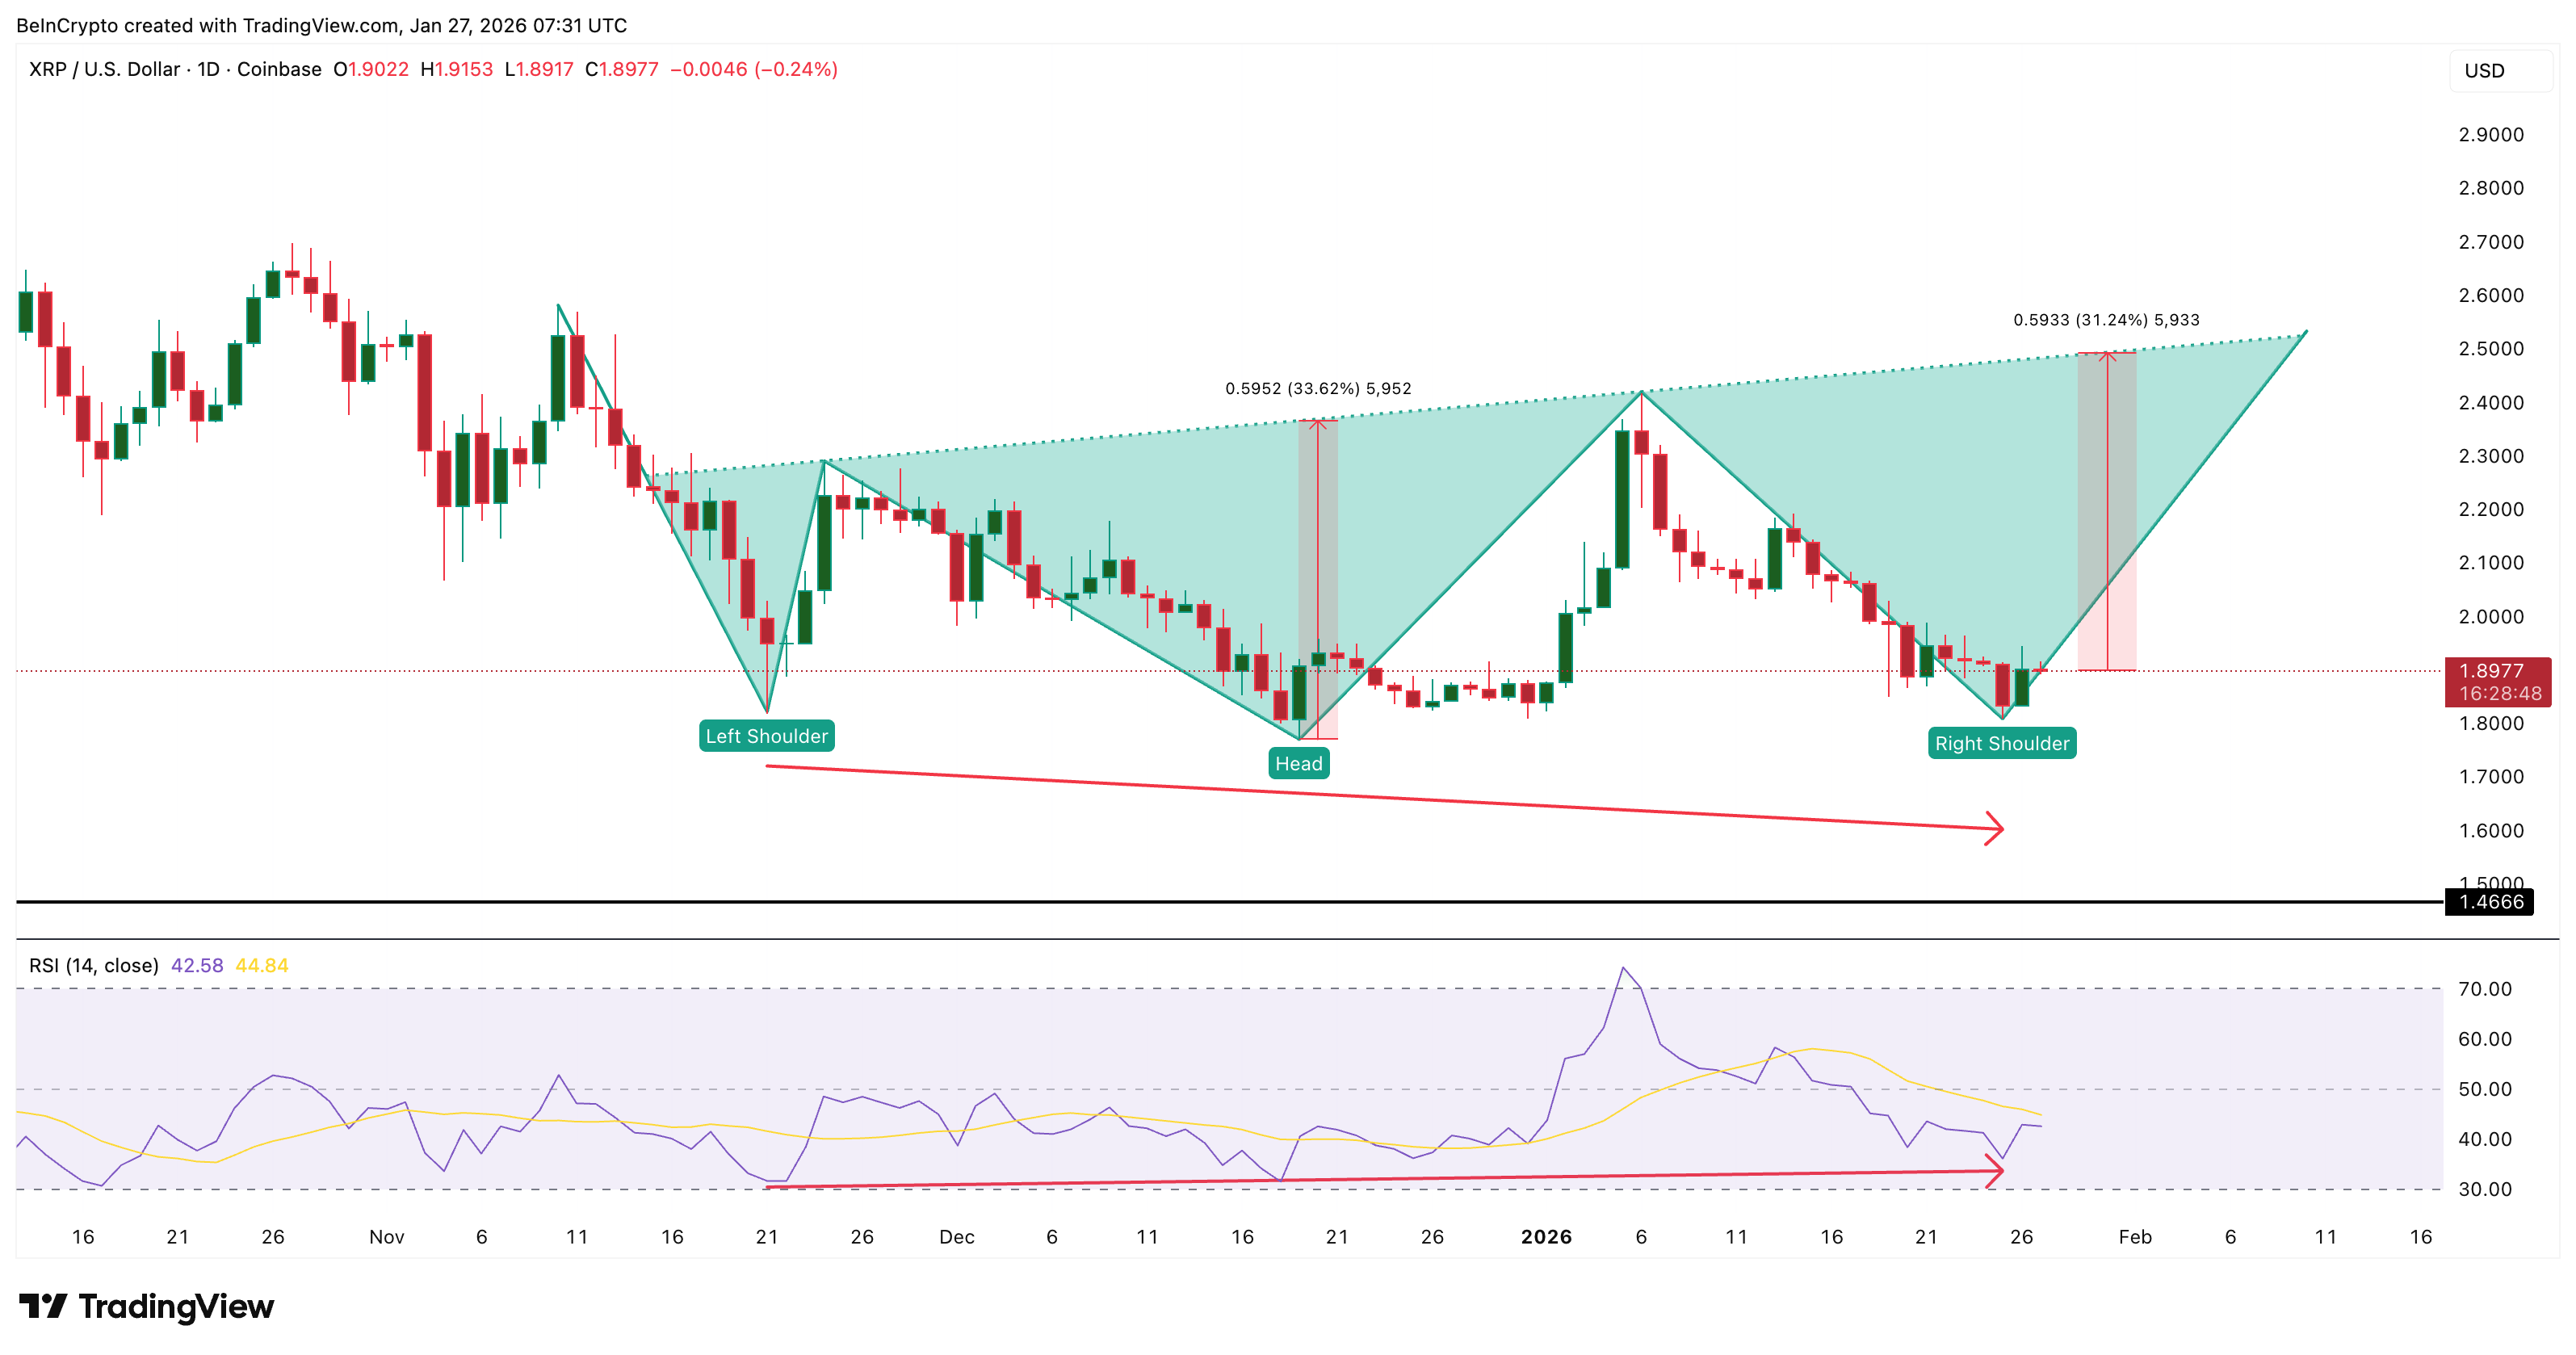
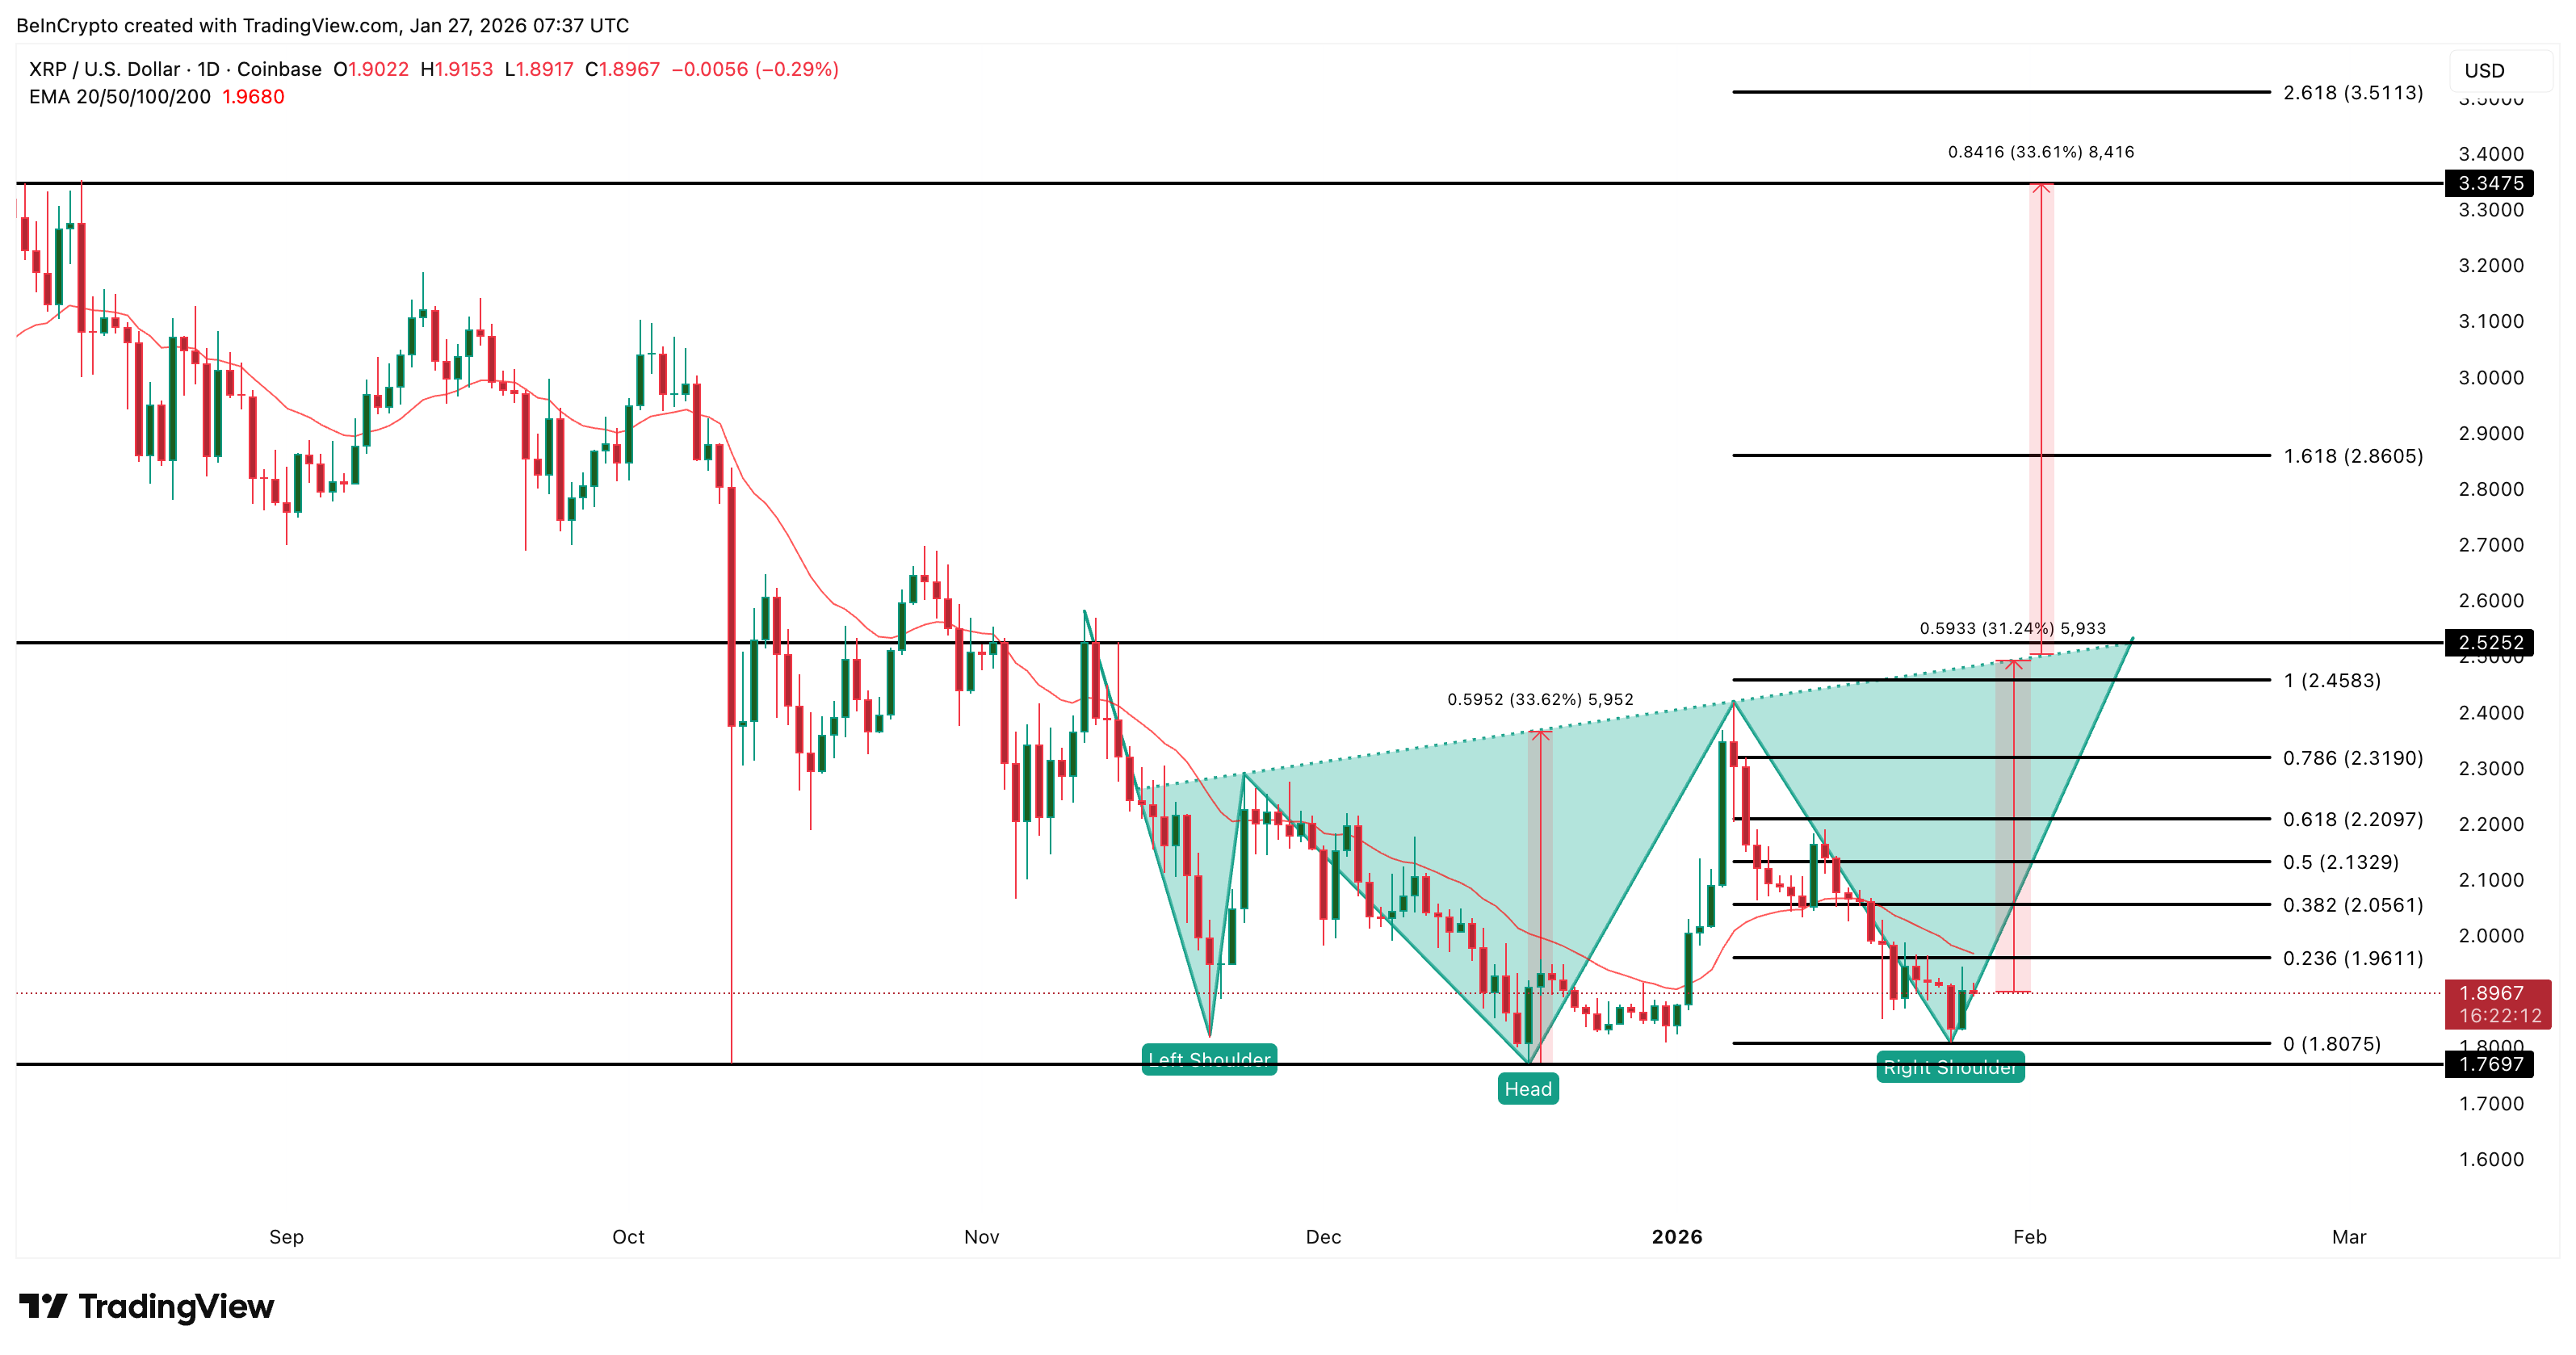
Price Chart Reveals The Domino Setup, Not an Instant Breakout
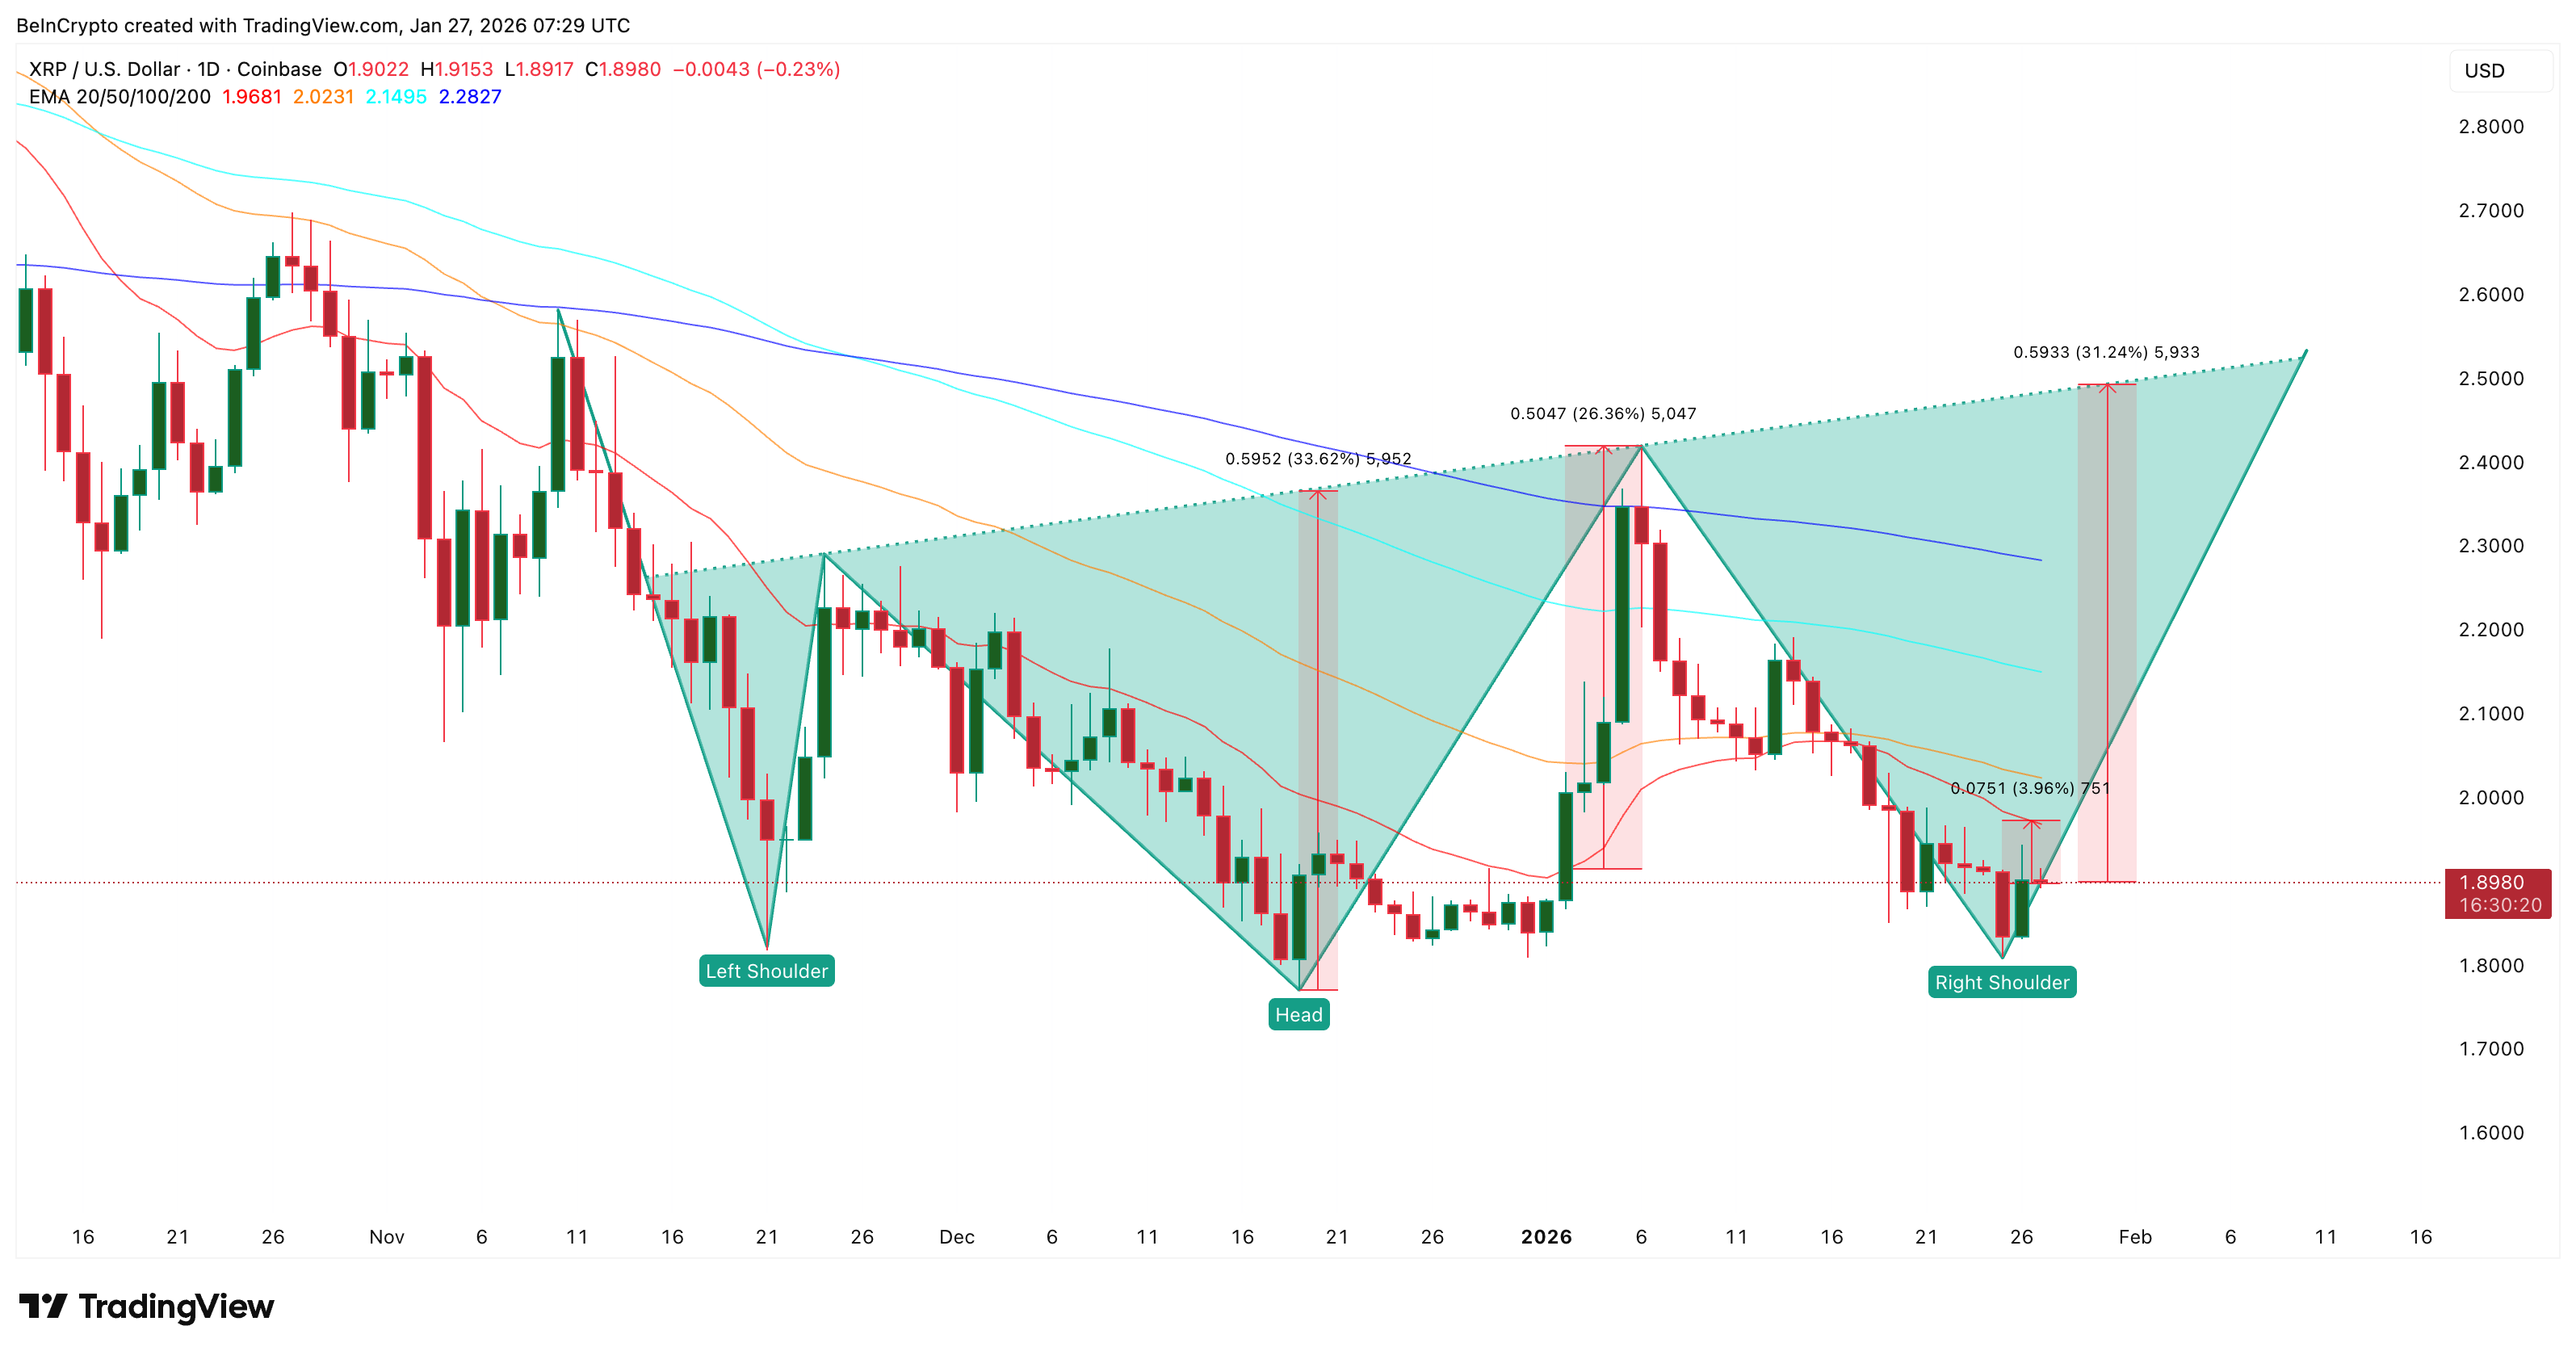
On the price chart, XRP is forming a large inverse head-and-shoulders structure that began in early November. At first glance, the setup looks unrealistic because the neckline sits far above the current price.
From here, XRP would need roughly a 31% move just to reach the neckline. If the breakout happens, the measured upside is around 33%.
That sounds distant, but the domino effect does not start at the neckline. The first trigger is momentum. XRP recently lost its 20-day EMA on January 17. An exponential moving average, or EMA, gives more weight to recent prices and helps track short-term trend strength.
 XRP Price Chart: TradingView
Reclaiming the 20-day EMA would require only a 3–4% daily move. The last time XRP reclaimed this same EMA, on January 2, the price rallied nearly 26%. That kind of push could help XRP reach the neckline faster.
Momentum support is already appearing through RSI. The Relative Strength Index, or RSI, measures whether price momentum is strengthening or weakening.
Between late November and January 25, the XRP price made a lower low, while the RSI formed a higher low. This bullish divergence often signals that selling pressure is fading, even before the price turns higher.
 Bullish Divergence: TradingView
This is how the domino begins:
RSI stabilizes → EMA reclaim follows → momentum builds → neckline comes into play → neckline breaks, activating the breakout.
Whale Accumulation Supports the Final XRP Price Domino Toward $3.30
Large holders appear to be positioning for that sequence. For instance, wallets holding between 10 million and 100 million XRP increased their combined balances from about 11.16 billion to 11.19 billion tokens after January 25.
This buying began shortly after the bullish divergence appeared, suggesting whales are responding to the same momentum shift seen on the chart. The accumulation is cautious, not aggressive, but it aligns with the broader conviction trend.
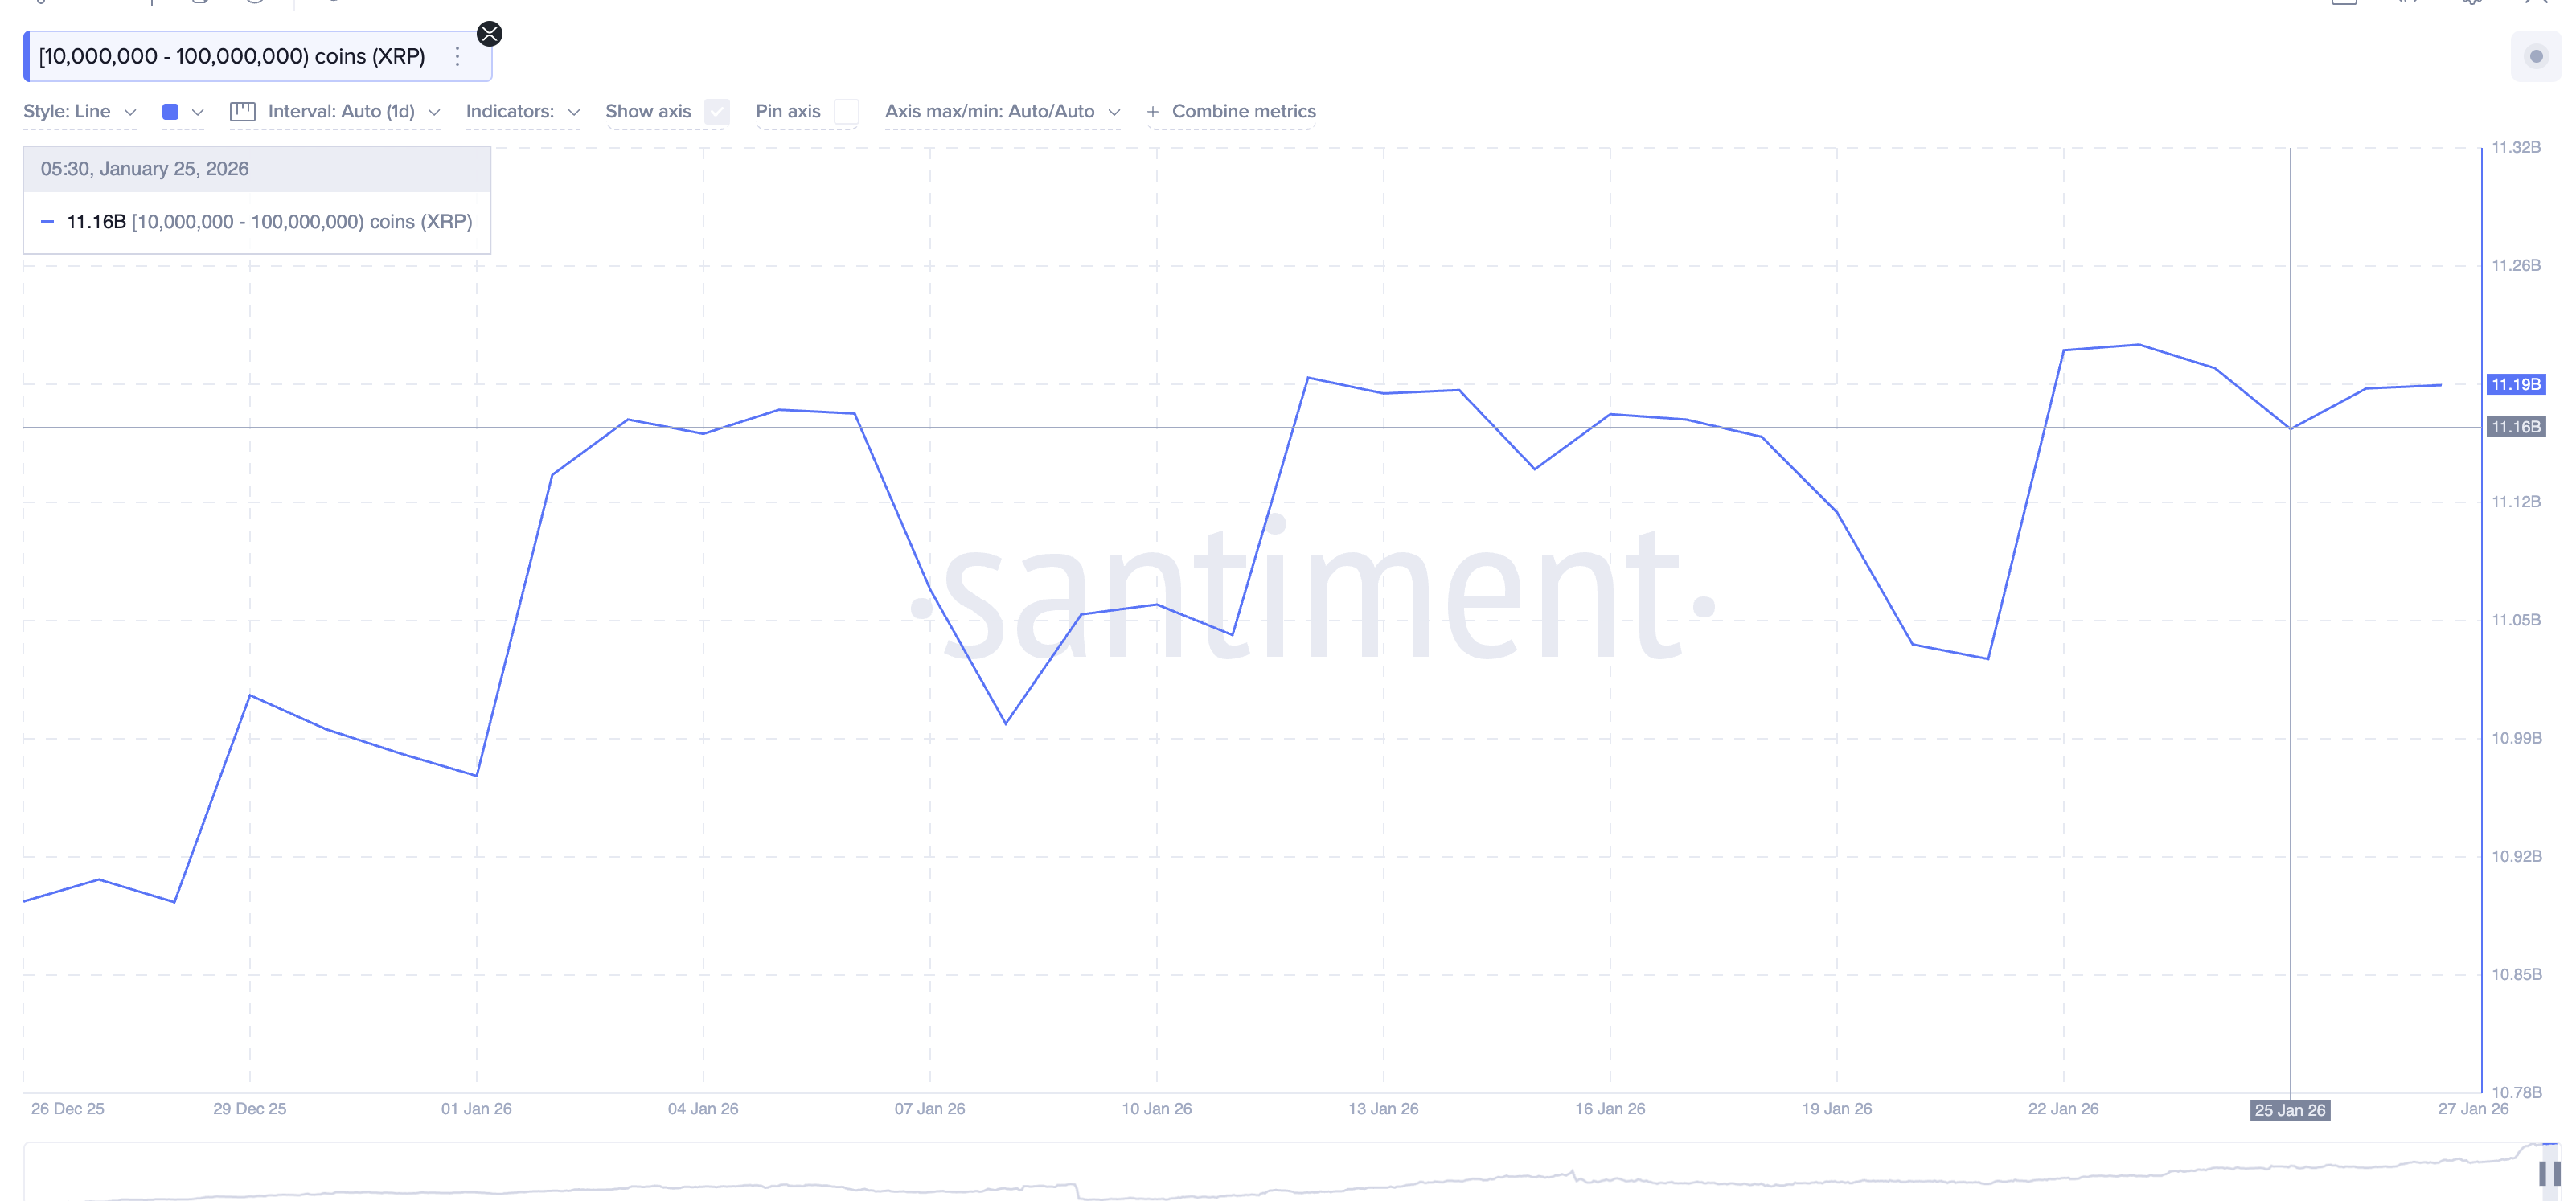 XRP Whales: Santiment
From here, price levels matter.
The XRP price first needs to reclaim the 20-day EMA. Above that, resistance sits near $2.05 and $2.20. A break and hold above $2.52 would put the neckline back in focus.
 XRP Price Analysis: TradingView
If the neckline breaks, the domino effect completes, opening the path toward $3.30 ($3.34 level to be exact), the 33% path projection from head to neckline. Moreover, this was one of the XRP price levels hit last year, in October.
The structure weakens below $1.80 and is fully invalidated below $1.76.
For now, XRP is not breaking out. But the sequence that leads to breakouts is quietly forming.
Recommended Articles


