

Ethereum sees a brief pullback as spot ETH ETF looks to gather momentum
- Ethereum restaking protocol Renzo took a huge hit after its restaked ETH failed to maintain a 1:1 ratio with ETH.
- While Franklin and Grayscale have seen the SEC postpone its decision on their application, BlackRock amended its spot ETH ETF filing.
- Hong Kong's spot ETH ETFs will begin trading on April 30.
Ethereum (ETH) suffered a brief decline on Wednesday afternoon despite increased accumulation from whales. This follows Ethereum restaking protocol Renzo restaked ETH (ezETH) crashing from its 1:1 peg with ETH and increased activities surrounding spot Ethereum ETFs.
Read more: Ethereum continues hinting at rally following reduced long liquidations
Daily digest market movers: Renzo's crash, whale buying, ETH spot ETF
Ethereum witnessed a surge in activities on Wednesday after key events. Here are the top market movers for the number one altcoin:
- Renzo restaked ETH (ezETH) crashed on Wednesday after a downward shift from its 1:1 peg to ETH. According to data from DEXscreener, ezETH dipped to $750, which reduced its ratio to ETH to 0.27. The crash was ignited by a massive dumping of ezETH on decentralized exchanges (DEXs) after Renzo announced the distribution economics for the airdrop of its native REZ token.
Following the crash, loopers — leverage traders that repeat a loop of using their LRTs to borrow, buy and restake — saw liquidations worth $340 million. Many ETH traders capitalized on the price dip, buying ezETH and earning extra ETH after the restaked token recovered its peg, according to Lookonchain.
czsamsunsb.eth made 121.65 $ETH in just 2 hours after $EZETH(Renzo Restaked ETH) depegged!
— Lookonchain (@lookonchain) April 24, 2024
He spent 4,099 $ETH to buy 4,221 $EZETH successfully, making 121.65 $ETH!https://t.co/niluIilTRi pic.twitter.com/hnPWt0DjZD
- While the crash isn't heavy, it calls for investors to revisit earlier counsel by Coinbase analysts and other key crypto community members on the risks in restaking protocols and how they could affect the Ethereum ecosystem. An X user highlighted how a heavier crash could have taken a toll on Ethereum's price.
- Meanwhile, before Renzo experienced its brief moment of chaos, whales were accumulating Ethereum heavily, according to data from Lookonchain. A suspected Justin Sun wallet continued its buying spree, withdrawing 15,389 ETH worth $49.78 million from Binance. The wallet has purchased 147,442 ETH worth $469.9 million at an average $3,179 since April 8.
Also read: Ethereum shows signs of a potential rally as suspected Justin Sun wallet buys heavily
- Things are also heating up on the spot Ethereum ETF front. After the Securities & Exchange Commission (SEC) delayed responding to Franklin's spot ETH ETF application, it also postponed responding to Grayscale's request to convert its Ethereum Trust to a spot ETH ETF by 60 days.
BlackRock also showed it has no intention of withdrawing its spot ETH ETF by filing an amendment to list and trade shares of the ETF under Nasdaq Rule 5711(D), Commodity-based Trust Shares, on Tuesday. No mention of staking was included in BlackRock's amendment. Shortly after, the SEC began asking for public comments on BlackRock's spot ETH ETF amendment.
Many investors pointed out that BlackRock has only lost once when applying for an ETF. An X user commented on BlackRock, "If they thought they were going to be denied, they would have pulled it. They're not in the business of being denied."
Nate Geraci, President of the ETF Store, commented:
I’m now fully recharged from spot btc ETF approval cycle…
— Nate Geraci (@NateGeraci) April 24, 2024
Time for spot eth ETF.
We have broken structure in Grayscale’s ETHE, suboptimal eth futures-based ETFs, etc.
You can buy eth on publicly-traded COIN & HOOD, paying hefty fees.
No reason for spot eth ETF not to exist.
- Many analysts have earlier reduced the odds of the SEC approving a spot Ethereum ETF in May. But things may change as new developments unfold in the market.
- Bloomberg analyst Eric Balchunas confirmed that Hong Kong's spot Bitcoin and Ether ETFs will begin trading on April 30. This may give momentum to the potential rally. ETH's price movement has hinted at a rally since the beginning of the week.
Technical analysis: Ethereum needs strength to break past key level
Ethereum suffered a pullback after briefly breaking past the $3,279 resistance of April 15. The dip is likely a wider market movement as other top cryptocurrencies like Bitcoin, Solana and XRP also shared in the decrease.
The recent decline seems to have cast a shadow of doubt on a potential rally that ETH's price movement has been hinting at. This also shows strong resistance at the upper level of the $2,852 and $3,300 range.
Read more: Ethereum resumes consolidation after brief dip, buyback yield exceeds that of major S&P 500 companies
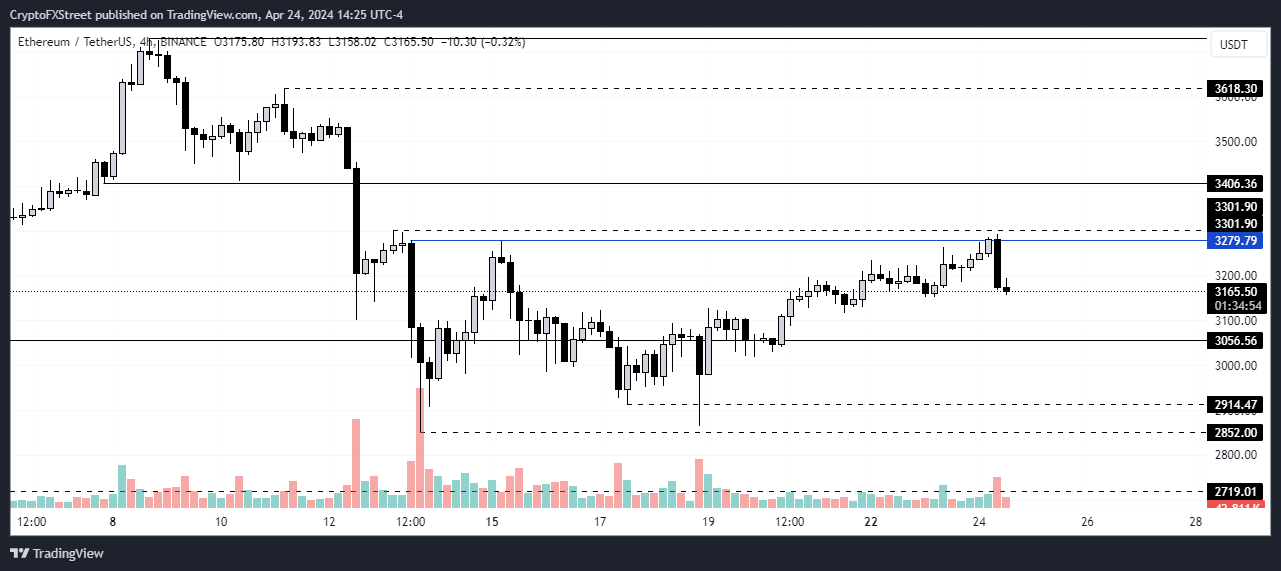
ETH/USDT 4-hour chart
A potential upswing above this range could see ETH do a quick run to break past the $3,406 resistance, confirming its rally. As previously stated, the largest altcoin would need increased trading volume and bullish strength to break above the range.
The SEC's decision on a spot ETH ETF and Bitcoin's price movement will play crucial roles in determining the direction of ETH's price in the coming weeks.
Bitcoin, altcoins, stablecoins FAQs
Bitcoin is the largest cryptocurrency by market capitalization, a virtual currency designed to serve as money. This form of payment cannot be controlled by any one person, group, or entity, which eliminates the need for third-party participation during financial transactions.
Altcoins are any cryptocurrency apart from Bitcoin, but some also regard Ethereum as a non-altcoin because it is from these two cryptocurrencies that forking happens. If this is true, then Litecoin is the first altcoin, forked from the Bitcoin protocol and, therefore, an “improved” version of it.
Stablecoins are cryptocurrencies designed to have a stable price, with their value backed by a reserve of the asset it represents. To achieve this, the value of any one stablecoin is pegged to a commodity or financial instrument, such as the US Dollar (USD), with its supply regulated by an algorithm or demand. The main goal of stablecoins is to provide an on/off-ramp for investors willing to trade and invest in cryptocurrencies. Stablecoins also allow investors to store value since cryptocurrencies, in general, are subject to volatility.
Bitcoin dominance is the ratio of Bitcoin's market capitalization to the total market capitalization of all cryptocurrencies combined. It provides a clear picture of Bitcoin’s interest among investors. A high BTC dominance typically happens before and during a bull run, in which investors resort to investing in relatively stable and high market capitalization cryptocurrency like Bitcoin. A drop in BTC dominance usually means that investors are moving their capital and/or profits to altcoins in a quest for higher returns, which usually triggers an explosion of altcoin rallies.
Recommended Articles


