


68% of XLM Traders Are Short—Could Accumulation Still Trigger a Reversal?
Stellar’s price has remained under pressure as broader crypto market weakness continues to weigh on altcoins. XLM has declined steadily, validating a bearish chart pattern and reinforcing short-term downside risks.
While traders may look to capitalize on this momentum, on-chain behavior suggests XLM holders are positioning differently.
Stellar Holders Could Rescue XLM
Derivatives data highlights a clear imbalance in market positioning. The liquidation map shows exposure skewed roughly 68% toward short traders, signaling strong bearish conviction. Such dominance often increases sensitivity to volatility, as crowded trades amplify price reactions when momentum shifts.
Below current levels, a dense cluster of long liquidation leverage sits between $0.20 and $0.185. A move into this zone could trigger forced liquidations, adding selling pressure and accelerating a decline. This setup explains why bears are eyeing further downside, as liquidity pockets remain vulnerable under key supports.
Want more token insights like this? Sign up for Editor Harsh Notariya’s Daily Crypto Newsletter here.
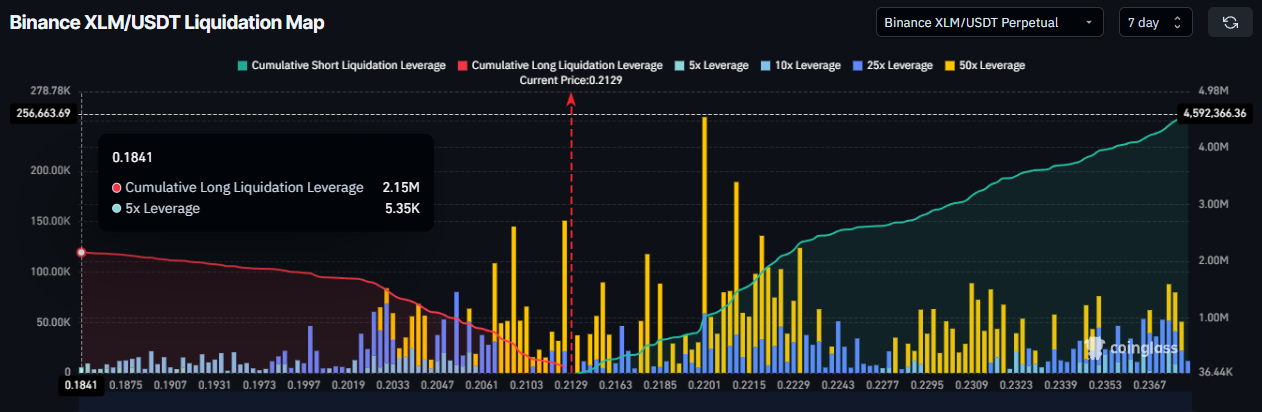 XLM Liquidation Map. Source: Coinglass
Despite bearish positioning, macro indicators offer early signs of divergence. The Chaikin Money Flow has formed higher lows for four consecutive days, even as the XLM price printed lower lows. This bullish divergence suggests capital inflows are increasing beneath the surface.
CMF tracks buying and selling pressure through price and volume. Rising CMF during a price decline often signals accumulation rather than distribution. For Stellar, this pattern implies investors are gradually building positions, creating conditions for a potential short-term reversal once selling pressure fades.
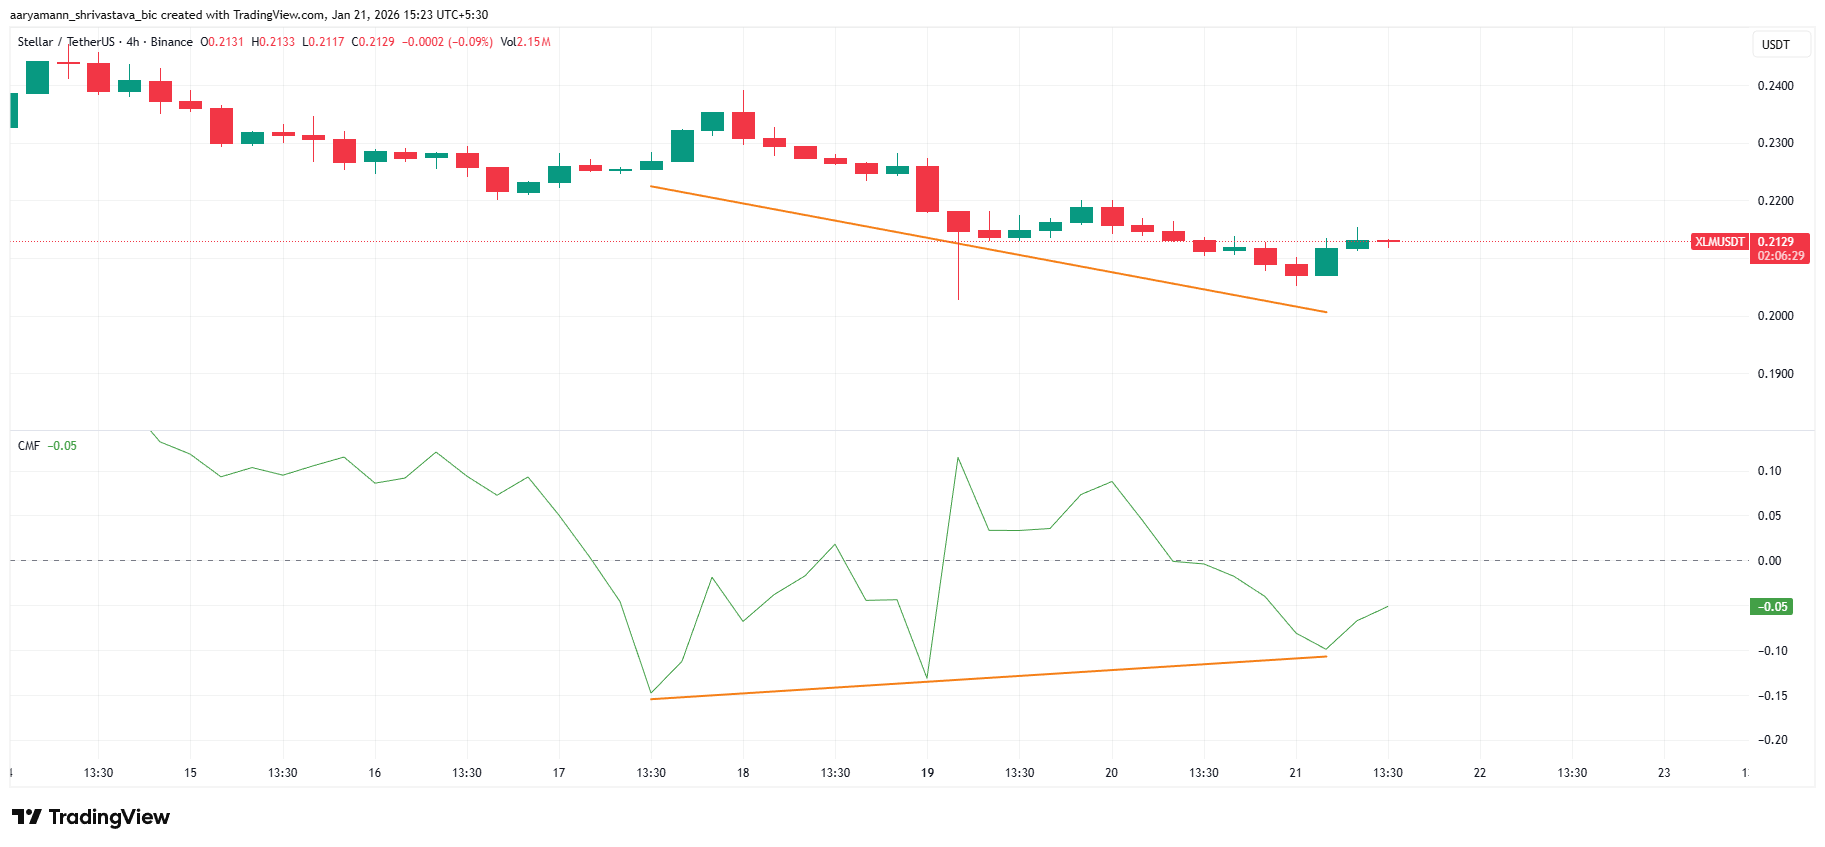 XLM CMF. Source: TradingView
XLM Price Needs To Secure Support
XLM trades near $0.212 at the time of writing, holding just above the $0.210 support level. Earlier this week, the altcoin broke down from a descending triangle pattern, a formation that typically favors bearish continuation. That breakdown keeps downside risks elevated in the near term.
The descending triangle projects a potential 14% drop toward $0.188, placing XLM roughly 11% away from the target. However, the price may stabilize before reaching that level. Support is likely to emerge around $0.210 or, at worst, near $0.201. This uncertainty supports a neutral-to-bearish outlook.
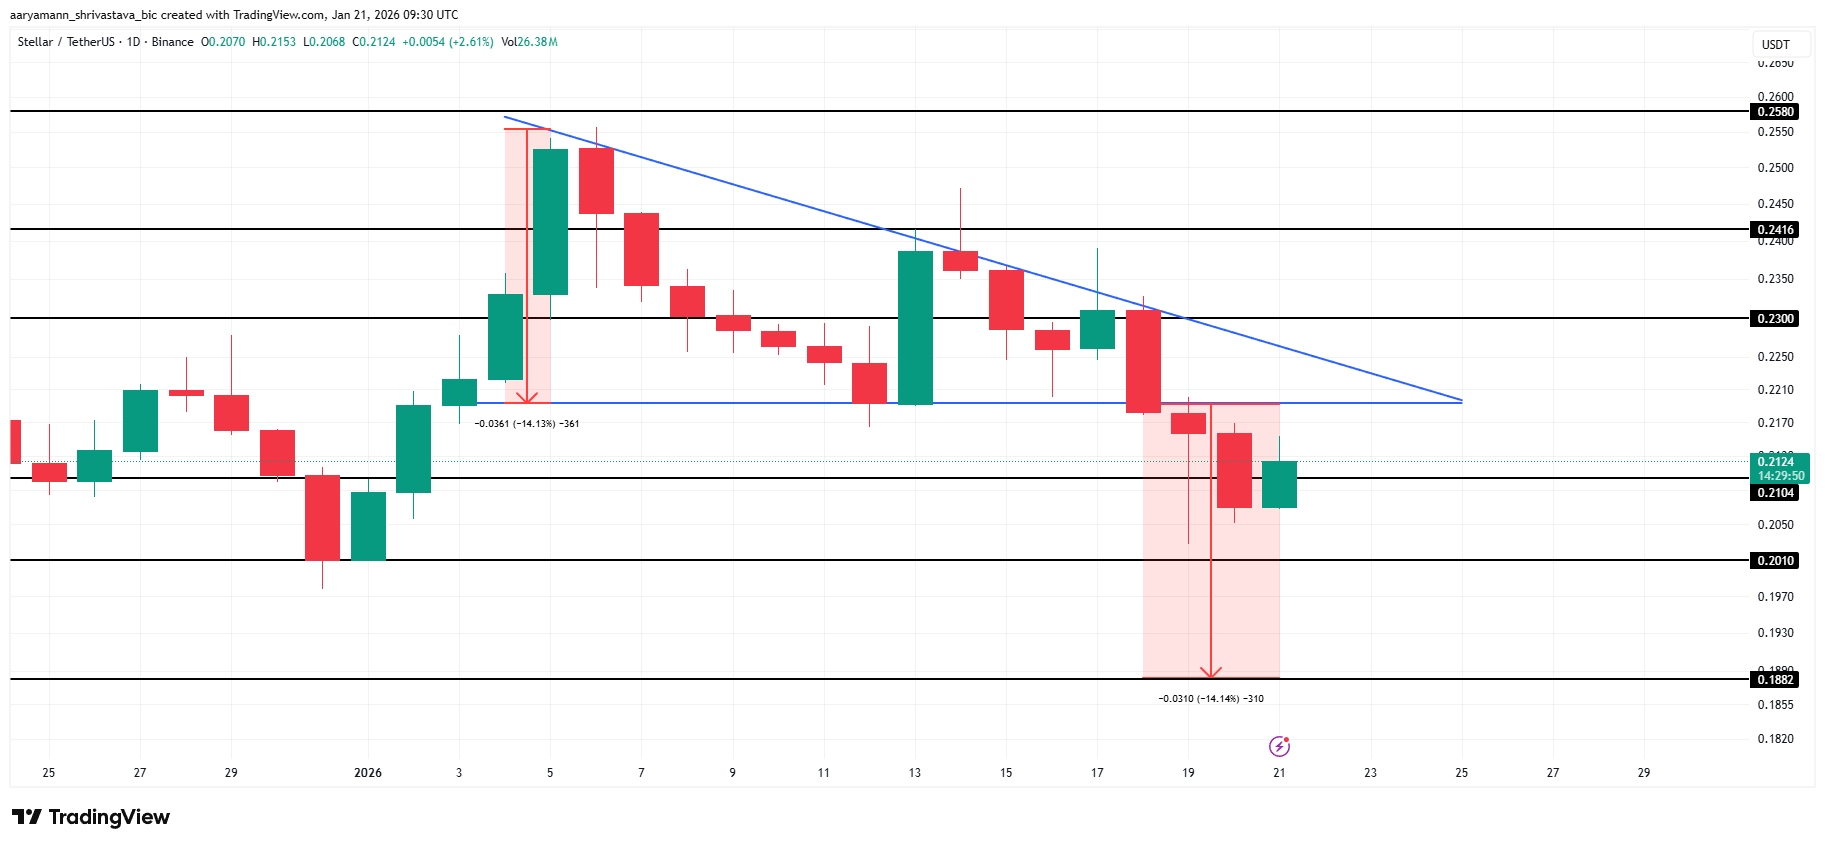 XLM Price Analysis. Source: TradingView
A shift in momentum depends on defending key levels. If $0.210 holds as support, Stellar could regain stability. A sustained bounce may push XLM toward the $0.230 resistance zone. Reclaiming that level would invalidate the bearish pattern and signal a short-term reversal driven by improving demand.
Recommended Articles


