Ethereum Price Signals Reversal and $3,400 Is Imminent, Here’s Why

Source Newsbtc

Ethereum price is gaining pace above the $3,120 resistance zone. ETH could continue to move up unless there is a daily close below the $3,030 level.

  • Ethereum extended its increase above the $3,150 resistance zone.
  • The price is trading above $3,150 and the 100-hourly Simple Moving Average.
  • There is a connecting bullish trend line forming with support at $3,160 on the hourly chart of ETH/USD (data feed via Kraken).
  • The pair could continue to move up unless the bears push it below the $3,030 zone.

Ethereum Price Extends Increase

Ethereum price started a recovery wave and was able to clear the $3,000 resistance, like Bitcoin. ETH even climbed above the $3,050 and $3,120 resistance levels to move into a positive zone.

It traded to a new weekly high at $3,234 and is currently consolidating gains. There was a minor decline below the $3,200 level. Ether dipped below the 23.6% Fib retracement level of the recent increase from the $3,120 swing low to the $3,234 high.

Ethereum is now trading above $3,150 and the 100-hourly Simple Moving Average. There is also a connecting bullish trend line forming with support at $3,160 on the hourly chart of ETH/USD. The trend line is close to the 61.8% Fib retracement level of the recent increase from the $3,120 swing low to the $3,234 high.

Immediate resistance is near the $3,210 level. The first major resistance is near the $3,235 level. The next key resistance sits at $3,280, above which the price might gain traction and rise toward the $3,350 level.

Ethereum Price

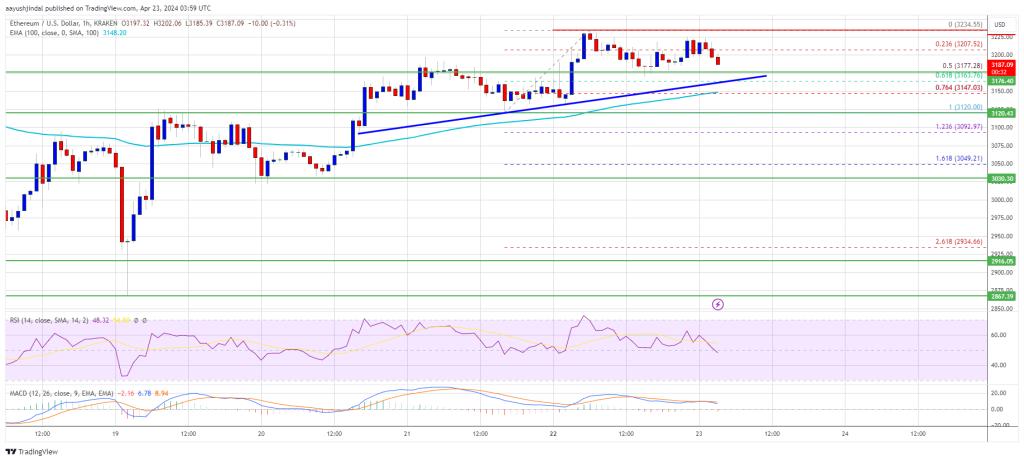
Source: ETHUSD on TradingView.com

A close above the $3,350 resistance could send the price toward the $3,500 resistance. If there is a move above the $3,500 resistance, Ethereum could even test the $3,550 resistance. Any more gains could send Ether toward the $3,720 resistance zone in the coming days.

Downside Correction In ETH?

If Ethereum fails to clear the $3,235 resistance, it could start a downside correction. Initial support on the downside is near the $3,175 level. The first major support is near the $3,160 zone and the trend line.

The main support is near the $3,150 level and the 100-hourly Simple Moving Average. A clear move below the $3,150 support might increase selling pressure and send the price toward $3,030. Any more losses might send the price toward the $2,850 level in the near term.

Technical Indicators

Hourly MACDThe MACD for ETH/USD is losing momentum in the bullish zone.

Hourly RSIThe RSI for ETH/USD is now below the 50 level.

Major Support Level – $3,150

Major Resistance Level – $3,235

Disclaimer: For information purposes only. Past performance is not indicative of future results.
placeholder
A Crash After a Surge: Why Silver Lost 40% in a Week?TradingKey - Spot Silver ( XAGUSD) prices have continued to decline; on Thursday, silver plummeted as much as 20% to break below $71 per ounce, and on Friday the sell-off intensified as prices fell fu
Author  TradingKey
Feb 06, Fri
TradingKey - Spot Silver ( XAGUSD) prices have continued to decline; on Thursday, silver plummeted as much as 20% to break below $71 per ounce, and on Friday the sell-off intensified as prices fell fu
placeholder
Bitcoin is trading around $63,000, down nearly 40% from its peak near $126,000Wall Street desks are no longer talking about upside dreams. The talk right now is how far Bitcoin charts could fall if selling keeps piling up. According to data from TradingView, Bitcoin’s price now sits at a shocking $63,500, after falling from $70,000 just this morning, losing $13,000 in 6 days, and staying far below […]
Author  Cryptopolitan
Feb 06, Fri
Wall Street desks are no longer talking about upside dreams. The talk right now is how far Bitcoin charts could fall if selling keeps piling up. According to data from TradingView, Bitcoin’s price now sits at a shocking $63,500, after falling from $70,000 just this morning, losing $13,000 in 6 days, and staying far below […]
placeholder
WTI declines below $63.00 as US-Iran talks loom West Texas Intermediate (WTI), the US crude oil benchmark, is trading around $62.85 during the Asian trading hours on Friday. The WTI price declines after the United States (US) and Iran agreed to hold talks in Oman on Friday. 
Author  FXStreet
Feb 06, Fri
West Texas Intermediate (WTI), the US crude oil benchmark, is trading around $62.85 during the Asian trading hours on Friday. The WTI price declines after the United States (US) and Iran agreed to hold talks in Oman on Friday. 
placeholder
Bitcoin Surrenders $65,000 as Analysts Warn of ‘Structural’ Market BreakBitcoin plunges 11% to break $65k as analysts term the crash "structural," citing a $1 trillion market wipeout and $2.09 billion in daily liquidations.
Author  Mitrade
Feb 06, Fri
Bitcoin plunges 11% to break $65k as analysts term the crash "structural," citing a $1 trillion market wipeout and $2.09 billion in daily liquidations.
placeholder
Bitcoin Drops to $70,000. U.S. Government Refuses to Bail Out Market, End of Bull Market or Golden Pit? The U.S. government refuses to bail out Bitcoin, and with Fed rate cuts nowhere in sight, a continued downward trend to test for a bottom is likely after a brief rebound.During the mid-da
Author  TradingKey
Feb 05, Thu
The U.S. government refuses to bail out Bitcoin, and with Fed rate cuts nowhere in sight, a continued downward trend to test for a bottom is likely after a brief rebound.During the mid-da
goTop
quote