
XRP ETFs Remain in Green but Inflows Hit a Record Low: How Will Price React?
XRP price is holding above $2.08, but the breakout is not confirming yet. The reason is not price weakness alone. It is timing. Over the past week, XRP spot ETF inflows dropped to their weakest level since trading began, lining up with a visible slowdown in upside momentum.
At the same time, long-term holders have started buying aggressively. This creates a rare conflict between institutional demand and long-term conviction, leaving XRP at a decisive point.
Weakest XRP ETF Inflow Week Delays Pattern Confirmation
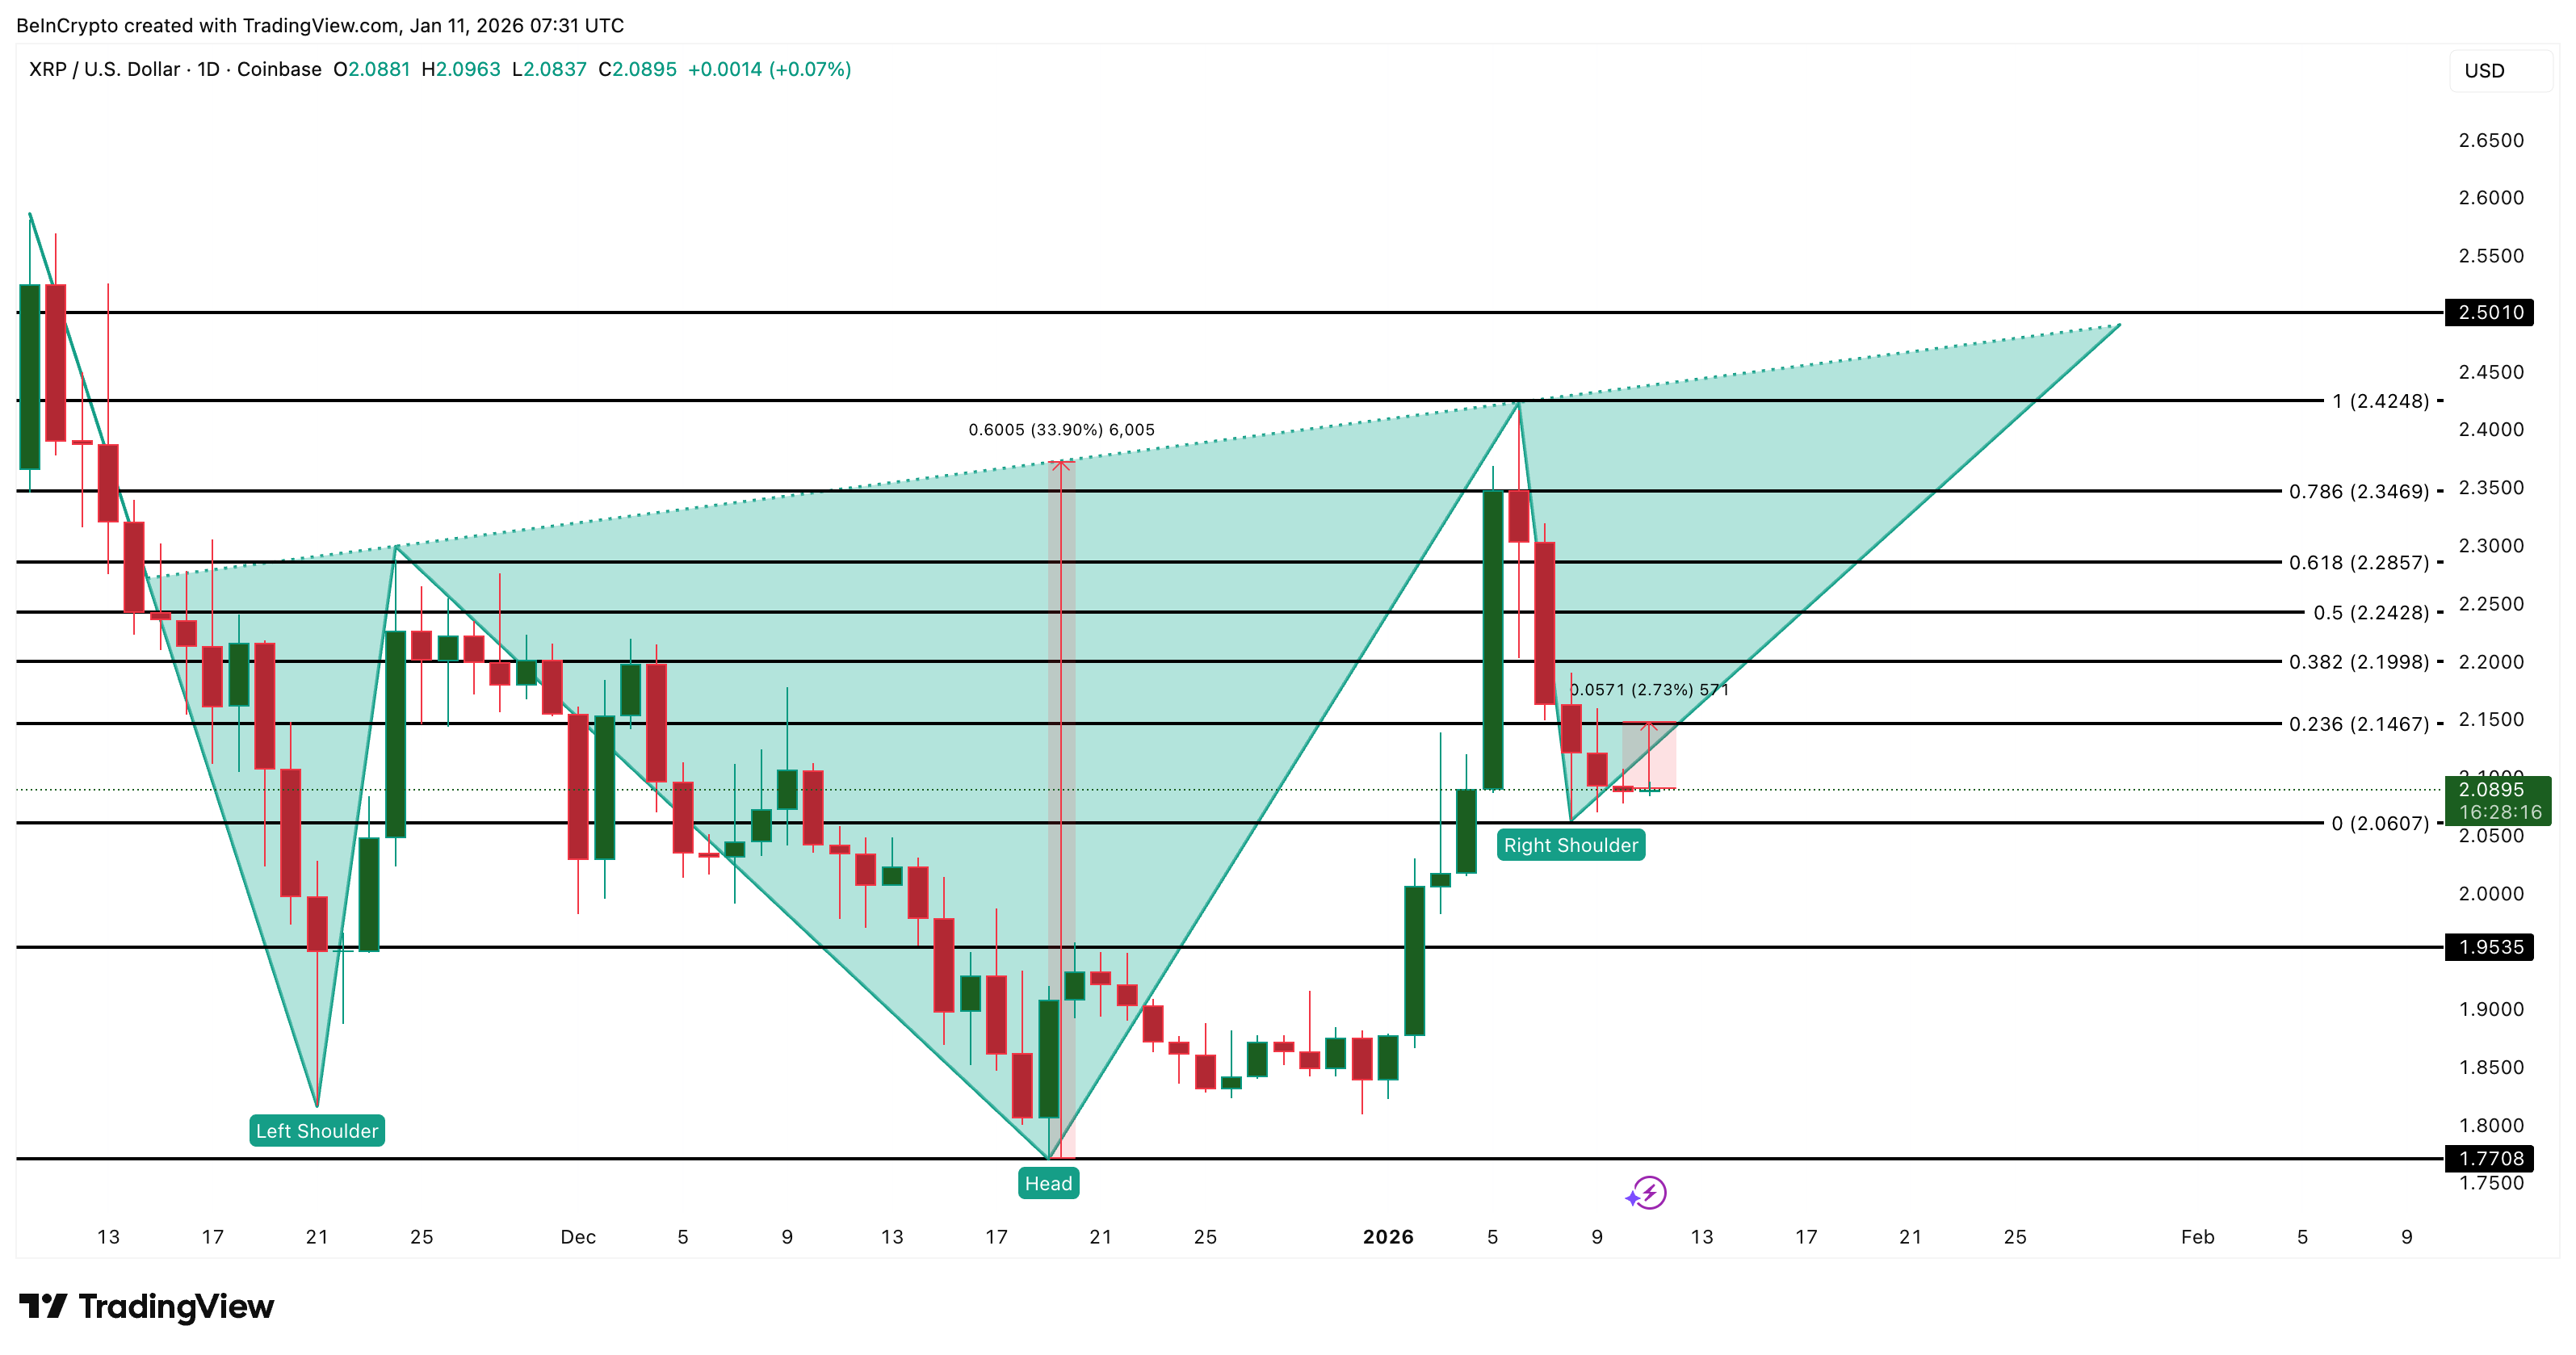
XRP is still trading inside a bullish inverse head and shoulders structure on the daily chart. The pattern remains valid, but the breakout has stalled. Price is holding above the right shoulder near $2.08, yet it remains far from confirming the neckline.
That delay lines up directly with ETF data.
During the week ending January 9, XRP spot ETFs recorded just $38.07 million in net inflows. This is the lowest weekly inflow since launch, down nearly 84% from the late-November peak near $244 million. The timing matters.
The sharpest part of XRP’s pullback occurred between January 6 and January 9, exactly when ETF demand cooled the most.
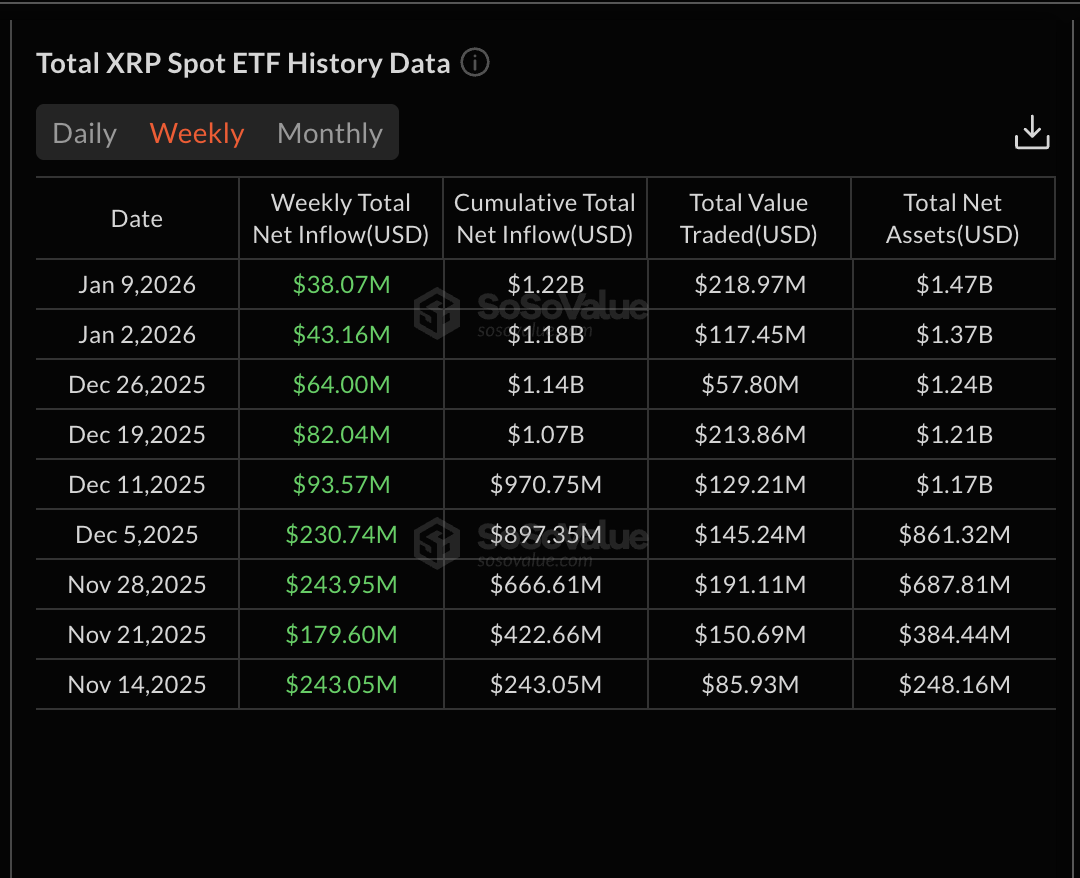 ETF Inflows Weaken: SoSo Value
Want more token insights like this? Sign up for Editor Harsh Notariya’s Daily Crypto Newsletter here.
This does not invalidate the bullish pattern. It explains why the breakout has not triggered yet. Inverse head and shoulders patterns need steady follow-through demand near the neckline. With ETF inflows fading during the right-shoulder phase, price action stalled instead of accelerating.
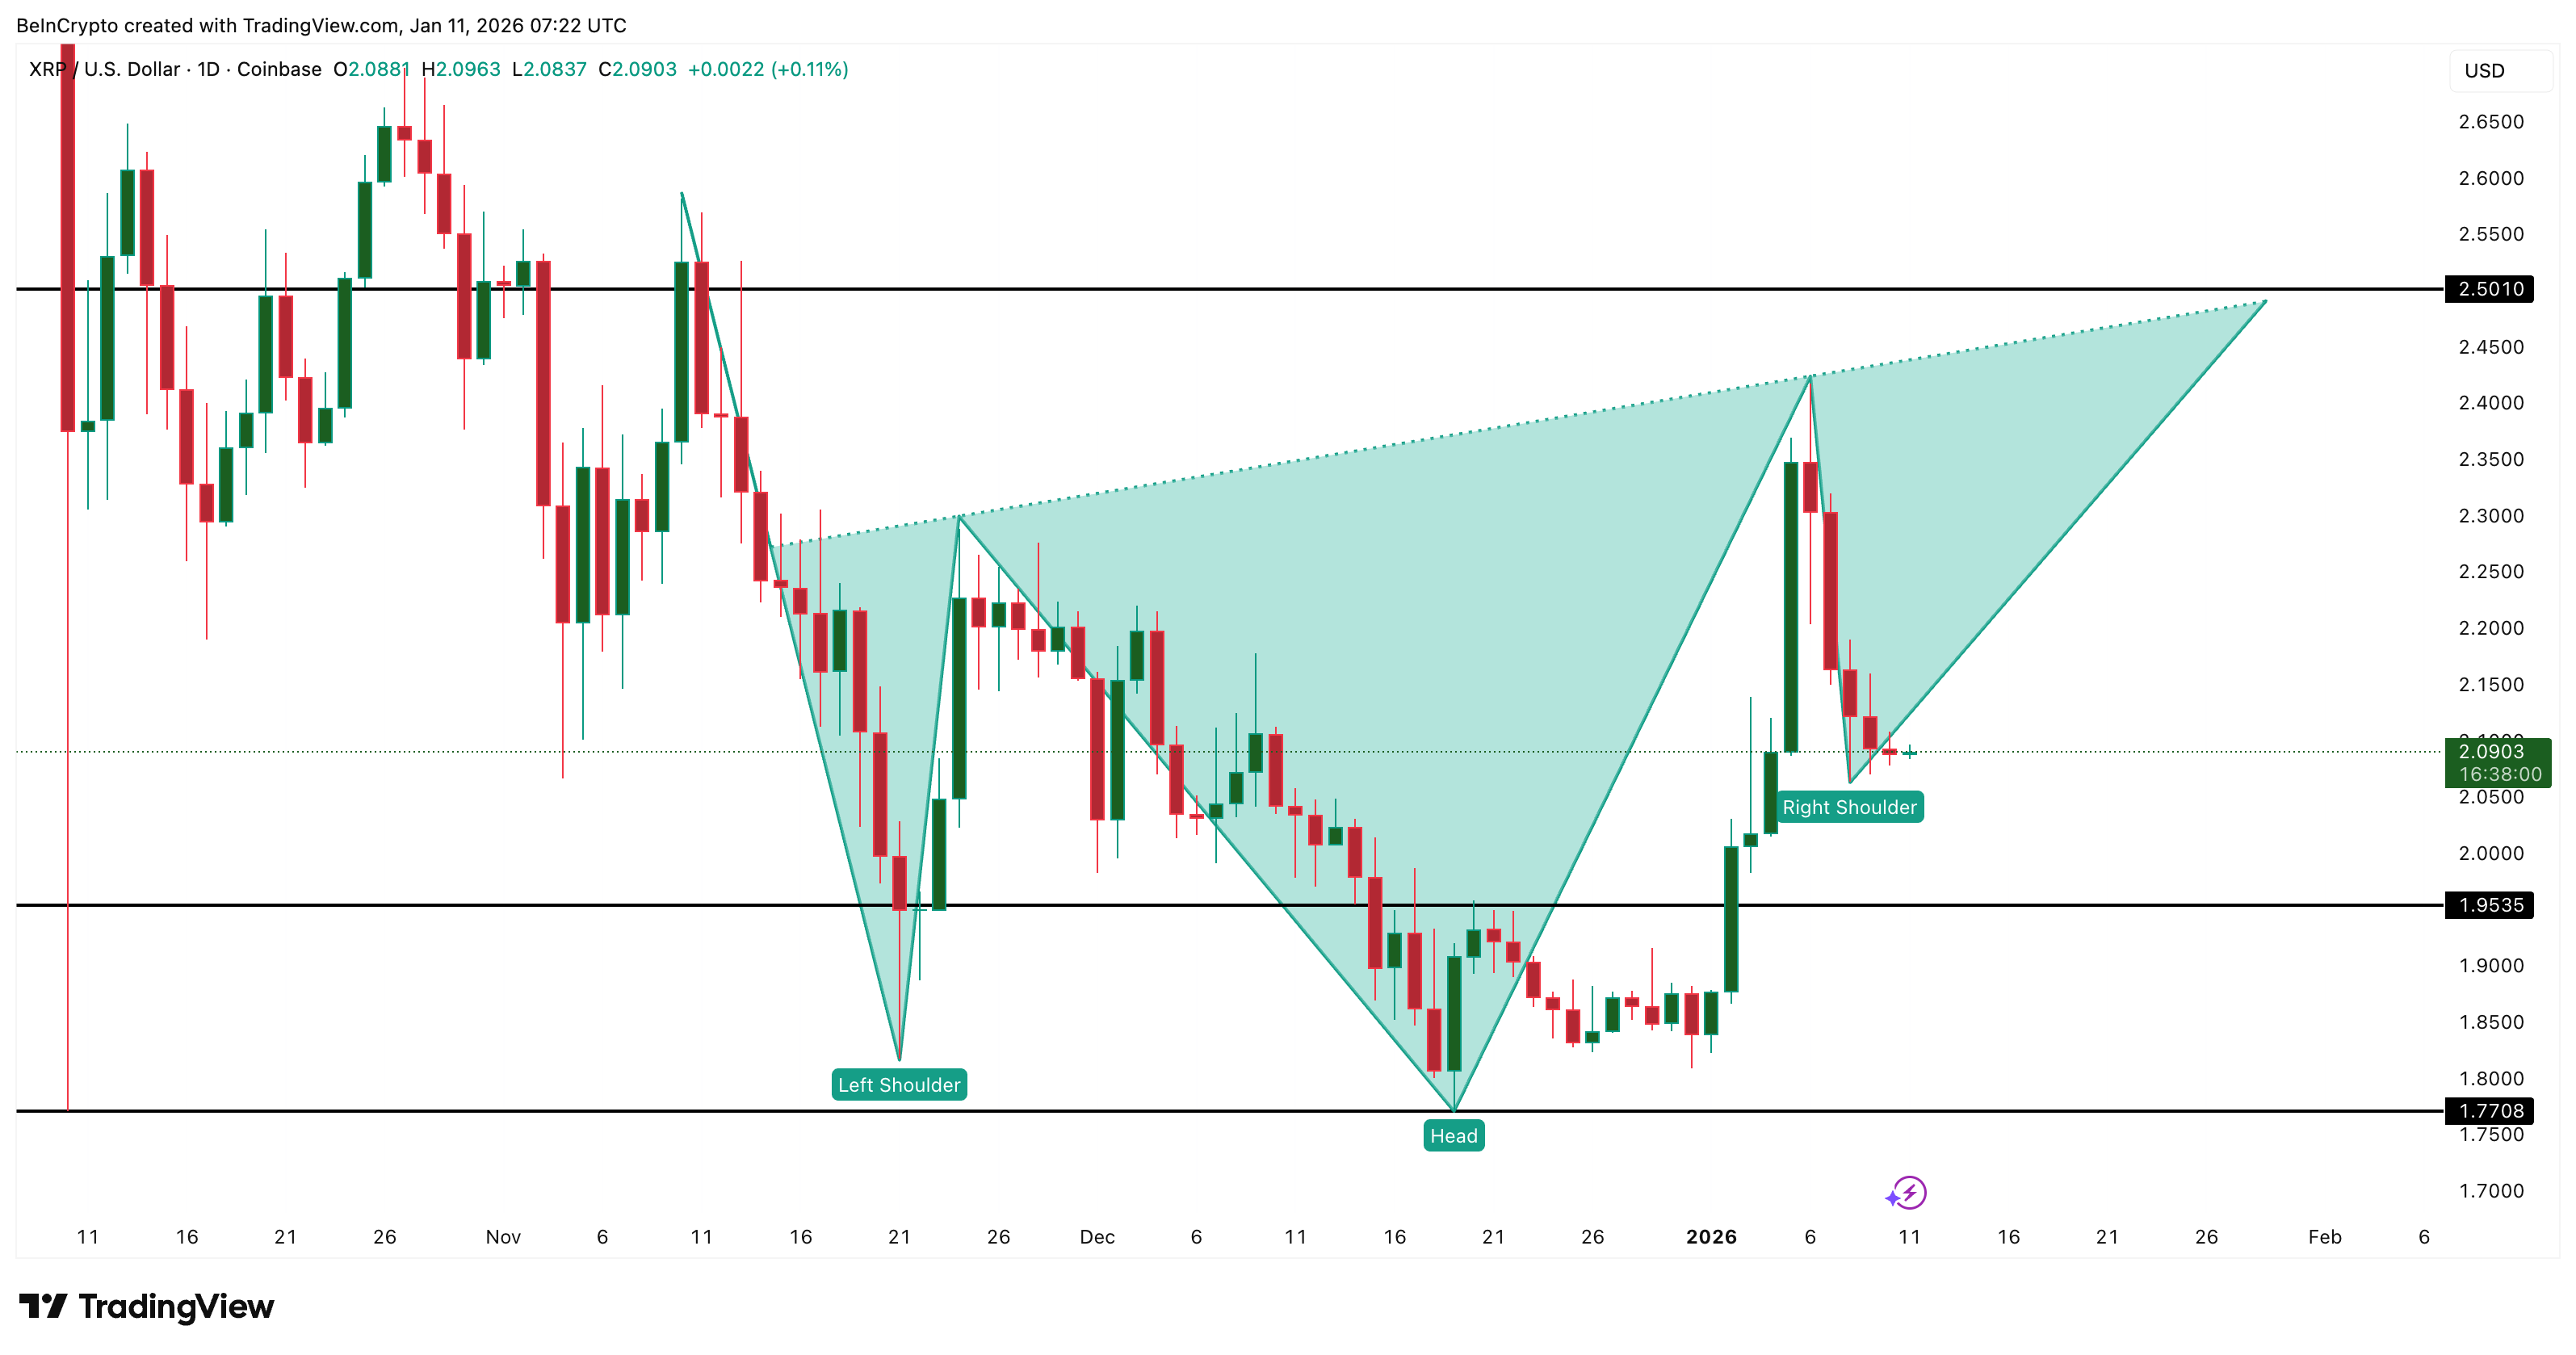 Delayed XRP Breakout: TradingView
Another detail adds friction. The neckline, near $2.50, itself is sloping upward, meaning the XRP price needs both price strength and sustained demand to confirm the move. Right now, the ETF side of that equation has been missing.
Holder Accumulation Surges as Key Supply Zones Come Into Focus
While ETF demand weakened, something else changed sharply.
Between January 9 and January 10, XRP holder net position change spiked from roughly 62.4 million XRP to 239.5 million XRP. That is an increase of nearly 300% in 24 hours. This metric tracks net accumulation by holders. A spike of this size signals strong accumulation, not short-term trading.
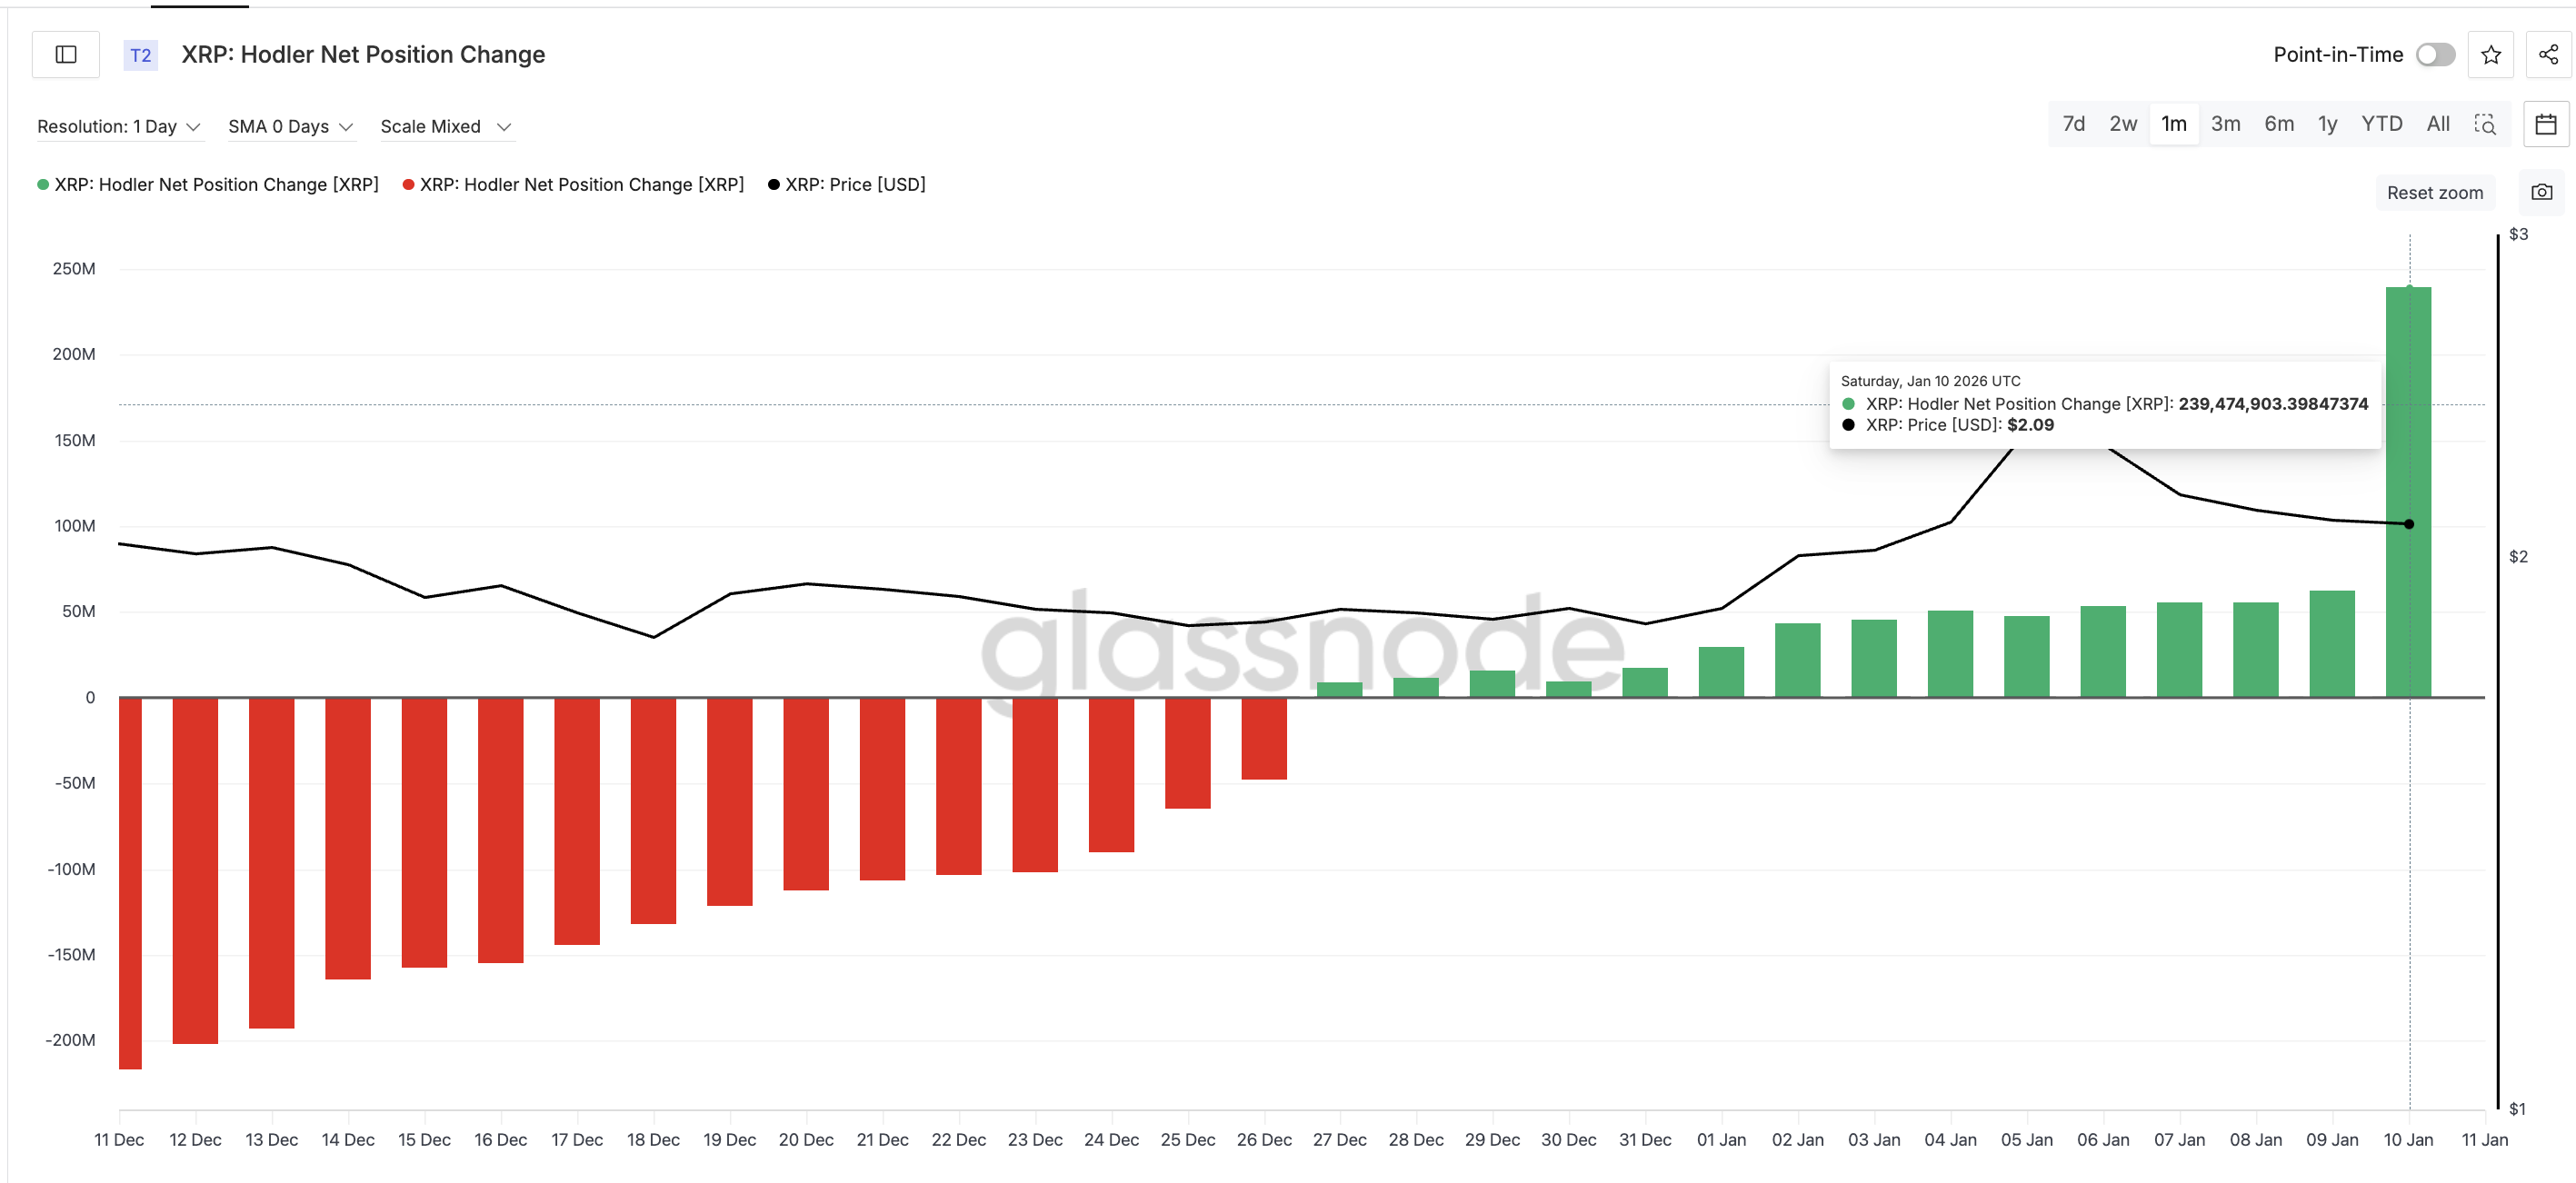 XRP Holders Buying Aggressively: Glassnode
This matters because it offsets the ETF slowdown. Even as institutional ETF demand paused, long-term holders stepped in aggressively.
The cost basis heatmap explains where this buying pressure runs into resistance.
The first major supply cluster sits between $2.14 and $2.15, where roughly 1.88 billion XRP were accumulated. XRP is currently trading just below this zone. A daily close above it would mark the first real supply break.
Now, for this massive cluster to break, the XRP price would need a lot more than just long-term holder conviction. It would also need ETF support once the window reopens tomorrow.
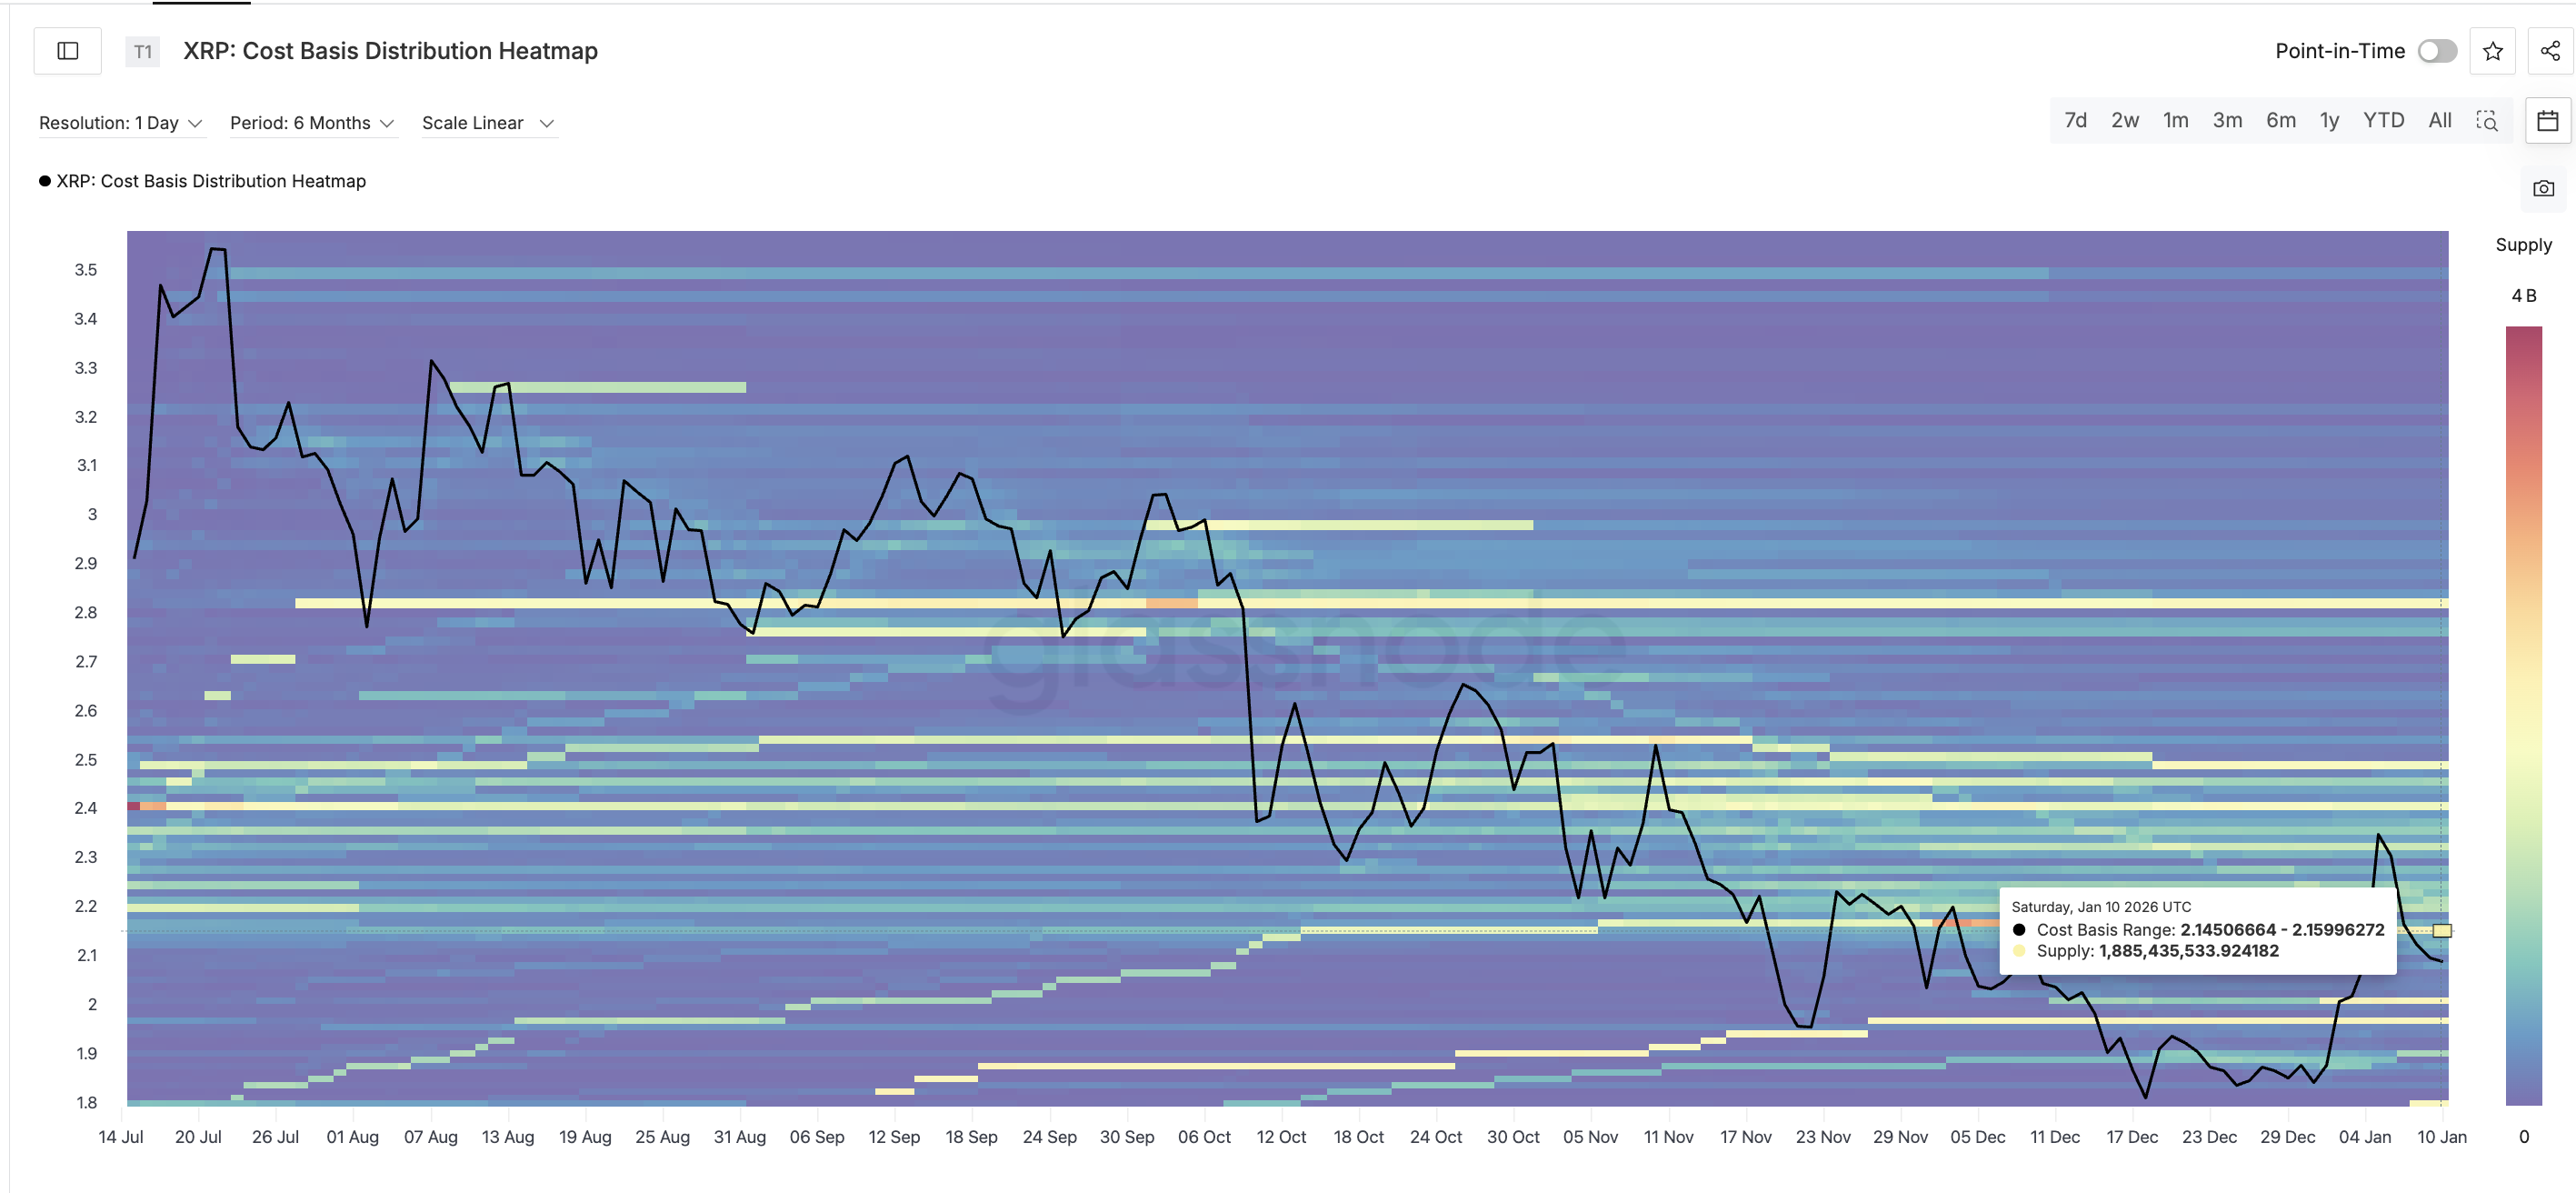 Key XRP Supply Cluster: Glassnode
Above that, the next and more critical cluster sits between $2.48 and $2.50, where around 1.62 billion XRP are held. This zone aligns closely with the inverse head and shoulders neckline. Clearing it would not just be a technical breakout. It would mean the price is moving through two dense holder supply layers.
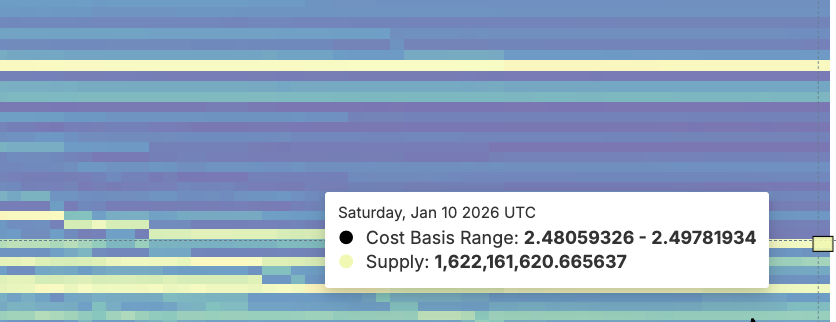 Neckline Cluster: Glassnode
This is why the ETF pause has not caused a breakdown. Long-term accumulation is absorbing pressure, keeping XRP stable while the market waits for the next demand trigger.
XRP Price Levels That Decide Whether the Breakout Finally Triggers
XRP price is now compressed between conviction buying and delayed confirmation. The levels ahead are clear.
The first level to watch is $2.15 ($2.146 to be precise). A daily close above this zone would place XRP above its nearest supply cluster and confirm that recent holder accumulation is winning.
Above that, $2.28 comes into focus, aligning with the 0.618 Fibonacci retracement. Clearing it would open the path toward $2.42, followed by the neckline zone near $2.50.
A clean break and close above $2.50 would confirm the inverse head and shoulders breakout and activate the projected 34% upside from current levels.
 XRP Price Analysis: TradingView
On the downside, $2.06 remains critical support. Losing this range would weaken the right shoulder and delay the bullish structure further, though it would not invalidate it outright.
For now, the XRP price is not rejecting the breakout. It is waiting. ETF demand cooled at the worst possible time for confirmation, but long-term holders have stepped in with force. Whether XRP breaks higher now depends on one thing: can fresh demand push price through $2.15 and then $2.50 before that conviction fades.
Recommended Articles


